Two bar charts side-by-side. Both show the probability distribution of X ~ B(16, 1/6), representing the number of sixes rolled in 16 rolls of a fair die. The x-axis ranges from 0 to 16 (number of sixes), and the y-axis shows probability. In the left chart, bars for X ≤ 5 are shaded. In the right chart, bars for X ≥ 6 are shaded. The distributions are skewed right.
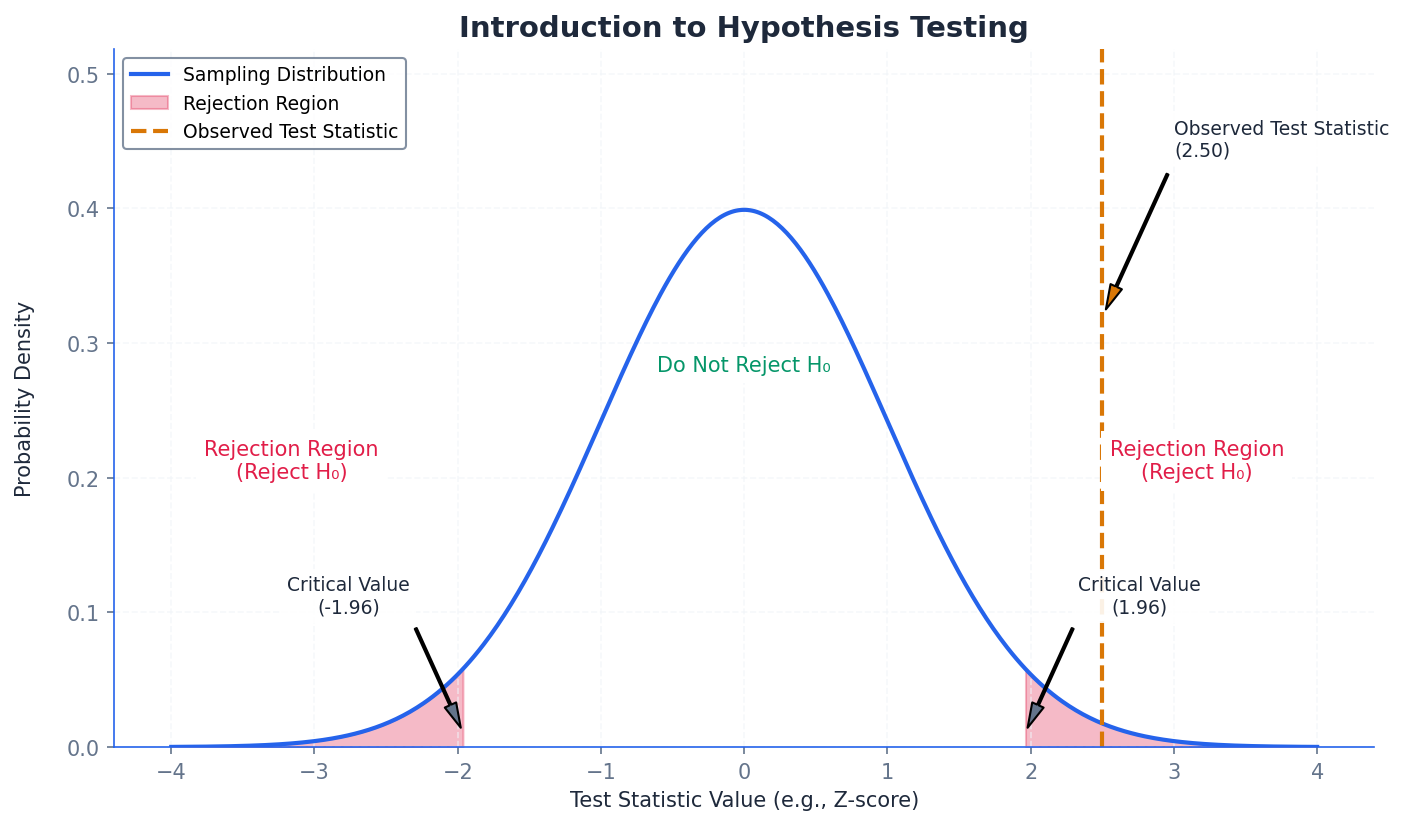
Hypothesis testing is a formal procedure to decide whether to accept or reject a claim about a population parameter.
It involves comparing observed sample data with what would be expected if the claim were true.
The process helps quantify the evidence against a .
Examiner Tip
Understand that hypothesis testing is about evaluating evidence against a claim, not proving a claim. The initial claim is always about a population parameter.
The origins of modern hypothesis testing can be traced back to the work of Ronald Fisher and Jerzy Neyman in the early 20th century.
Two bar charts side-by-side. Both show the probability distribution of X ~ B(16, 1/6), representing the number of sixes rolled in 16 rolls of a fair die. The x-axis ranges from 0 to 16 (number of sixes), and the y-axis shows probability. In the left chart, bars for X ≤ 5 are shaded. In the right chart, bars for X ≥ 6 are shaded. The distributions are skewed right.
Hypothesis testing is a formal procedure to decide whether to accept or reject a claim about a population parameter.
It involves comparing observed sample data with what would be expected if the claim were true.
The process helps quantify the evidence against a .
Examiner Tip
Understand that hypothesis testing is about evaluating evidence against a claim, not proving a claim. The initial claim is always about a population parameter.
The origins of modern hypothesis testing can be traced back to the work of Ronald Fisher and Jerzy Neyman in the early 20th century.