Nexelia Academy · Official Revision Notes
Complete A-Level revision notes · 54 chapters
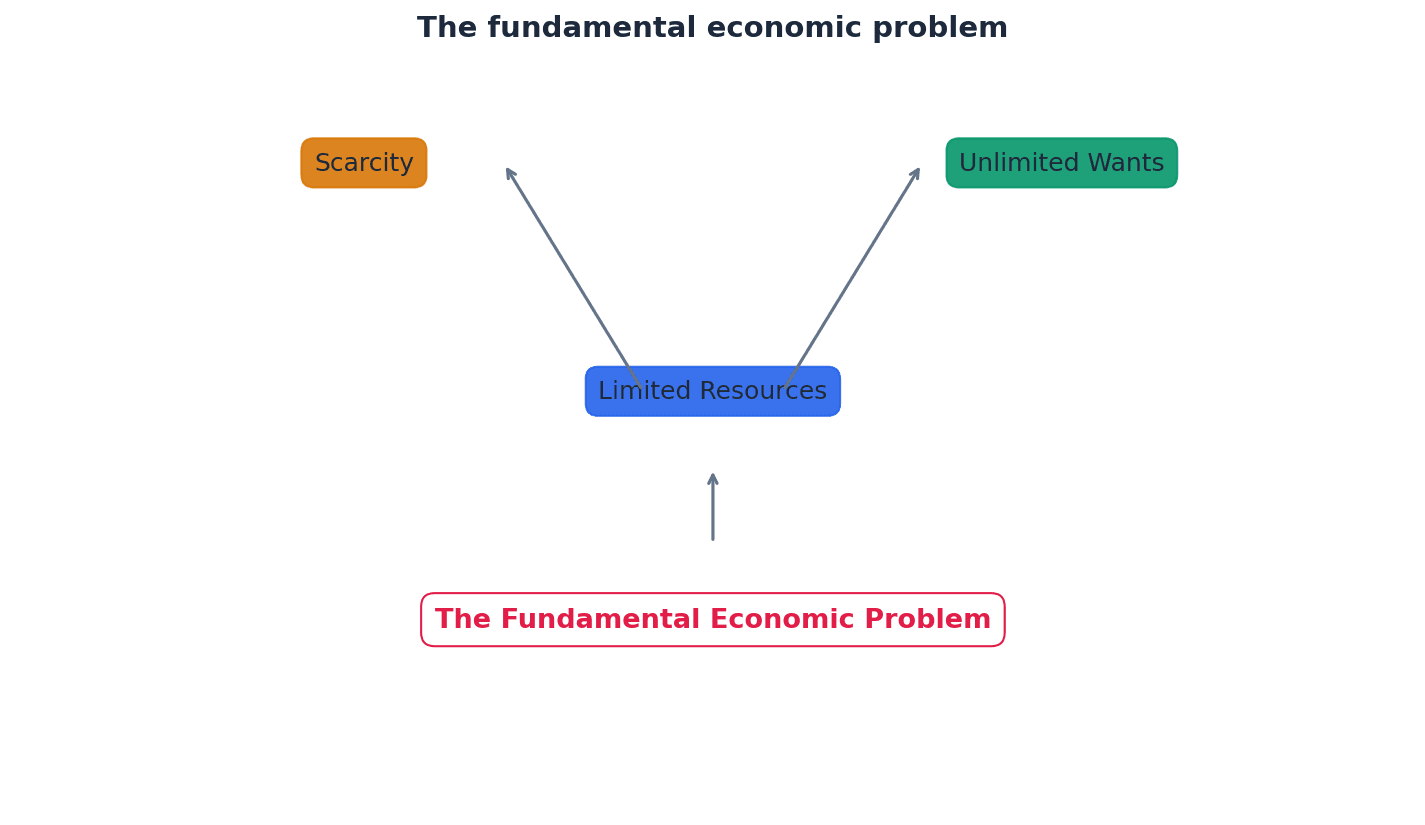
This chapter introduces the fundamental economic problem of scarcity, which arises because human wants are unlimited while resources are limited. This necessitates individuals, firms, and governments to make choices, leading to the concept of opportunity cost, defined as the next best alternative foregone. All economies must address three basic questions of resource allocation: what to produce, how to produce, and for whom to produce.
Resources — Inputs used to produce goods and services.
These are the factors of production available in an economy, such as land, labour, capital, and enterprise. Resources are finite, meaning there is a limited supply of them, which contributes to the fundamental economic problem. Think of resources like the ingredients in a kitchen; you only have a certain amount of flour, sugar, and eggs, so you can't bake every cake you want simultaneously.
Students often think resources are just money, but actually resources include all inputs like raw materials, labour, and machinery.
Needs — Things like food, shelter and clothing that are needed for survival.
Needs are basic requirements for human existence, forming the foundation of an individual's scale of preference. While essential, even needs can be satisfied in various ways, leading to choices. Needs are like the basic functions of a smartphone – calling, texting, internet access – without which it wouldn't be a phone.
Wants — Things that people desire, which are always likely to be something else whatever their income.
Wants are unlimited and continually expanding, developing, and changing, driven by factors like culture, upbringing, life experiences, and observing others. They are distinct from needs, which are essential for survival. Imagine a child in a toy store; they always want the next new toy, even after getting one. This endless desire for more is what economists mean by unlimited wants.
Students often confuse wants with needs, but needs are essential for survival while wants are desires that improve quality of life.
Clearly distinguish between 'wants' and 'needs' in your answers; using them interchangeably will lose marks as they have distinct economic meanings.
Scarcity — The fundamental economic problem that arises because resources are scarce while people’s wants are unlimited.
Scarcity means that society does not have enough resources to produce all the goods and services necessary to satisfy everyone's wants. This necessitates making choices about how to allocate limited resources. If you have a small garden plot (limited resources) but want to grow every type of fruit, vegetable, and flower imaginable (unlimited wants), you face scarcity and must choose what to plant.
Students often think scarcity means there is simply not enough of something, but it specifically means there isn't enough to satisfy all human wants.
When defining scarcity, always include both 'limited resources' and 'unlimited wants' to demonstrate a complete understanding of the concept.
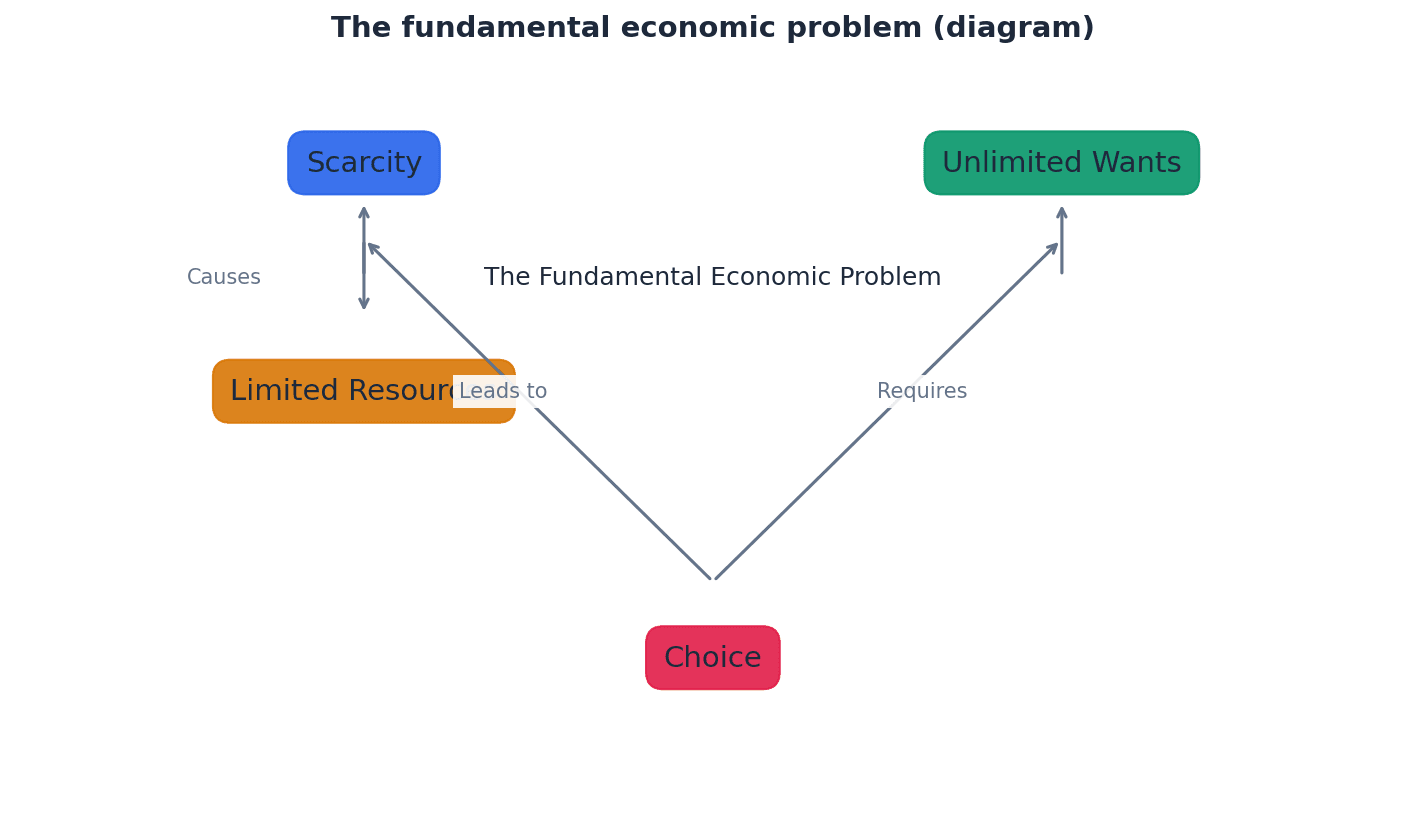
The fundamental economic problem stems from the reality that human wants are unlimited, while the resources available to satisfy these wants are limited. This inherent imbalance, known as scarcity, forces all economic agents – individuals, firms, and governments – to make choices about how to allocate their finite resources. Understanding why scarcity occurs is crucial to comprehending economic decision-making.
Choice — Taking decisions on how to allocate scarce resources between many competing uses.
Because resources are scarce and wants are unlimited, individuals, firms, and governments must make choices about which wants to satisfy. Every choice made implies foregoing other alternatives. Choosing what to watch on TV when there are many channels available means you are making a choice, and you cannot watch all shows simultaneously.
Students often think choice is simply picking something, but actually in economics, choice always implies a trade-off due to scarcity.
Opportunity cost — The cost of the choice in terms of the next best alternative.
Whenever a choice is made between alternatives due to scarcity, the opportunity cost is what is given up. It represents the real cost of a decision and is a recurring theme in economics. If you choose to spend your Saturday studying for an exam, the opportunity cost is the next best thing you could have done, like going to a football game with friends.
Students often think opportunity cost is all the alternatives foregone, but it is only the single next best alternative that is given up.
When calculating or identifying opportunity cost, ensure you specify the *next best* alternative, not just any alternative, to earn full marks.
The necessity of making choices due to scarcity directly leads to the concept of opportunity cost. Since resources are limited, satisfying one want means that another cannot be satisfied. The opportunity cost is the value of the next best alternative that is foregone when a choice is made. This concept applies to individuals, firms, and governments alike, as they all face resource constraints.
Scale of preference — Each individual’s scale of preference is a product of a set of influences, including culture, upbringing and life experiences, on which you place your more urgent wants at the top and the less urgent ones at the bottom.
This concept highlights that individuals prioritize their wants based on personal factors, leading to variations in what is considered essential or luxury. It explains why choices differ between people and how these preferences can evolve over time. Imagine making a shopping list for a limited budget. You'd put the absolute necessities like milk and bread at the top, and then less urgent items like a new gadget further down. Your friend's list might be completely different based on their own priorities.
Students often think everyone has the same scale of preference, but it is highly individual and influenced by personal circumstances and experiences.
Given the fundamental economic problem of scarcity, all economies, regardless of their structure, must answer three basic questions regarding the allocation of their limited resources. These questions are: What to produce? How to produce? and For whom to produce? The answers to these questions determine how a society addresses its economic challenges and satisfies its wants.
This question addresses which goods and services an economy will prioritize producing from its limited resources. Societies must decide between, for example, producing more consumer goods or more capital goods, or between public services like healthcare and private goods. These decisions reflect the collective choices and priorities of a society, often influenced by individual scales of preference.
This question concerns the methods and techniques used to produce the chosen goods and services. It involves decisions about the combination of resources (land, labour, capital, enterprise) to employ, the level of technology, and the organization of production. For instance, a society might choose between labour-intensive or capital-intensive production methods, considering efficiency and resource availability.
This question addresses how the goods and services produced will be distributed among the population. It involves decisions about income distribution, access to goods and services, and social equity. Societies must determine who benefits from production, whether it's based on income, need, or other criteria, which has significant implications for social welfare and economic equality.
Link 'choice' directly to 'scarcity' and 'opportunity cost' in your explanations, as these concepts are fundamentally interconnected.
When discussing basic economic problems, ensure you highlight that even after needs are met, wants remain unlimited, driving the problem of scarcity.
In case studies, actively look for examples of scarcity, the choices being made, and the resulting opportunity costs.
Advantages & Disadvantages
Unlimited Wants
Scarcity
Evaluation Starters
Essay Structure Guide
Introduction
Begin by defining the fundamental economic problem of scarcity, linking it to unlimited wants and limited resources. State that this problem necessitates choices and leads to opportunity cost, and that all economies must answer three basic questions.
Conclusion
Summarize the interconnectedness of scarcity, choice, and opportunity cost as core economic principles. Reiterate that these concepts are central to understanding how economies function and allocate resources.
This chapter introduces economic methodology, explaining why economics is considered a social science due to its study of human behavior and use of scientific processes. It differentiates between positive statements (factual and testable) and normative statements (subjective and value-based), and discusses key analytical tools like ceteris paribus and the importance of different time periods for economic analysis.
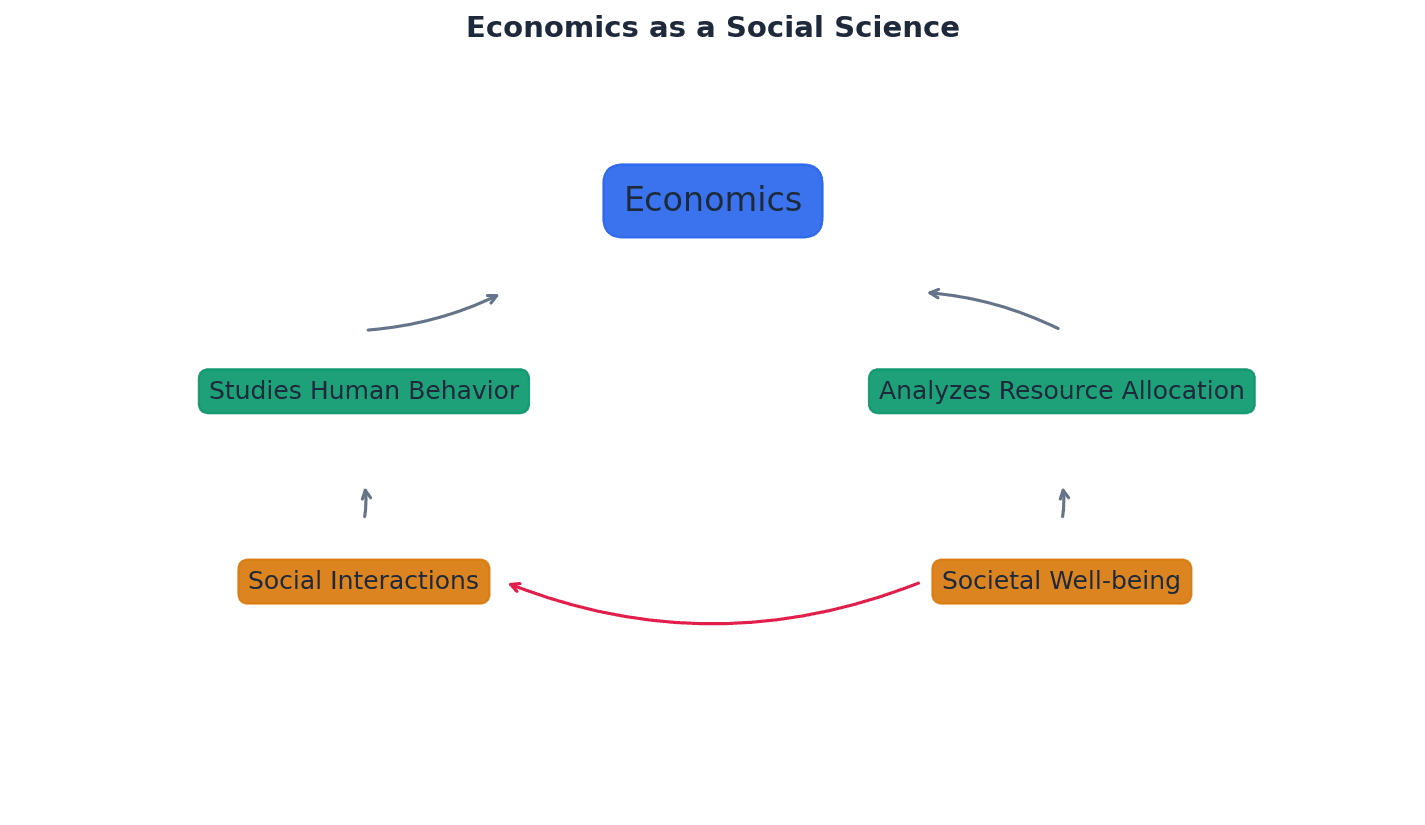
Economics is considered a social science because it studies human behavior and uses scientific processes to develop models. This approach allows economists to analyze how individuals and societies make choices in the face of scarcity, applying systematic methods to understand complex interactions.
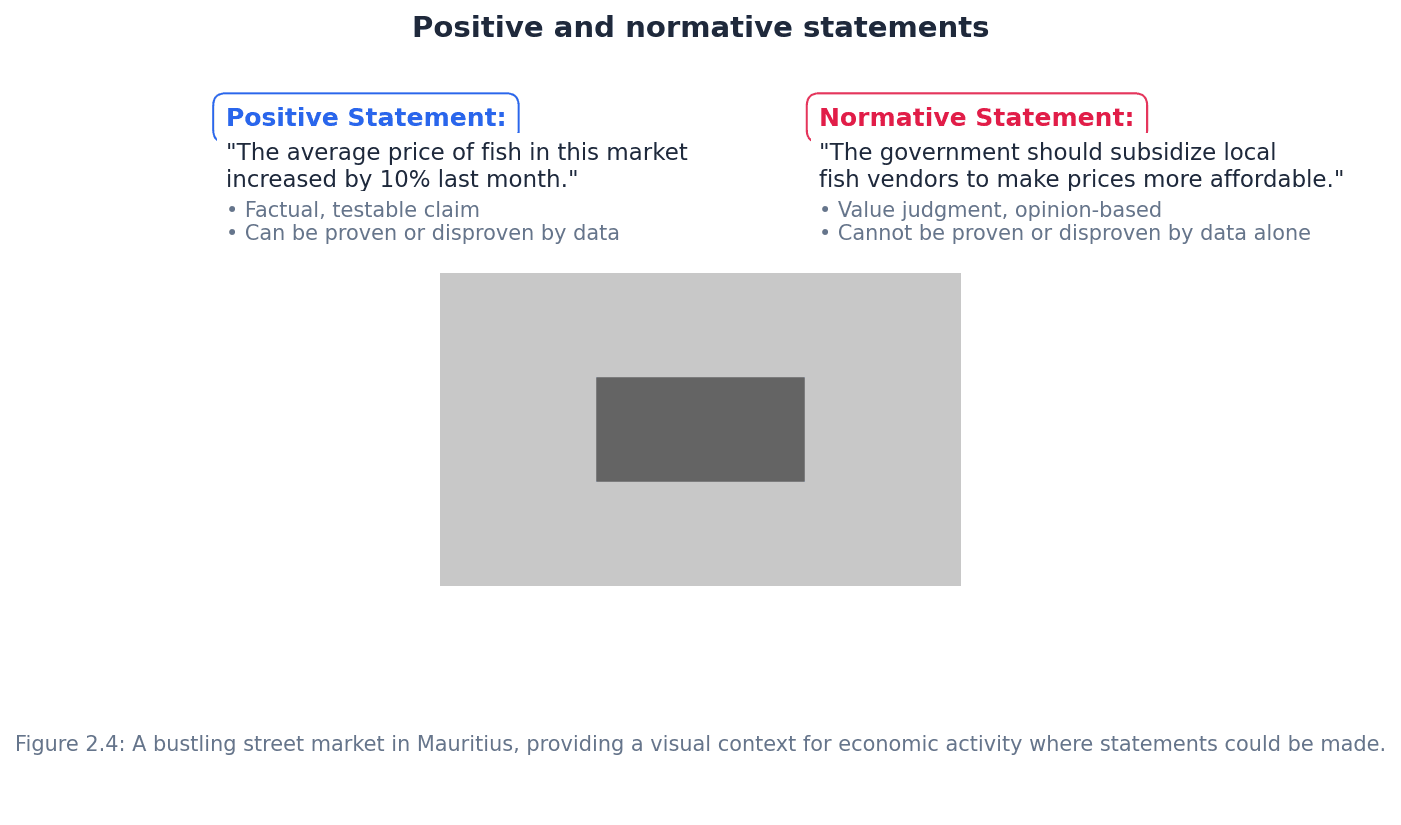
Positive statements — Statements that refer to what will happen, based on actual evidence or observation, without giving an opinion or making a value judgement.
These statements are objective and can be tested or verified against facts. They describe economic phenomena as they are or as they are predicted to be, allowing economists to analyze cause-and-effect relationships. For example, saying 'If you drop a ball, it will fall to the ground' is a positive statement in physics, as it describes an observable fact without personal opinion.
Students often think positive statements are always true, but actually they are statements that can be tested for truth or falsity using evidence, even if they turn out to be false.
When asked to identify or formulate a positive statement, ensure it is purely factual or testable, avoiding words like 'should', 'ought', 'best', or 'worst'.
Normative statements — Statements that express an opinion or make a value judgement within their analysis, and therefore can no longer be proven.
These statements are subjective and reflect personal beliefs or ethical positions. They often involve recommendations or evaluations of what 'should' be, rather than what 'is'. For instance, saying 'The government should increase taxes on sugary drinks to improve public health' is a normative statement, as it expresses an opinion about what ought to be done.
Students often think normative statements are simply 'wrong' or 'bad' statements, but actually they are statements that cannot be proven or disproven by facts alone because they contain a value judgement.
Look for keywords such as 'should', 'ought to', 'best', 'worst', 'good', 'bad', 'fair', or 'unfair' to identify normative statements in exam questions. When converting normative to positive, remove these subjective terms.
Ceteris paribus — A Latin term widely used by economists to refer to a situation where ‘other things remain equal’ or are unchanged.
This assumption allows economists to isolate the effect of a single variable on an outcome, simplifying complex situations for analysis. By holding all other factors constant, the impact of one specific change can be modeled and understood. Imagine testing how a car's speed changes with engine power; ceteris paribus means you assume road conditions, tire pressure, and wind resistance all stay the same, so you can focus only on the engine's effect.
Students often think ceteris paribus means all other factors are irrelevant, but actually it means those factors are temporarily assumed constant for analytical purposes, even though they might change in reality.
Always include 'ceteris paribus' in your explanations when discussing the effect of a single variable change (e.g., price on demand) to demonstrate a clear understanding of economic modeling assumptions. Failure to do so can lead to a loss of precision marks.
Economic analysis often distinguishes between different time periods because the flexibility of factors of production varies. This distinction helps economists understand how firms and markets adjust to changes over different horizons, from immediate responses to long-term strategic shifts.
Short run — A time period in which it is possible to change only some inputs, typically when labour can be increased or decreased to change what is produced.
In the short run, at least one factor of production (usually capital) is fixed, while others (like labour) are variable. This means firms can adjust output by changing variable inputs but cannot alter their scale of operations. For example, a bakery in the short run can hire more bakers (labour) to make more bread, but it cannot immediately build a new, larger oven (capital).
Students often think the short run is a specific calendar period (e.g., less than a year), but actually it is defined by the fixity of at least one factor of production, regardless of the actual time duration.
When discussing production decisions, clearly state which factors are variable and which are fixed in the short run. For example, 'In the short run, a firm can vary its labour input while its capital remains fixed.'
Long run — A time period in which it is possible for all factors of production or resources to change.
In the long run, all inputs, including capital, are variable. This allows firms to adjust their scale of operations, build new factories, or adopt new technologies to achieve their objectives more efficiently. In the long run, the bakery can decide to build a larger, more efficient oven or even open a new branch, as all its inputs can be changed.
Students often think the long run is simply 'a long time', but actually it is defined by the ability to vary all factors of production, which could be a few months for some industries or many years for others.
Emphasize that in the long run, firms have greater flexibility to adjust their production capacity and can achieve optimal efficiency by changing all inputs. Contrast this with the short run's fixed factors.
Very long run — A time period where not only are all factors of production variable but all other key inputs are variable, including technology, government regulations, and social concerns.
This period accounts for fundamental shifts in the economic environment that go beyond just changing traditional factors of production. It considers broader societal and technological changes that influence economic outcomes. In the very long run, the bakery might see the invention of fully automated bread-making robots (technology) or new health regulations that change consumer demand for certain ingredients (social concerns).
Students often confuse the very long run with just a longer version of the long run, but actually it specifically includes changes to external factors like technology and regulations, not just traditional inputs.
When discussing the very long run, highlight the impact of non-traditional inputs like technological advancements, institutional changes, and evolving social preferences, as these distinguish it from the long run.
In evaluation questions, use the positive/normative distinction. First, analyse the testable economic consequences (positive), then discuss the value judgements behind the policy or argument (normative).
Always distinguish between short-run and long-run effects in your analysis. A policy's impact can differ significantly when all factors of production are able to adjust.
Advantages & Disadvantages
Using Positive Statements in Economic Analysis
Using Normative Statements in Economic Policy Debates
Evaluation Starters
Essay Structure Guide
Introduction
Begin by defining key terms such as positive and normative statements, ceteris paribus, and the different time periods. Briefly state the importance of these concepts in economic methodology and outline the scope of your essay.
Conclusion
Summarise the main arguments, reiterating the importance of a robust economic methodology for understanding and addressing economic issues. Conclude by reflecting on the interplay between objective analysis (positive) and value judgements (normative) in shaping economic thought and policy.
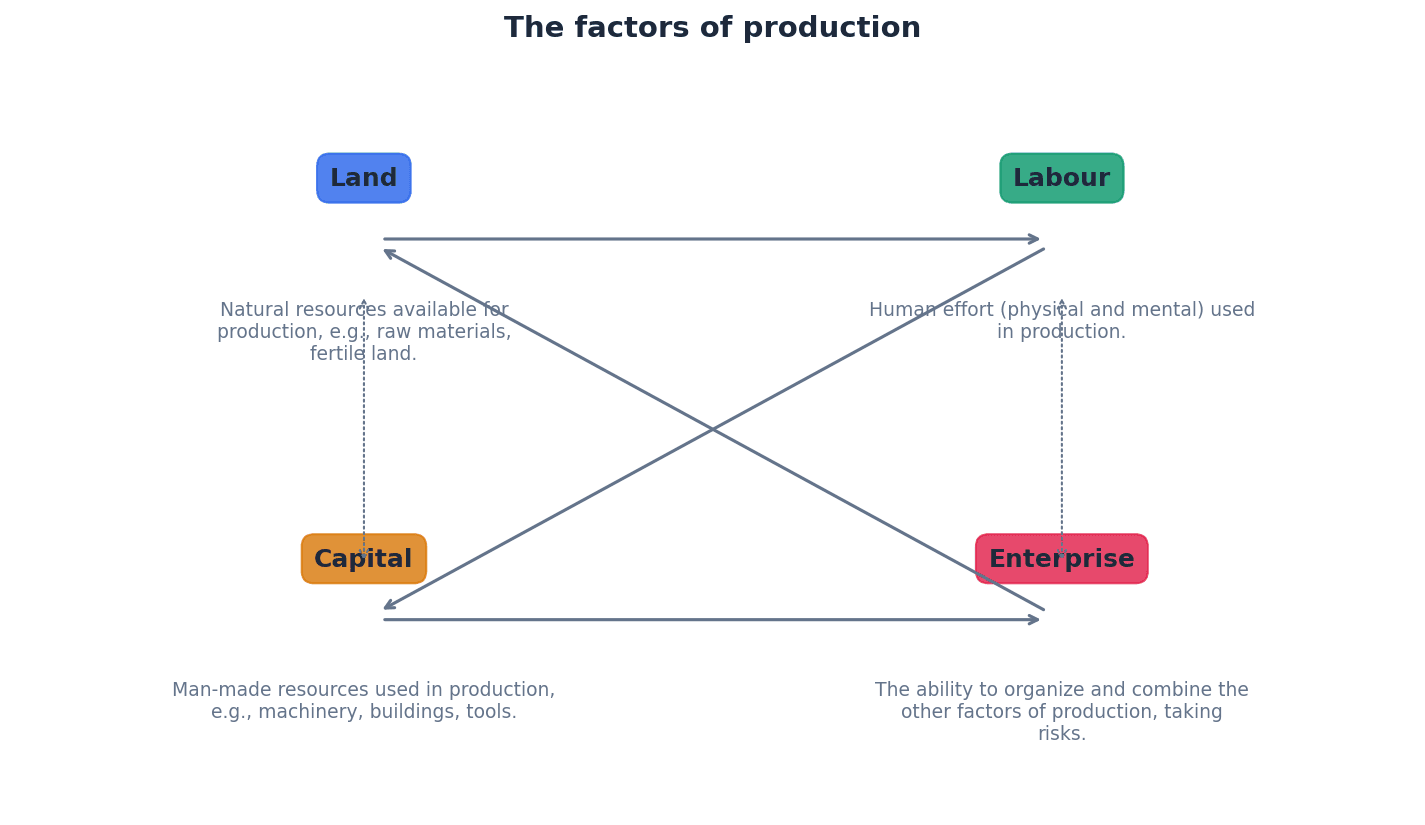
This chapter introduces the four fundamental factors of production: land, labour, capital, and enterprise, explaining their individual roles and rewards in an economy. It distinguishes between human and physical capital, and explores how specialisation and the division of labour enhance output, concluding with the critical function of the entrepreneur.
Factors of production — The means by which an economy produces a whole range of goods and services to meet the needs of its population.
These are the fundamental resources available in an economy, categorised into land, labour, capital, and enterprise. Owners of these factors receive payments when they are used by others, forming the basis of economic activity. Think of factors of production as the ingredients and tools a chef needs to make a meal: the kitchen (land), the chef's skills (labour), the oven and utensils (capital), and the chef's vision and risk-taking to create a new dish (enterprise).
Students often think factors of production are just physical items, but actually they include human resources and the intangible ability to organise and take risks.
When asked to 'define' factors of production, ensure you list all four and briefly explain what each entails, as this demonstrates comprehensive understanding.
Land — A natural resource that includes mineral deposits, rivers, lakes, climate, soil for agriculture, trees, and vegetation.
This factor encompasses all natural resources, both above and below the earth's surface, that are used in production. Its quality and quantity are crucial, especially in the context of climate change and resource availability. Imagine a farm: the soil, the water from the rain, the sunlight, and any minerals in the ground are all 'land'. It's not just the physical plot of ground, but all the natural elements it provides.
Students often think 'land' only refers to the physical space for buildings, but actually it's much broader, including all natural resources like oil, climate, and forests.
When providing examples of 'land', ensure you go beyond just physical space and include natural elements like climate, mineral deposits, and water sources to show a full understanding.
Labour — The human resources available in any economy.
This factor refers to the physical and mental effort contributed by people to the production of goods and services. Both the quantity (number of workers) and quality (skills, education) of labour are vital for economic progress. In a car factory, the engineers designing the car, the assembly line workers, and the sales staff are all 'labour'. Their collective effort and skills contribute to making and selling the cars.
Students often think 'labour' is just about the number of people working, but actually the quality of labour, including skills and education, is equally important for economic progress.
When discussing 'labour', remember to consider both its quantity (e.g., population size, working age) and its quality (e.g., education, training, skills) as both impact productivity and economic growth.
Capital — A type of physical resource including anything that can be regarded as made by humans to aid production.
This factor comprises man-made goods used to produce other goods and services, such as factories, machinery, and infrastructure. It is combined with land and labour to facilitate production and its quality is particularly important in developing economies. For a baker, 'capital' would be the oven, the mixing machines, the delivery van, and the bakery building itself. These are all man-made tools that help the baker produce bread.
Students often think 'capital' means money, but actually in economics, it refers to physical assets like machinery and factories used in production, not financial capital.
Distinguish clearly between 'physical capital' (factories, machinery) and 'financial capital' (money) in your answers. The economic definition of capital refers to the former.
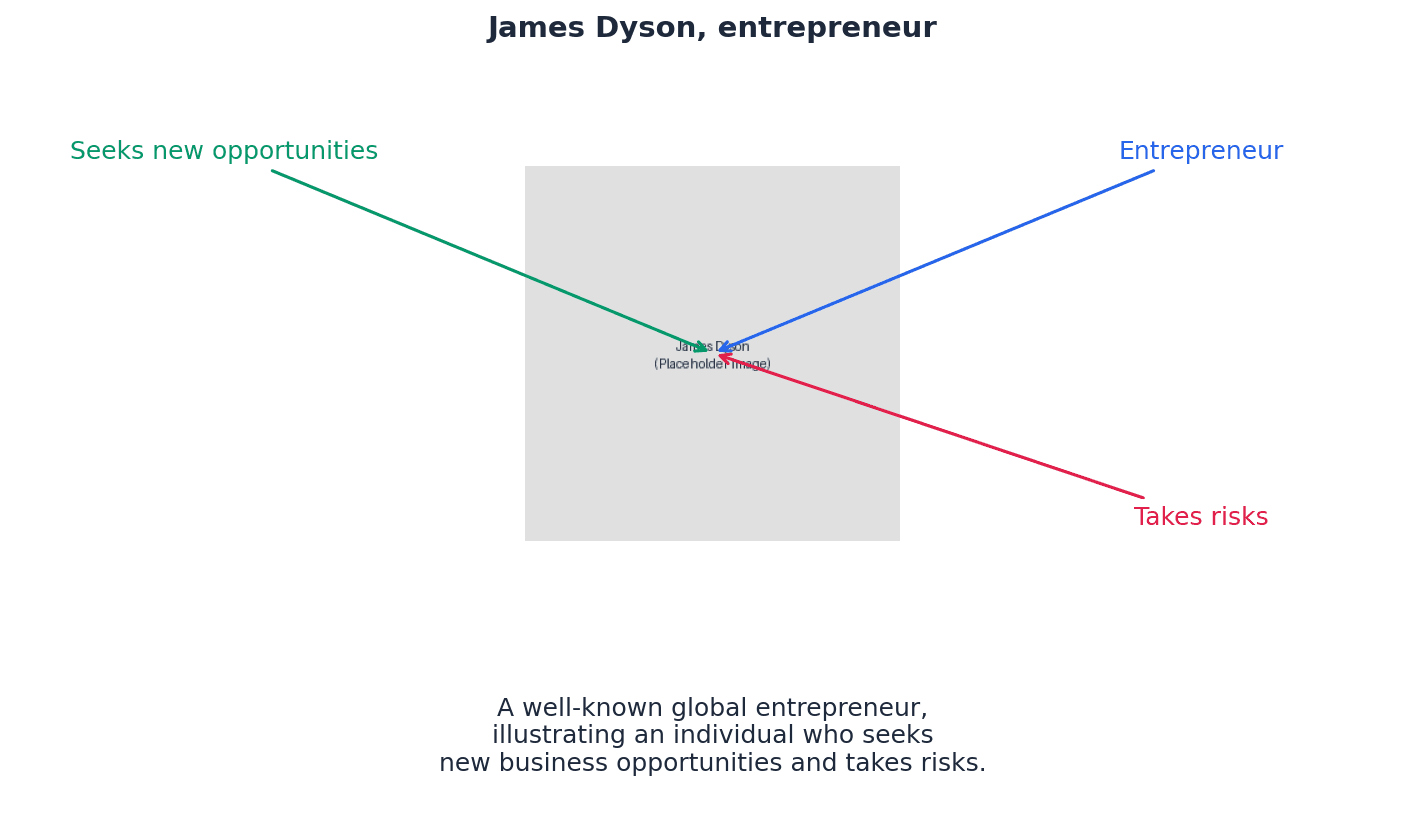
Enterprise — A form of human capital that organises other factors of production and refers to the ability and inventiveness of entrepreneurs who are prepared to take risks.
This factor is crucial for initiating and managing production, involving the entrepreneur's role in combining land, labour, and capital, and bearing the risks associated with business ventures. The reward for enterprise is profit. Think of a film director: they bring together the actors (labour), the set locations (land), the cameras and equipment (capital), and take the financial risk to create a movie. That's enterprise in action.
Students often think 'enterprise' is just about starting a business, but actually it specifically involves the organisation of other factors of production and the willingness to take risks.
When explaining the role of an entrepreneur, emphasise both their organisational function (combining factors) and their risk-taking ability, as both are key aspects of enterprise.
Human capital — The value of labour in contributing to the productive potential or future growth in an economy, covering the skills, knowledge and experience of labour.
This concept highlights the importance of investing in people's education, training, and health to enhance their productivity and future earnings. It applies to individuals and the population as a whole, driving economic growth. If a carpenter goes to a special course to learn how to build custom furniture, the new skills and knowledge they gain are 'human capital'. This investment makes them more valuable and productive.
Students often confuse 'human capital' with just 'labour', but actually human capital specifically refers to the *quality* of labour – the skills, knowledge, and experience that add value.
When comparing human capital and physical capital, focus on how human capital represents an investment in people's abilities, leading to future productivity gains, rather than just the physical presence of workers.
Physical capital — The result of more resources being made by businesses and government in the wide range of items such as factories, machinery and infrastructure.
This is the tangible capital used in production, distinct from human capital. Its quality and quantity are often considered a primary source of economic growth, especially in developing countries, by improving productive capacity. The machines in a factory, the roads for transport, and the office buildings are all 'physical capital'. They are tangible assets created by humans to help produce other goods and services.
Ensure you clearly differentiate physical capital (tangible assets) from human capital (skills and knowledge) and financial capital (money) in your explanations, as they are distinct economic concepts.
Human capital represents the value derived from the skills, knowledge, and experience of the labour force, which contributes to an economy's productive potential and future growth. In contrast, physical capital refers to the tangible, man-made resources like factories, machinery, and infrastructure that are used to aid production. While both are crucial for economic growth, human capital focuses on investment in people's abilities, whereas physical capital involves investment in physical assets to enhance productive capacity.
Specialisation — A situation where individuals and firms, regions and entire economies concentrate on producing some goods and services rather than others.
This process allows entities to focus on what they are best at, leading to increased efficiency and higher output. While it boosts production, it also necessitates exchange or trade as no one becomes self-sufficient. A baker specialises in making bread, while a farmer specialises in growing wheat. Both produce a surplus of their specialty, which they then trade with each other to meet all their needs.
Students often think specialisation means doing everything perfectly, but actually it means focusing on a specific task or product where one has a comparative advantage, even if not absolutely the best at everything.
When explaining specialisation, discuss both its benefits (increased output, efficiency) and its potential drawbacks (redundancy of skills, reliance on trade, vulnerability to market changes).
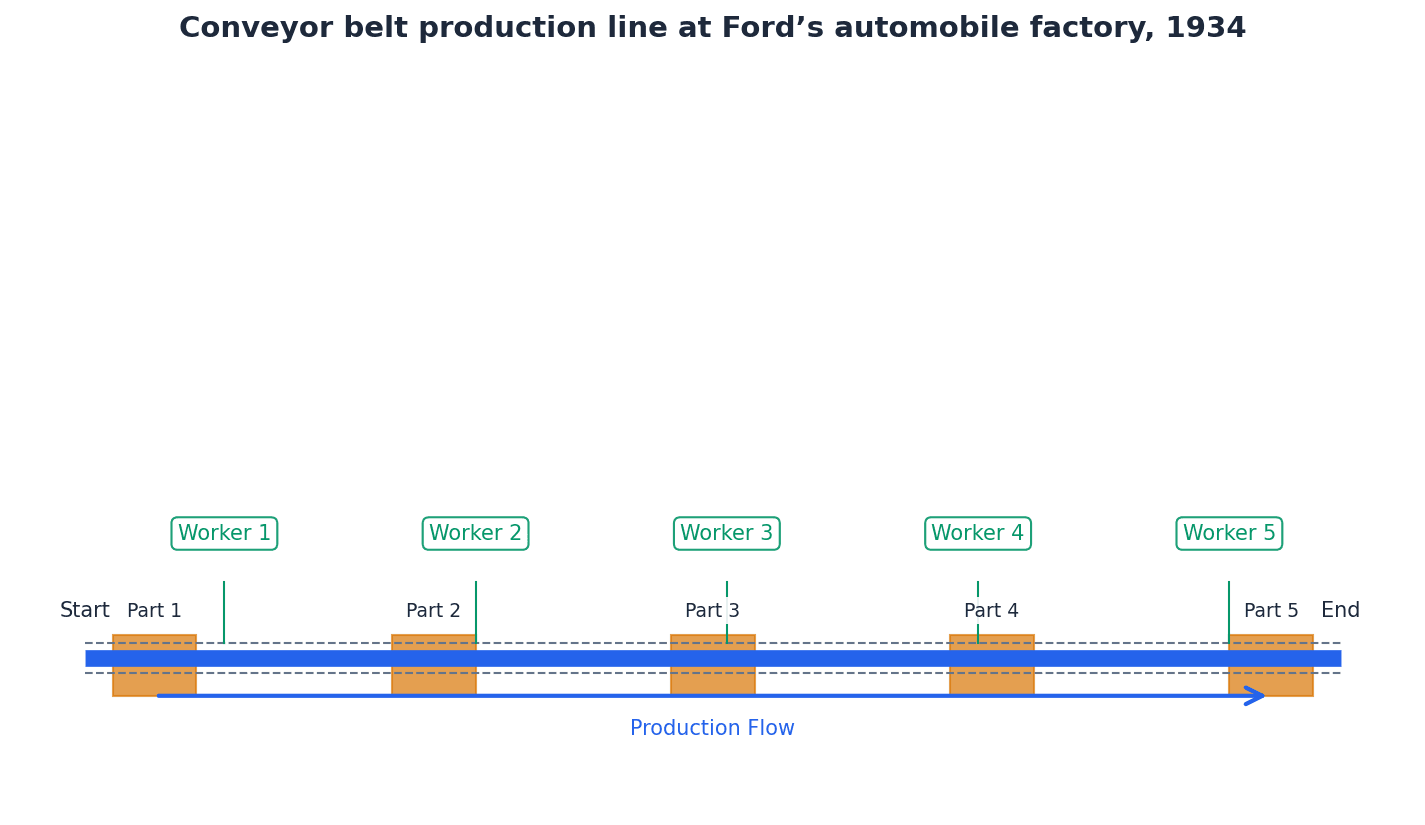
Division of labour — The process of production being broken down into a series of tasks, with each employee carrying out only one or a few of these operations.
This is a specific application of specialisation within a production unit, where workers focus on a single task. It typically leads to increased output per worker, improved quality, and reduced costs, but can also cause worker dissatisfaction. In a car assembly line, one worker might only install the wheels, another might only fit the doors, and another might only paint the car. Each specialises in a small part of the overall process.
Students often confuse 'division of labour' with 'specialisation' generally, but actually division of labour is a specific form of specialisation applied within a production process, breaking it into distinct tasks.
When asked about the division of labour, remember to mention Adam Smith's pin factory example as a classic illustration and discuss both the benefits (efficiency, output) and drawbacks (boredom, de-skilling) for workers.
Specialisation occurs when individuals, firms, or economies concentrate on producing specific goods or services. The division of labour is a particular form of specialisation where the production process is broken down into distinct tasks, with each worker focusing on one or a few operations. Both methods aim to increase output and efficiency, leading to higher productivity and potentially lower costs per unit. For example, a conveyor belt production line, such as those historically used at Ford's automobile factory, exemplifies the division of labour.
The entrepreneur plays a crucial role in 21st-century economies by organising the other factors of production: land, labour, and capital. They are responsible for combining these resources effectively to produce goods and services. Beyond organisation, entrepreneurs are also risk-takers, willing to bear the uncertainties associated with business ventures in pursuit of profit. Figures like James Dyson exemplify the entrepreneurial spirit, innovating and taking risks to bring new products to market.

When defining the four factors of production, also state their rewards: Rent (Land), Wages (Labour), Interest (Capital), and Profit (Enterprise).
For questions on specialisation, always provide a balanced answer by discussing both the benefits (e.g., higher output) and the drawbacks (e.g., worker boredom, over-reliance).
Clearly distinguish between an increase in 'physical capital' (more machines) and 'human capital' (a more skilled workforce) when explaining economic growth.
Advantages & Disadvantages
Specialisation
Division of Labour
Evaluation Starters
Essay Structure Guide
Introduction
Begin by defining the factors of production and briefly outlining their importance in an economy. State the main arguments you will present regarding their roles and interconnections.
Conclusion
Summarise the key roles of the factors of production and their interdependencies. Reiterate the importance of effective organisation and investment in these factors for sustained economic growth and development. Offer a final evaluative thought on the dynamic nature of these factors in a changing global economy.
This chapter explores how different economic systems address the fundamental problem of scarcity and allocate resources. It details the characteristics, advantages, and disadvantages of market, planned, and mixed economies, emphasizing the role of the price mechanism and central planning.
market economy — An economic system where resource allocation decisions are largely driven by the market mechanism, with individuals and firms making decisions without government intervention.
In a market economy, the forces of demand and supply, operating through the price mechanism, determine what, how, and for whom goods and services are produced. The government's role is minimal, primarily intervening only in cases of market failure. Imagine a giant farmers' market where every farmer decides what to grow based on what customers want and what prices they can get, and customers decide what to buy based on their needs and the prices offered, with no central authority.
Students often think a market economy means no government at all. However, governments in market economies still provide some public services and regulate to prevent market failures.
When asked to 'explain' the workings of a market economy, ensure you detail the role of the price mechanism and the limited government intervention, using terms like 'demand', 'supply', and 'self-interest'.
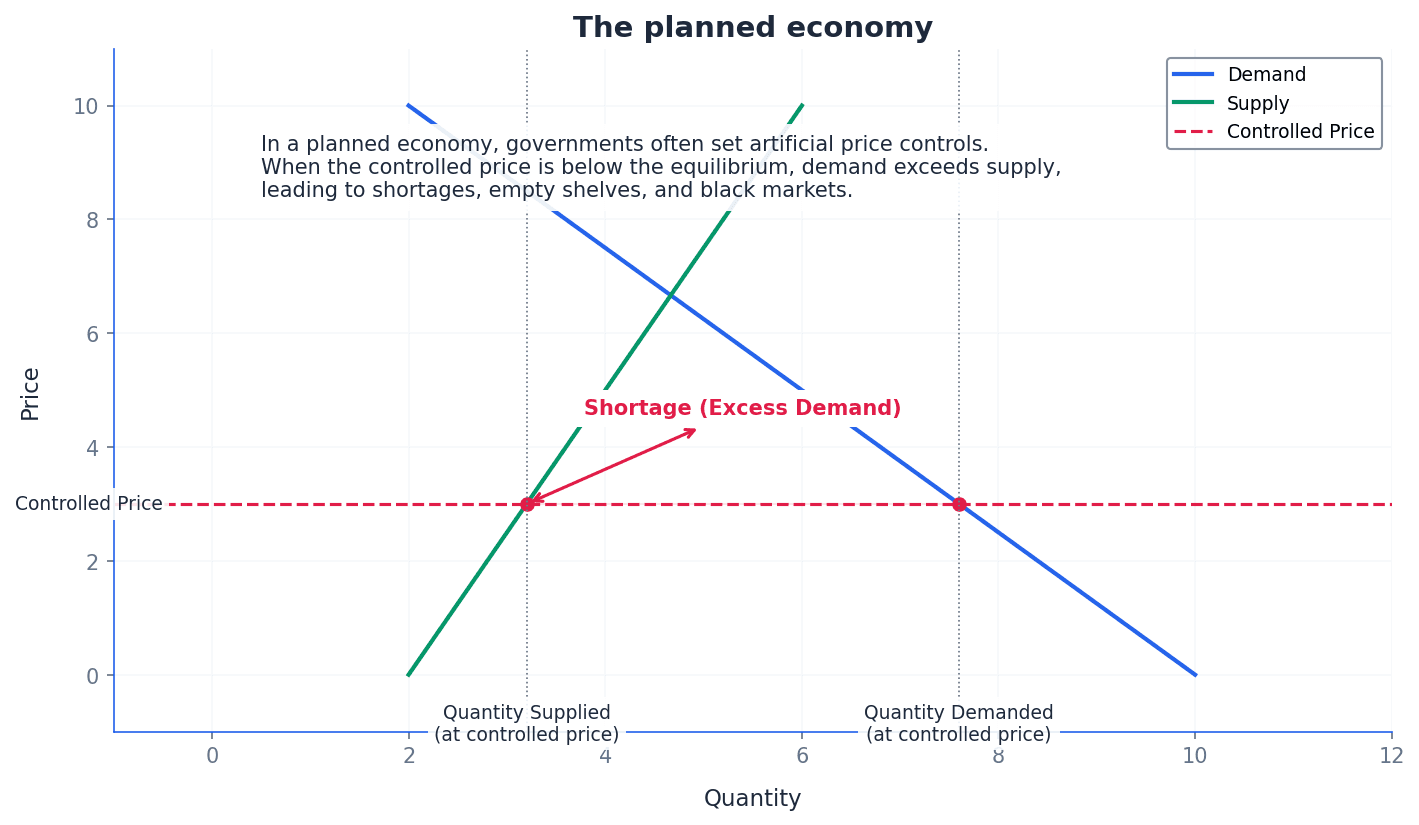
planned economy — An economic system where the government has a central role in all decisions regarding resource allocation, controlling what, how, and for whom goods and services are produced.
In a planned economy, central planning boards set production targets, control prices and wages, and own most productive resources. Consumer preferences and market forces have little to no role in resource allocation. Think of a single, massive company that owns all the factories, farms, and shops in a country, and its CEO (the government) decides exactly what everyone will produce, how much it will cost, and who gets it.
Students often think planned economies are purely theoretical. However, countries like Cuba and North Korea operate very close to the theoretical model, albeit with some minor private activity.
When discussing planned economies, remember to include present-day examples like Cuba or North Korea to demonstrate understanding, and highlight consequences such as shortages due to price controls.
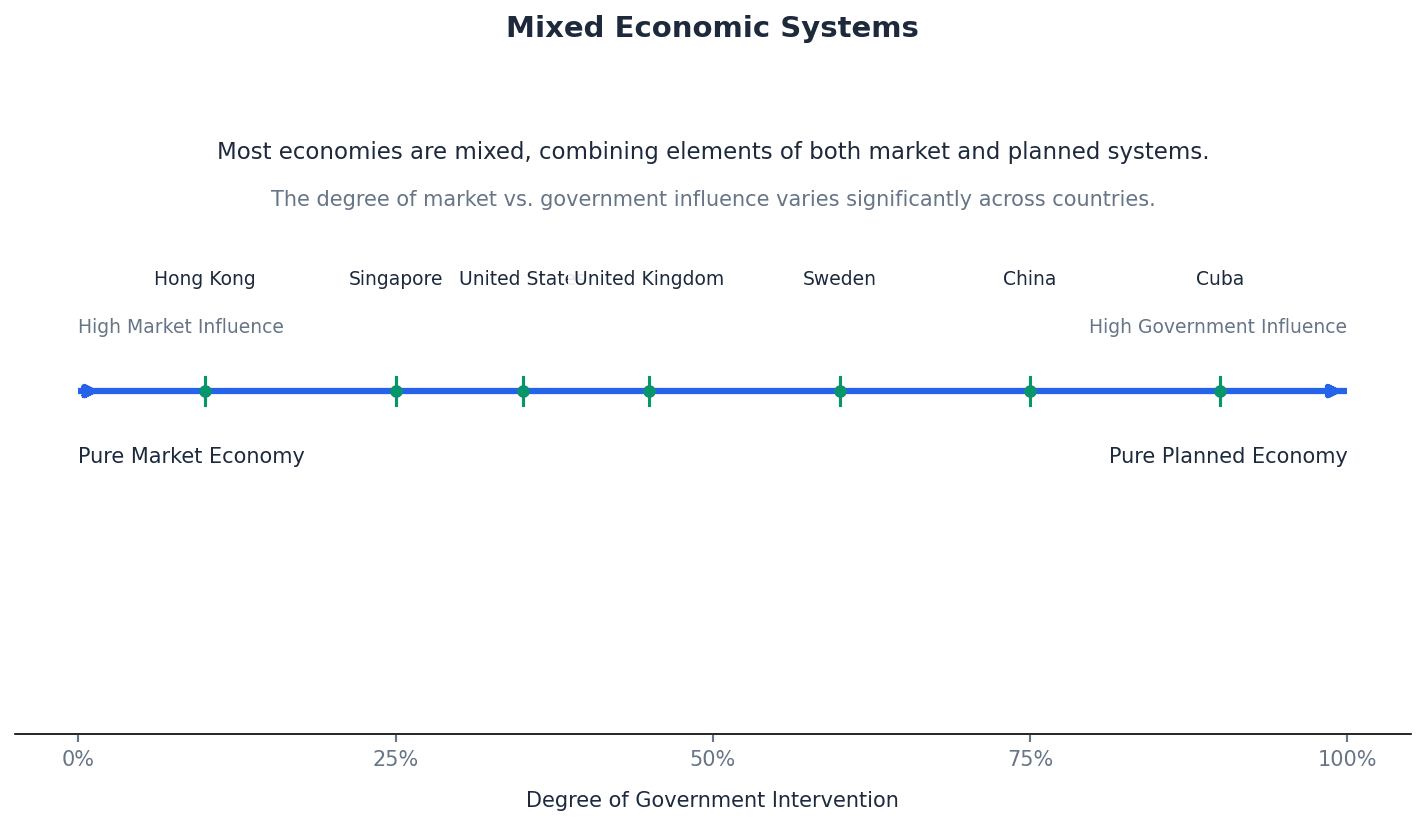
mixed economy — An economic system where both the private sector and public sector play a part in the allocation of resources, involving an interaction between firms, labour, and the government.
Mixed economies combine elements of both market and planned systems, with private ownership of most productive resources alongside some public ownership. Decisions are influenced by both market mechanisms and government intervention. Consider a football game where the players (private sector) largely decide their moves on the field, but there's also a referee (government) who enforces rules, calls fouls, and sometimes makes decisions that affect the flow of the game.
Students often think the classification of economies is exact. However, most economies are some form of mixed system, varying in the relative importance of the market mechanism and government.
When analysing a mixed economy, ensure you discuss the balance between market forces and government intervention, and consider the impact of policies like privatisation on resource allocation.
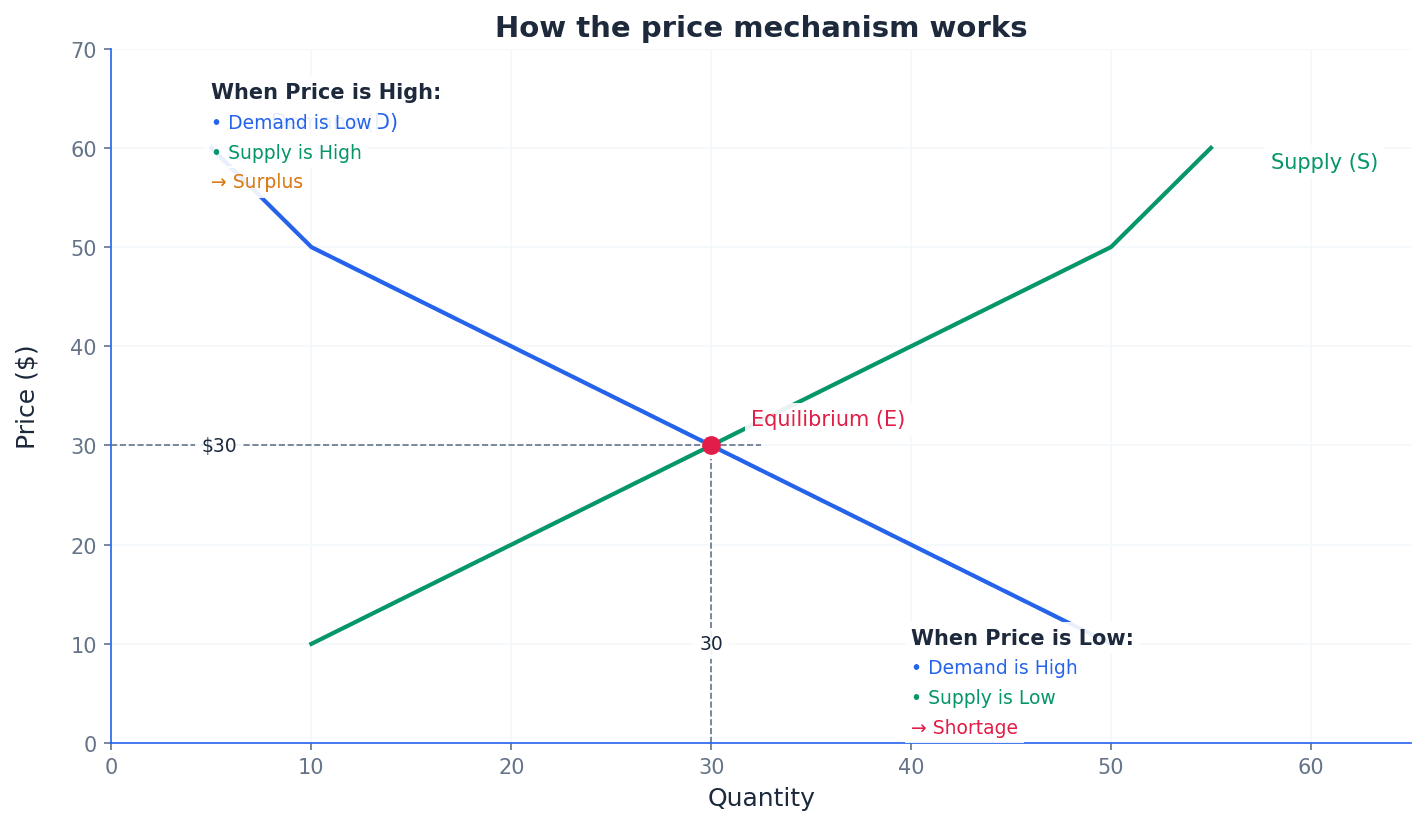
price mechanism — The process by which the forces of demand and supply interact to determine prices and allocate resources in a market economy.
The price mechanism works through changes in prices signaling to producers and consumers where resources are most needed. Excess supply leads to falling prices, discouraging production, while excess demand leads to rising prices, encouraging production. Imagine prices as traffic lights in an economy: a high price is a green light for producers to make more, and a red light for consumers to buy less; a low price is the opposite, guiding resources to where they are most valued.
Students often think the price mechanism only works when prices rise. However, it also functions when prices fall, signaling to firms to reduce supply or exit the market.
When explaining the price mechanism, use a diagram to illustrate how excess supply or demand leads to price adjustments and a movement towards equilibrium, clearly labeling axes and curves.
excess supply — A situation where the quantity supplied of a good or service exceeds the quantity demanded at a given price.
Excess supply results in goods being stockpiled, prompting firms to reduce prices to encourage purchases and clear stocks. This adjustment is a key part of how the price mechanism works to restore equilibrium. Imagine a baker making 100 loaves of bread but only 50 customers want to buy them at the current price; the remaining 50 loaves are excess supply.
market failure — A situation where the price mechanism does not provide the best allocation of resources.
Market failure occurs when the free market fails to allocate resources efficiently, leading to an underprovision of certain goods (like healthcare), non-provision of others (like fire services), or firms exploiting market power for excessive gain. Imagine a broken compass that points in the wrong direction; similarly, market failure means the price mechanism (the 'compass' of the economy) is not guiding resources to their optimal use.
Students often think market failure means the market completely stops working. However, it means the market is working inefficiently, leading to suboptimal outcomes for society.
When identifying market failures, provide specific examples such as public goods (non-excludable, non-rivalrous) or externalities, and explain why the market alone cannot provide them efficiently.
privatisation — The transfer of resources from public ownership to the private sector.
Privatisation is a trend seen in many economies, including former planned economies, as they move towards a mixed economic system. It involves selling state-owned enterprises or assets to private individuals or companies. It's like a public library (government-owned) being sold to a private company that then runs it as a for-profit bookstore.
When discussing privatisation, consider both the potential benefits (e.g., efficiency, innovation) and drawbacks (e.g., higher prices, job losses) and link them to resource allocation.
All economic systems must address the fundamental problem of scarcity by answering three core resource allocation questions: What to produce? How to produce it? For whom to produce it? Different economic systems—market, planned, and mixed—provide distinct frameworks for making these decisions.
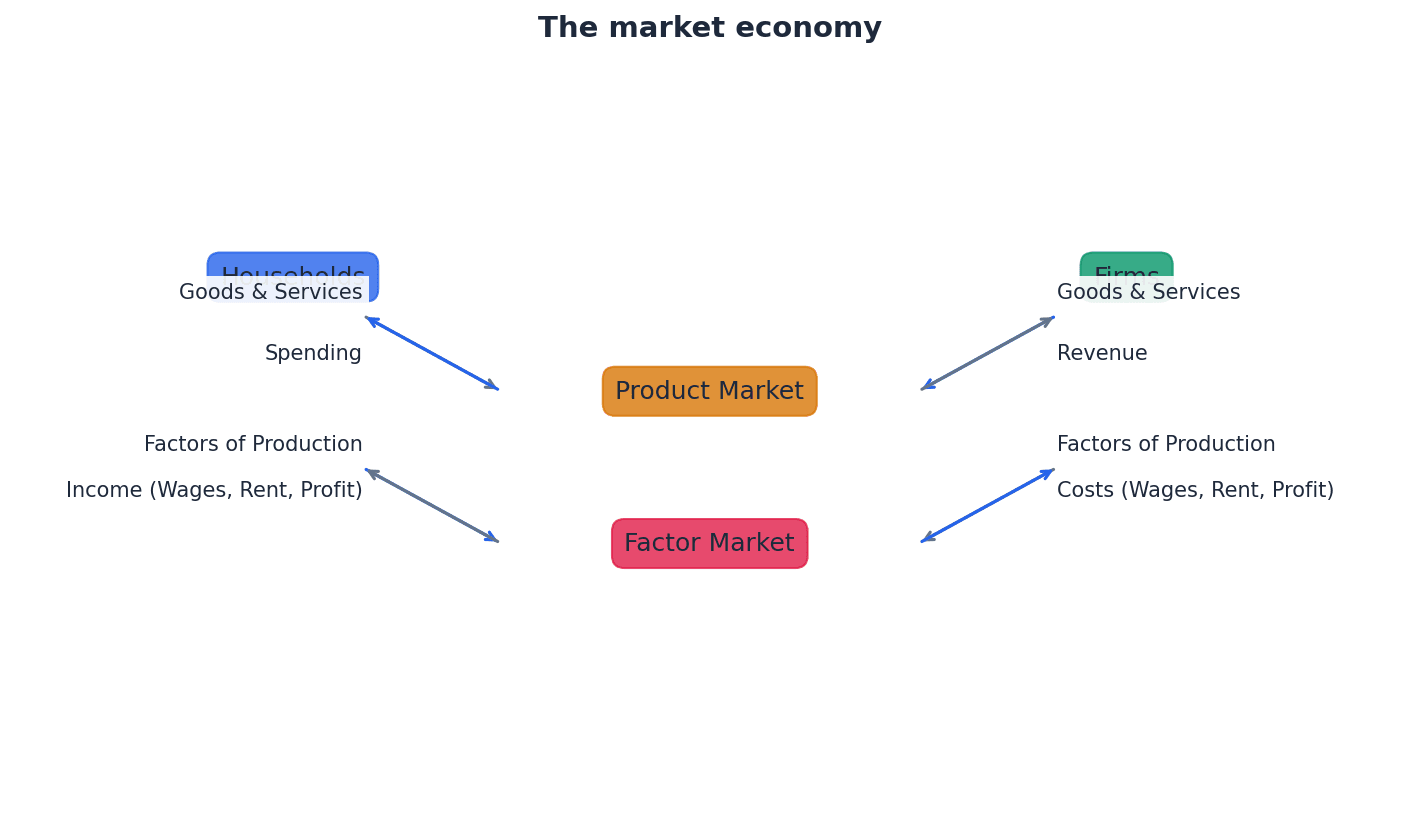
In a market economy, the price mechanism is central to resource allocation. It acts as a signaling system, where changes in prices communicate information to both producers and consumers. For instance, rising prices signal to producers that a good is in high demand, encouraging them to increase supply, while falling prices signal excess supply, prompting firms to reduce output or exit the market.
While market economies are characterized by minimal government intervention, the government still plays a crucial role. Its primary functions include providing public services, regulating markets to ensure fair competition, and intervening to correct market failures, which occur when the price mechanism fails to allocate resources efficiently.
Most real-world economies are mixed, combining elements of both market and planned systems. This means that both the private sector, driven by market forces, and the public sector, influenced by government intervention, play a part in resource allocation. The balance between these two sectors varies significantly across different countries, with some leaning more towards market mechanisms (like New Zealand) and others retaining more government control.
When comparing economic systems, structure your answer around their different approaches to the 'What, How, and For Whom' questions.
In evaluation questions, always present a balanced view. For example, discuss the advantages of the price mechanism (e.g., efficiency) alongside its disadvantages (e.g., market failure).
Advantages & Disadvantages
Market Economy
Planned Economy
Evaluation Starters
Essay Structure Guide
Introduction
Begin by defining the core problem of scarcity and the three fundamental economic questions. Then, briefly introduce the three main economic systems (market, planned, mixed) and state the essay's purpose, e.g., to compare their resource allocation mechanisms and evaluate their advantages and disadvantages.
Conclusion
Summarise the main arguments, reiterating that all systems face trade-offs in addressing scarcity. Conclude by stating that most real-world economies are mixed, reflecting an ongoing attempt to find an optimal balance between market forces and government intervention, and that the 'best' system is often context-dependent.
This chapter introduces the Production Possibility Curve (PPC) as a fundamental economic model illustrating scarcity, choice, and opportunity cost. It explores how the PPC's shape reflects different opportunity costs and how shifts in the curve represent changes in an economy's productive capacity due to resource or technological changes.
production possibility curve — A simple economic model that shows the choices available and how resources are allocated, representing the maximum level of output of each of two goods that can be produced.
Also known as the production possibility frontier, it draws a boundary between what can be produced and what cannot. Any point on the curve signifies efficient resource allocation, while points inside indicate inefficiency and points outside are unattainable with current resources. Imagine a baker who can make either cakes or cookies with a fixed amount of flour, sugar, and time. The PPC shows all the combinations of cakes and cookies they can make if they use all their ingredients and time efficiently.
scarcity — A situation where the economy does not have the resources required to achieve a desired level of output of goods.
Scarcity is a fundamental economic problem that necessitates choices about resource allocation. On a PPC diagram, scarcity is represented by any point outside the curve, indicating an unattainable production level. If you only have £10, you face scarcity because you can't buy everything you want; you have to choose what to buy within your budget.
Students often think scarcity means there's 'not enough' of something, but actually it means there are insufficient resources to satisfy all wants, even if some quantity exists.
opportunity cost — The benefit given up from the production of one good when resources are reallocated to produce more of another good.
It is the value of the next best alternative forgone. On a PPC, moving from one point to another demonstrates opportunity cost, as producing more of one good requires giving up some production of the other. This cost can be constant (straight-line PPC) or increasing (curved PPC). If you choose to spend your Saturday studying for an exam, the opportunity cost is the fun you could have had going to a party with friends.
Students often think opportunity cost is just the monetary price, but actually it's the value of the next best alternative forgone, which might not have a direct monetary cost.
trade-off — The process of deciding whether to give up some of one good in order to obtain more of another.
A trade-off is inherent in situations of scarcity where resources are fully utilised. On a PPC, any movement along the curve represents a trade-off, as increasing the production of one good necessitates decreasing the production of another. The numerical extent of a trade-off can be quantified by comparing the changes in production levels. Choosing to spend more time on your part-time job means you have to trade off some study time, or vice versa.
Students often confuse trade-off with opportunity cost, but actually a trade-off is the act of making a choice between alternatives, while opportunity cost is the value of the specific alternative that was forgone.
productive capacity — The total ability of an economy to produce goods and services.
This is represented by the position of the production possibility curve. An outward shift of the PPC indicates an increase in productive capacity, while an inward shift indicates a decrease. Changes in resource availability or technology are the main drivers of shifts in productive capacity. Think of a factory's maximum output. If the factory gets new, more efficient machines or hires more skilled workers, its productive capacity increases, allowing it to make more products.
Students often think productive capacity only refers to current output, but actually it refers to the maximum potential output an economy can achieve if all resources are fully and efficiently utilized.
The production possibility curve (PPC) serves as a simple economic model to illustrate fundamental economic concepts such as scarcity, choice, and opportunity cost within an economy. It delineates the maximum level of output of two goods that can be produced given an economy's available resources and technology. The PPC acts as a boundary, separating what is achievable from what is not, thereby highlighting the trade-offs inherent in resource allocation.
When asked to 'explain the meaning and purpose' of a PPC, ensure you define it as a boundary of maximum output and state its use in illustrating scarcity, choice, and opportunity cost. Label axes clearly with two goods.
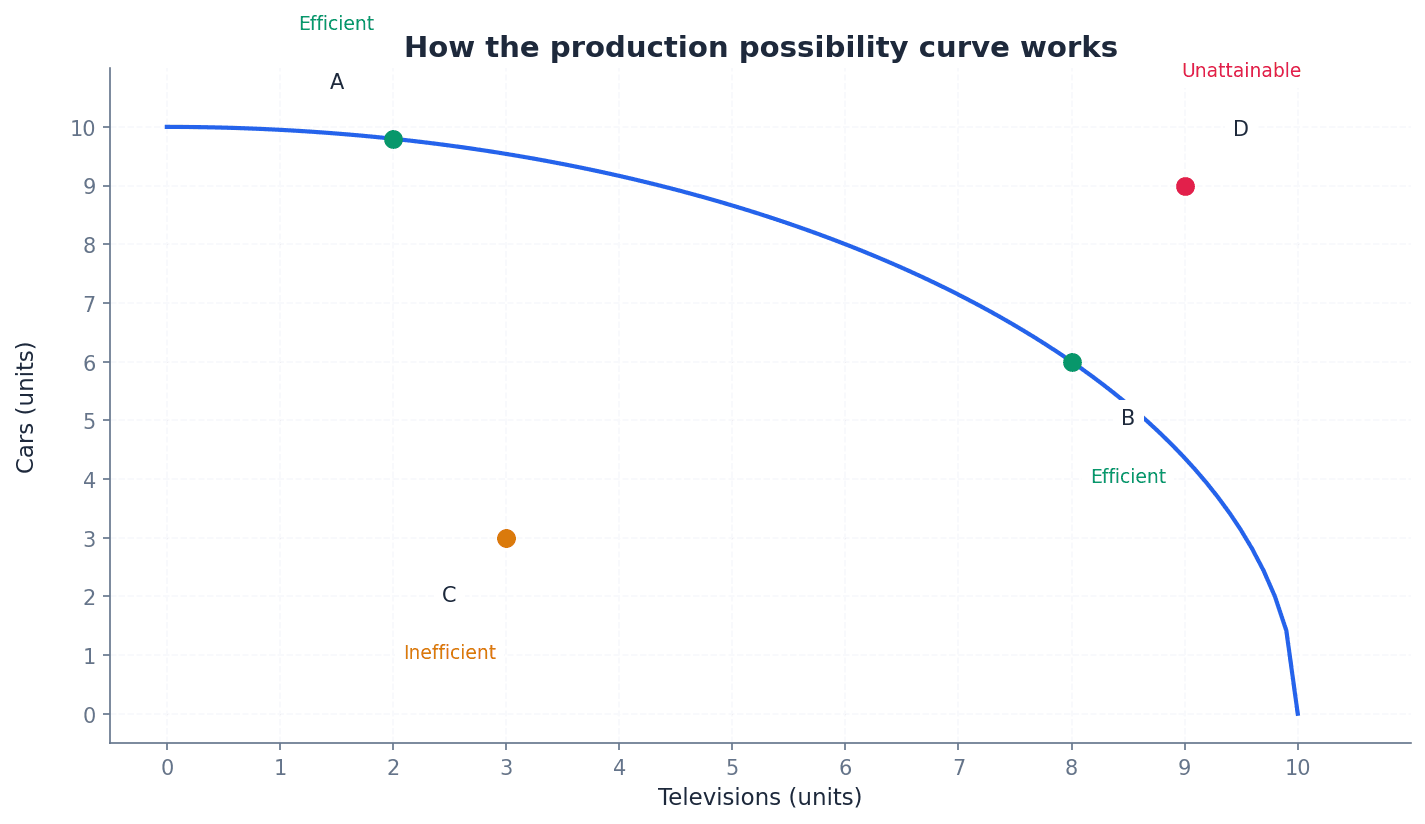
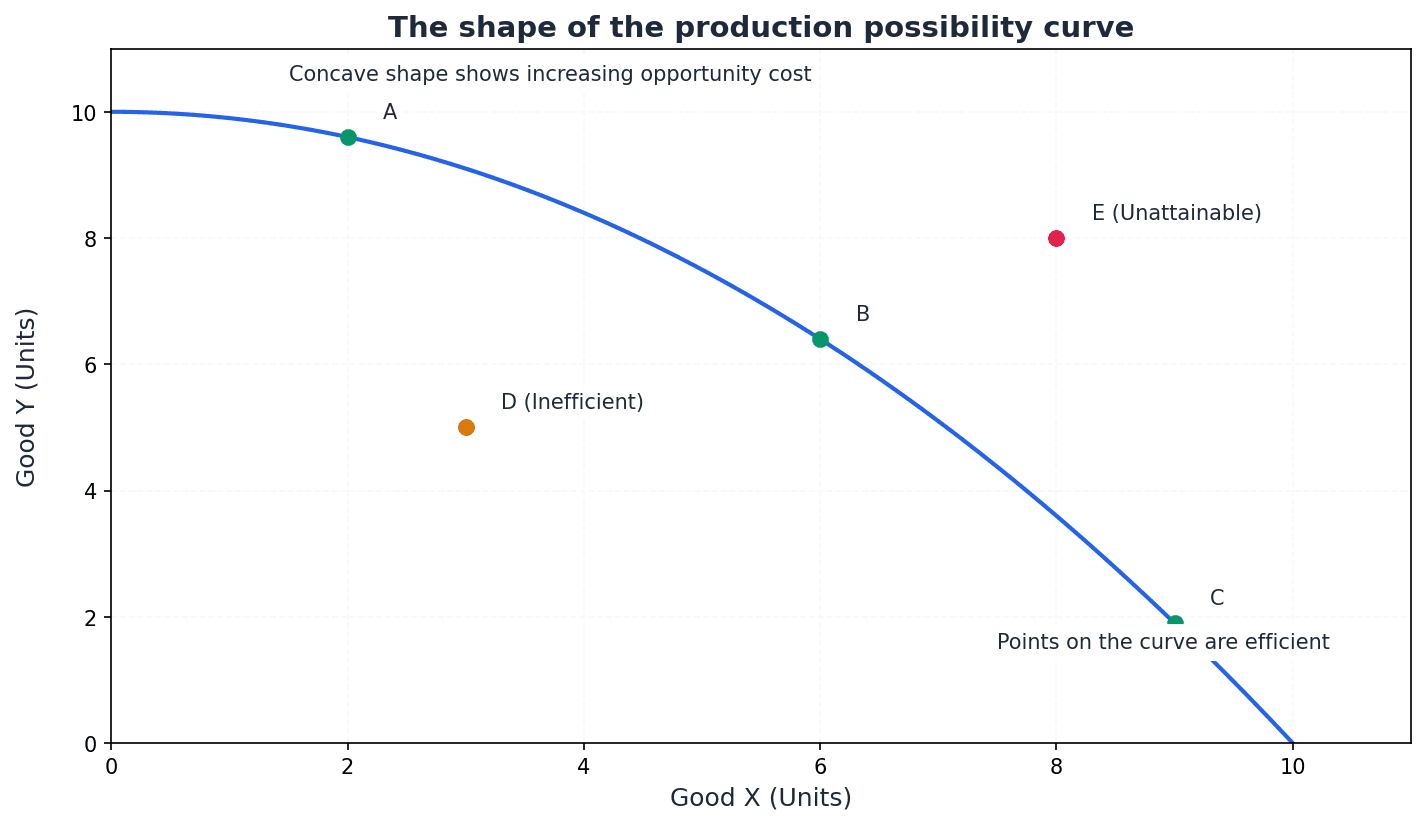
Points located directly on the production possibility curve represent productively efficient outcomes, meaning all available resources are fully and efficiently utilised. Conversely, any point inside the PPC signifies inefficiency, indicating that resources are either unemployed or underemployed. Points lying outside the PPC are currently unattainable, demonstrating the concept of scarcity due to insufficient resources or technology.
Use precise terminology: 'productively efficient' for points on the curve, 'inefficient' or 'unemployed resources' for points inside, and 'unattainable' for points outside.
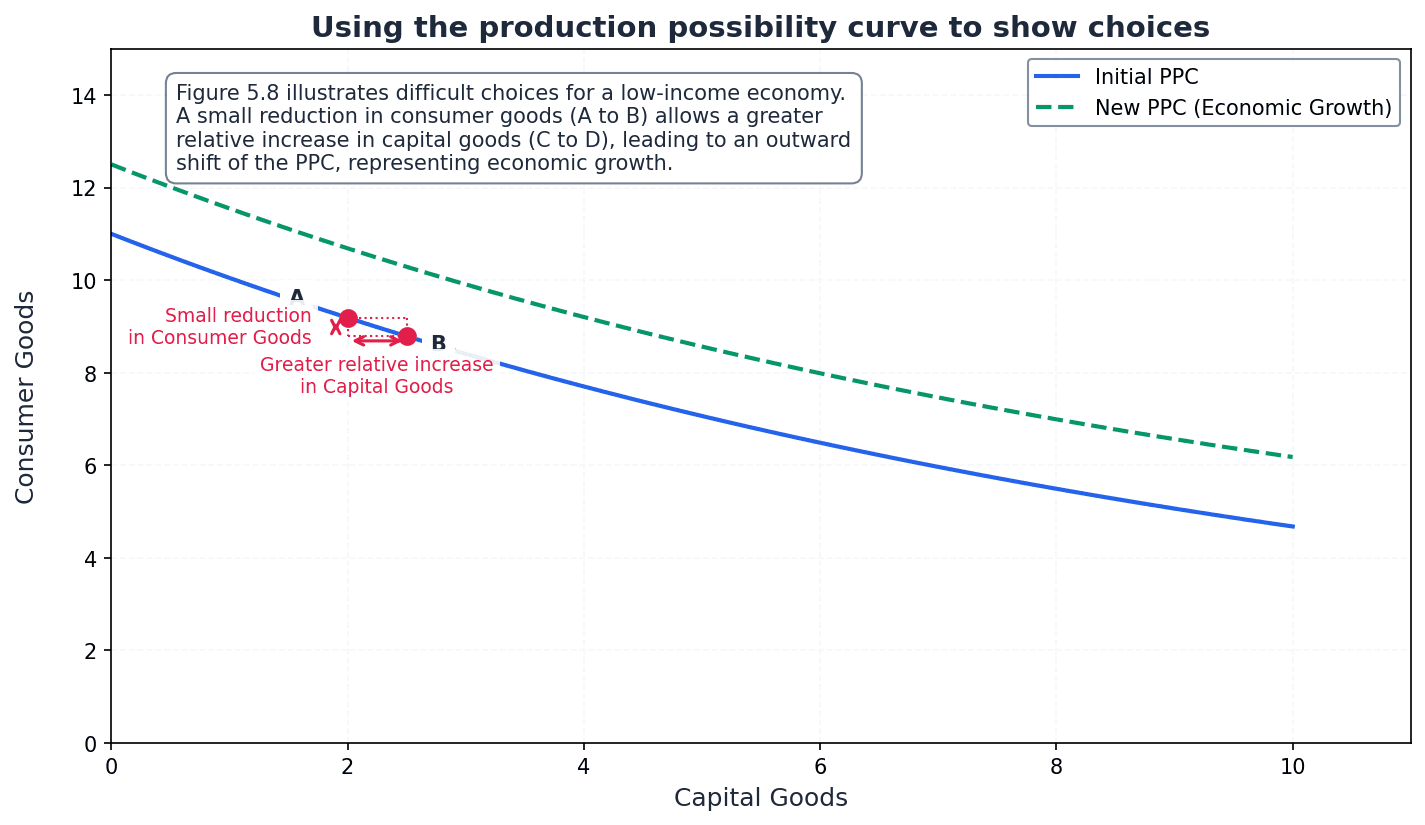
A movement along the PPC demonstrates a trade-off, where increasing the production of one good necessitates decreasing the production of another. This trade-off directly illustrates opportunity cost, which is the value of the next best alternative forgone. For example, to produce more capital goods, an economy must give up some consumer goods, and the amount of consumer goods sacrificed is the opportunity cost.
When calculating or explaining opportunity cost, clearly state what is being 'given up' in terms of the other good. For a curved PPC, explain why opportunity cost increases as more of one good is produced (e.g., resources are not equally suited).
The shape of the PPC reflects the nature of opportunity costs. A straight-line PPC indicates a constant opportunity cost, meaning that resources are perfectly adaptable between the production of the two goods. More commonly, the PPC is bowed outwards (concave to the origin), signifying increasing opportunity costs. This occurs because resources are not equally suited to producing both goods, so as more of one good is produced, increasingly less suitable resources must be reallocated, leading to larger sacrifices of the other good.
Changes in an economy's productive capacity lead to shifts in the PPC. An outward shift of the curve indicates economic growth, meaning the economy can now produce more of both goods. This is typically caused by an increase in the quantity or quality of resources (e.g., more labour, better education) or advancements in technology. Conversely, an inward shift of the PPC signifies a decrease in productive capacity, perhaps due to events like natural disasters or war.
When explaining shifts in the PPC, explicitly link the shift to a change in the economy's 'productive capacity' and identify whether it's an increase (outward shift) or decrease (inward shift), citing reasons like resource changes or technological advancements.
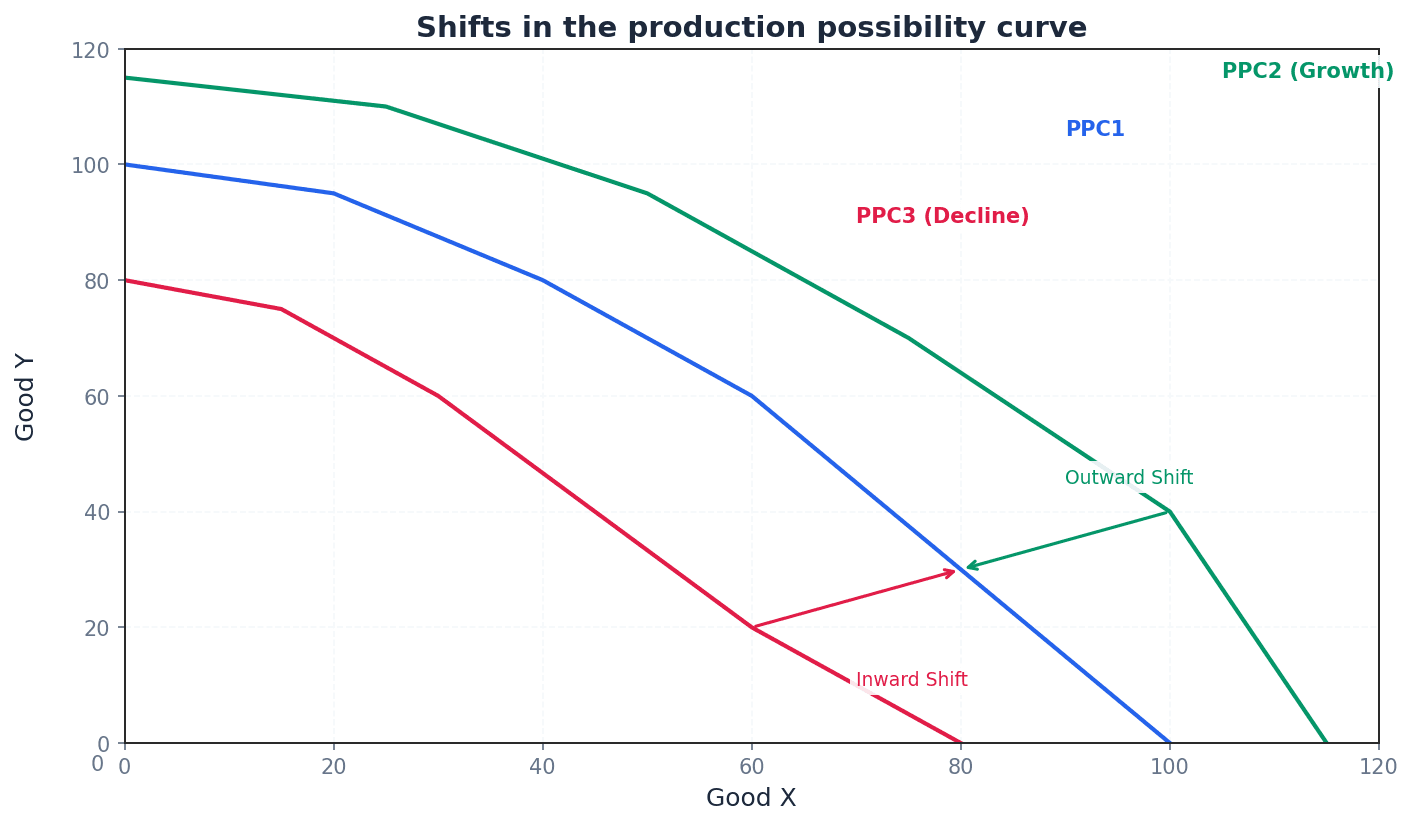
Students often confuse a movement along the curve (reallocating resources) with a shift of the curve (changing productive capacity).
Students often think the PPC shows what an economy 'should' produce, but actually it only shows what 'can' be produced given resources and technology, highlighting choices and trade-offs.
Always fully label your PPC diagrams: title, both axes (e.g., 'Capital Goods', 'Consumer Goods'), and any points (A, B, C) you refer to in your explanation.
When explaining a shift, you must state the direction (e.g., 'outward shift') and give a valid reason (e.g., 'due to an improvement in technology').
When discussing economic growth, draw a PPC diagram showing an outward shift to illustrate the increase in the economy's productive capacity.
Evaluation Starters
Essay Structure Guide
Introduction
Begin by defining the Production Possibility Curve (PPC) and stating its primary purpose as a model to illustrate scarcity, choice, and opportunity cost. Briefly outline the key aspects you will discuss, such as its shape, shifts, and implications for an economy.
Conclusion
Summarise the main points, reiterating the PPC's significance as a foundational model for understanding resource allocation and economic choices. Conclude with a final evaluative statement on its usefulness despite its simplifications.
This chapter classifies goods and services based on their characteristics of excludability and rivalry, categorising them into free, private, public, and quasi-public goods. It also introduces merit and demerit goods, explaining how market failures like information asymmetry and low income lead to their underconsumption or overconsumption, often necessitating government intervention.
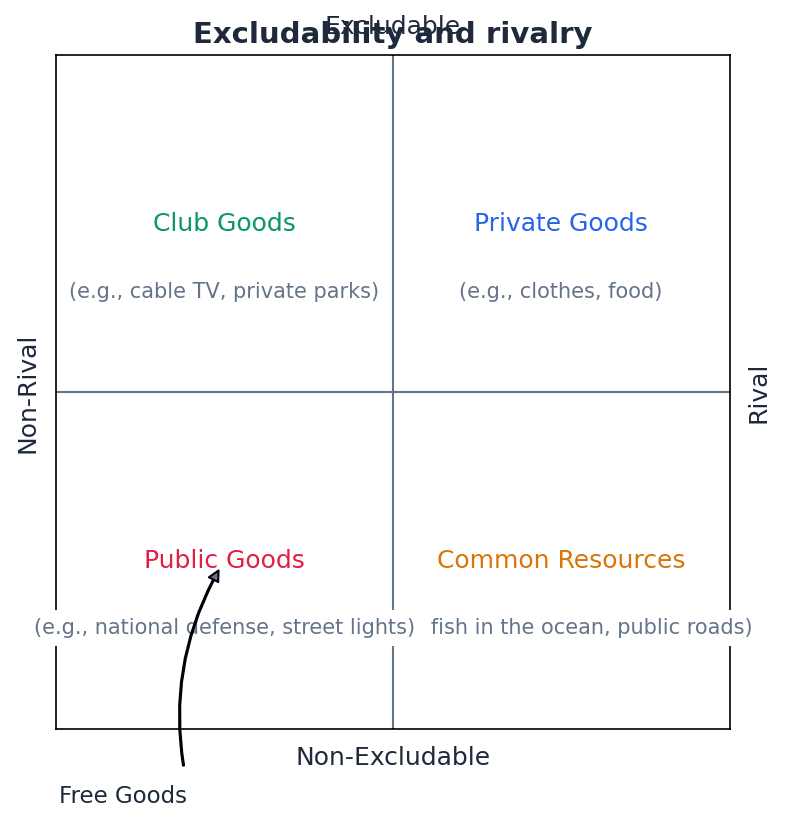
Excludability — A good is excludable (or exclusive) if other consumers can be prevented from using or consuming it.
This characteristic determines if a provider can charge a price for a good and prevent non-payers from using it. For private goods, excludability is typically achieved by charging a price, while non-excludable goods are freely available. For example, a concert ticket is excludable; without it, you cannot enter.
Rivalry — A good is rival if only one person can consume it and in doing so the good is not available for other consumers.
This characteristic describes whether one person's consumption of a good diminishes its availability for others. Most private goods are rivalrous, meaning consumption by one person directly reduces the amount available for others. For instance, eating a slice of pizza is rivalrous; once consumed, it's gone for others.
When explaining excludability, clearly state how prevention of consumption occurs, usually through pricing, for full marks.
Students often think excludability means the good is physically limited, but actually it refers to the ability to prevent consumption by those who don't pay.
Distinguish clearly between 'rival' and 'non-rival' when classifying goods; for public goods, always use 'non-rival' to avoid confusion.
Students often think non-rivalry means there's an infinite supply, but actually it means one person's consumption doesn't reduce the amount available to others.
Private goods — Private goods are also known as economic goods since they have a cost in terms of the resources used and are scarce.
These goods are bought and consumed by individuals or firms for their own benefit and possess the characteristics of excludability and rivalry. A price must be charged for private goods due to their scarcity and the resources used in their production. A smartphone is a private good because it's excludable (you pay for it) and rivalrous (only you can use that specific phone).
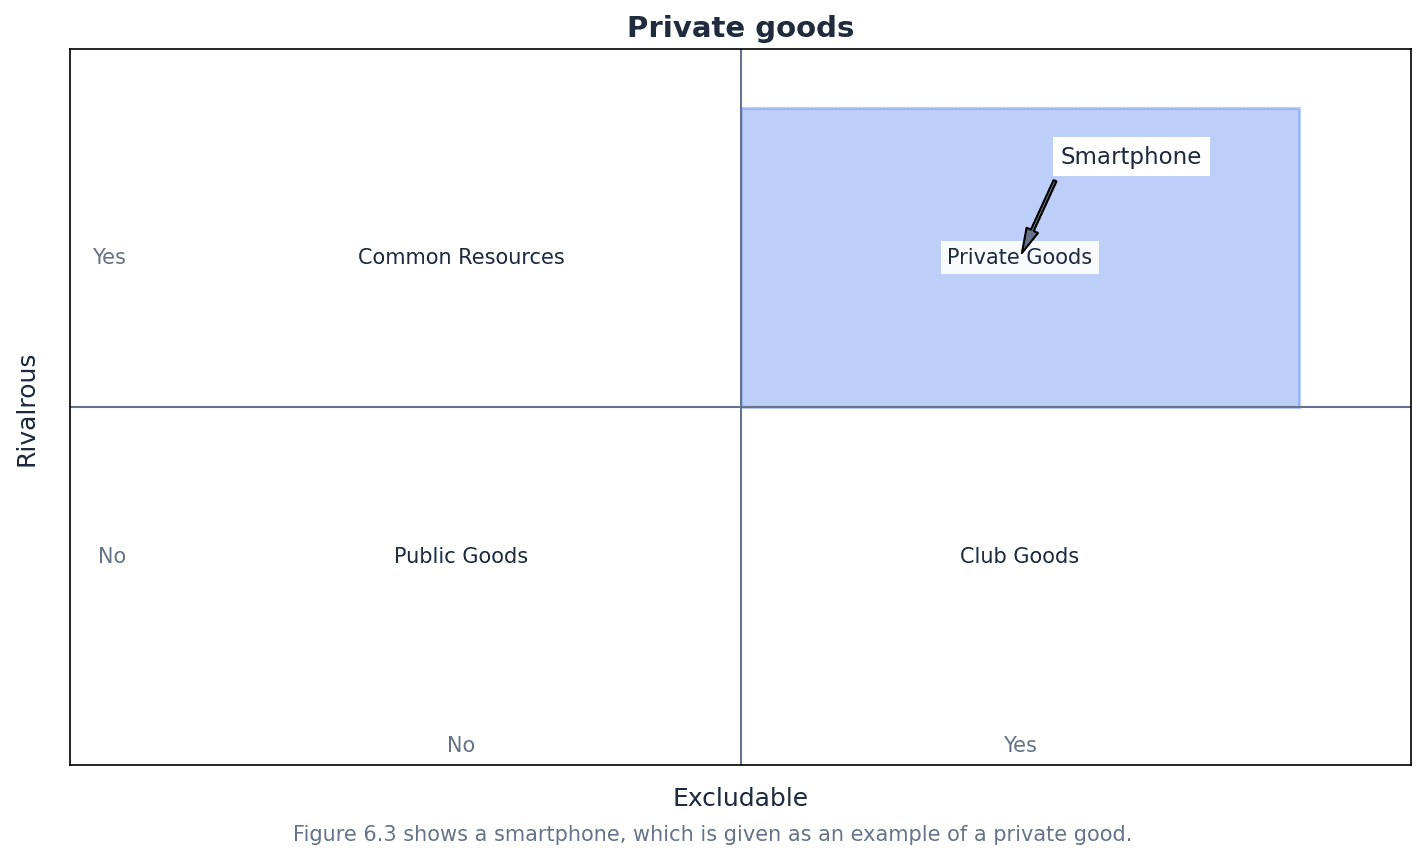
When asked to define private goods, ensure you explicitly mention both excludability and rivalry as their key characteristics.
Students often think private goods are only luxury items, but actually they include most everyday items like food, clothes, and petrol.
Free goods — Free goods have zero opportunity cost since consumption is not limited by scarcity.
These goods have no prices and, in principle, require no factors of production to produce them. They are rare in economics because most goods involve some form of scarcity or resource use. The air we breathe is a free good; it has no price and its consumption by one person doesn't diminish its availability for others.
When discussing free goods, always link them to the concept of zero opportunity cost and the absence of scarcity.
Students often think 'free' means 'no monetary cost', but actually in economics, it means zero opportunity cost due to unlimited supply.
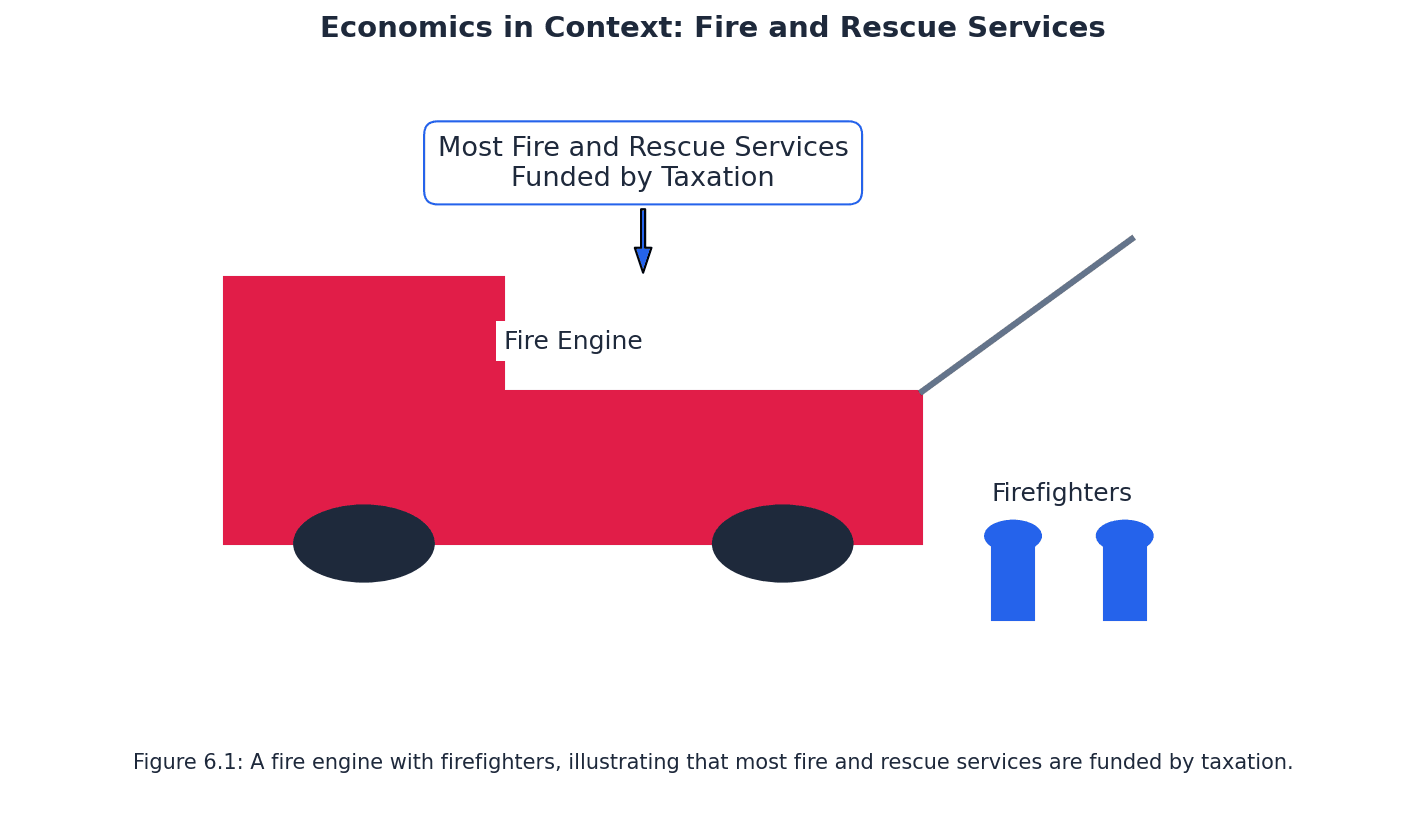
Public good — A public good has two characteristics: it must be non-excludable and non-rival.
Once a public good is provided for one consumer, it's impossible to stop anyone else from benefiting, and consumption by more people does not reduce the benefit to others. Governments often provide public goods because the free market may fail to do so due to the free rider problem. A lighthouse is a public good, warning all ships (non-excludable) without diminishing the warning for others (non-rival).
Always use 'non-excludable' and 'non-rival' when describing public goods to avoid confusion with private goods characteristics.
Students often confuse public goods with 'government-provided goods', but actually the key is their non-excludable and non-rival characteristics, regardless of who provides them.
Free rider problem — The free rider problem arises where people enjoy the benefits of a public good without having paid for it.
This problem is due to the non-excludability of public goods, making it difficult for private firms to charge for their provision and thus make a profit. Consequently, the free market may not produce public goods even if there is demand. For example, if a private company built a non-toll road, everyone could use it without paying, making it impossible for the company to recover costs.
When explaining the free rider problem, explicitly link it to the non-excludability characteristic of public goods and its consequence for market provision.
Students often think the free rider problem is about people avoiding taxes, but actually it's about the inability to exclude non-payers from consuming a non-excludable good.
The unique characteristics of public goods, specifically non-excludability and non-rivalry, lead to a significant market failure known as the free rider problem. Because individuals can benefit from a public good without paying for it, private firms find it unprofitable to provide such goods. This means that the free market, left to its own devices, will under-provide or completely fail to provide public goods, even if there is a societal demand for them. This necessitates government intervention for their provision, such as national defence or street lighting.
Quasi-public goods — Some goods that may appear to be public goods do not meet both of these characteristics in full.
These goods possess some, but not all, of the characteristics of a pure public good. They might be non-rivalrous but excludable, or non-excludable up to a point but then become rivalrous due to congestion. A toll road is a quasi-public good; it's non-rivalrous until it becomes congested, but it is excludable because you must pay a toll to use it.
When identifying quasi-public goods, clearly state which characteristic (excludability or rivalry) is not fully met and why.
Students often think quasi-public goods are just 'almost public goods', but actually they specifically fail to meet one or both of the non-excludability and non-rivalry criteria fully.
Information failure — Information failure arises because consumers do not recognise how good or bad a particular product is for them: either they do not have the right information or they simply lack some relevant information.
This market failure occurs when consumers make irrational decisions due to incomplete or inaccurate information about the benefits or harmful effects of products. It is a key reason for the underconsumption of merit goods and overconsumption of demerit goods. Not knowing the full health risks of smoking or the long-term benefits of education are examples of information failure.
When explaining information failure, provide specific examples of how consumers might be misinformed or uninformed about a product's true costs or benefits.
Students often think information failure means no information is available, but actually it means consumers either lack relevant information or misinterpret it.
Merit good — A merit good is a good that is thought to be desirable but which is underprovided by the market.
Merit goods are often underconsumed due to information failure (consumers don't fully recognise their benefits) and low income. Governments tend to provide or subsidise merit goods to encourage their consumption, as they often have positive externalities. Education is a merit good; individuals may not fully appreciate its long-term benefits or cannot afford it, leading to underconsumption.
When discussing merit goods, always refer to information failure and underconsumption to provide a complete economic analysis.
Students often think merit goods are simply 'good things', but actually the key is their underprovision and underconsumption in the market due to information failure and/or low income.
Merit goods are typically underconsumed in a free market because consumers suffer from information failure. This means individuals may not fully appreciate the true long-term benefits of consuming these goods, leading to a demand that is below the socially optimal level. Additionally, low income can prevent individuals from affording merit goods, further contributing to their underconsumption. Government intervention, such as subsidies or direct provision, is often necessary to correct this market failure.
Demerit good — A demerit good, on the other hand, is seen as any product that is thought to be undesirable and which is overprovided by the market.
Demerit goods are often overconsumed due to information failure (consumers don't fully recognise their harmful effects) and characteristics like being habit-forming, cheap, and readily available. Governments often intervene to reduce their consumption through taxes, regulations, or advertising restrictions. Cigarettes are a demerit good; consumers may not fully understand the long-term health risks, leading to overconsumption.
When analysing demerit goods, explain how information failure leads to overconsumption and mention government interventions to reduce it.
Students often think demerit goods are just 'bad things', but actually the key is their overprovision and overconsumption in the market due to information failure and often negative externalities.
Demerit goods are typically overconsumed in a free market due to information failure. Consumers may not fully understand the long-term negative consequences or harmful effects associated with these products, leading to a demand that exceeds the socially optimal level. Factors such as their addictive nature, low cost, and easy availability can exacerbate this overconsumption. Governments often intervene with measures like taxes, regulations, or public awareness campaigns to reduce the consumption of demerit goods.
For any public good question, define it using BOTH non-rivalry and non-excludability, and explain what each term means.
Always link the non-excludable nature of public goods directly to the 'free-rider problem' to explain why the market fails to provide them.
When discussing merit or demerit goods, you MUST explain the market failure. State clearly that consumption is not at the socially optimal level because of information failure.
Use a clear, real-world example to illustrate each type of good (e.g., Public Good = national defence; Quasi-Public Good = a busy motorway; Merit Good = vaccination).
In evaluation, consider how the classification of a good can change. A quiet road is non-rival (quasi-public), but at rush hour it becomes rival (private).
Advantages & Disadvantages
Government Provision of Public Goods
Government Intervention for Merit Goods
Evaluation Starters
Essay Structure Guide
Introduction
Begin by defining the core concepts of excludability and rivalry, stating their importance in classifying goods. Briefly outline the types of goods to be discussed (private, public, merit, demerit) and mention the role of market failure, particularly information failure, in their provision.
Conclusion
Summarise the main classifications of goods and the market failures associated with public, merit, and demerit goods. Reiterate the importance of understanding these classifications for effective economic policy and the role of government in addressing market inefficiencies.
This chapter introduces the fundamental concepts of demand and supply, explaining how they interact within markets through the price mechanism. It defines effective demand and supply, detailing the various factors that influence each, and distinguishes between movements along and shifts of the demand and supply curves.
notional demand — Notional demand refers to buyers wanting a product.
This is the initial desire for a product, without necessarily considering the ability to purchase it. For example, you might have a notional demand for a luxury yacht, meaning you want one, but without the money to buy it, it doesn't become effective demand.
effective demand — Effective demand is notional demand for a product backed by purchasing power.
This is the actual demand that economists refer to, as it represents a real intention to buy, supported by the financial means to do so. Sellers only respond to effective demand. If you want a concert ticket and have the money to buy it, your desire becomes effective demand, and you can actually purchase it.
Students often think 'demand' is just wanting something, but actually economists refer to effective demand, which includes the ability to pay.
Always refer to 'effective demand' when discussing demand in economic contexts, as it implies both willingness and ability to purchase.
Demand — Demand refers to the quantity of a product that buyers are willing and able to buy at different prices per period of time, ceteris paribus or other things equal.
This definition highlights that demand is not just about wanting a product, but also having the purchasing power to acquire it. It's measured over a specific time period and assumes all other influencing factors remain constant. Imagine you really want a new video game, but you only have enough money to buy it if it's on sale. Your effective demand only kicks in when the price drops to what you're willing and able to pay.
When defining demand, ensure you include 'willing and able to buy', 'at different prices', and 'per period of time', along with 'ceteris paribus' for full marks.
demand schedule — A demand schedule is a data set that represents consumers’ preferences and the quantity of a product that people are willing and able to buy at various prices per period of time, ceteris paribus.
This table of data forms the basis for plotting a demand curve, showing the inverse relationship between price and quantity demanded. It aggregates individual preferences into a market view. Think of a menu at a restaurant that lists different prices for a dish and how many people would order it at each price – that's like a demand schedule.
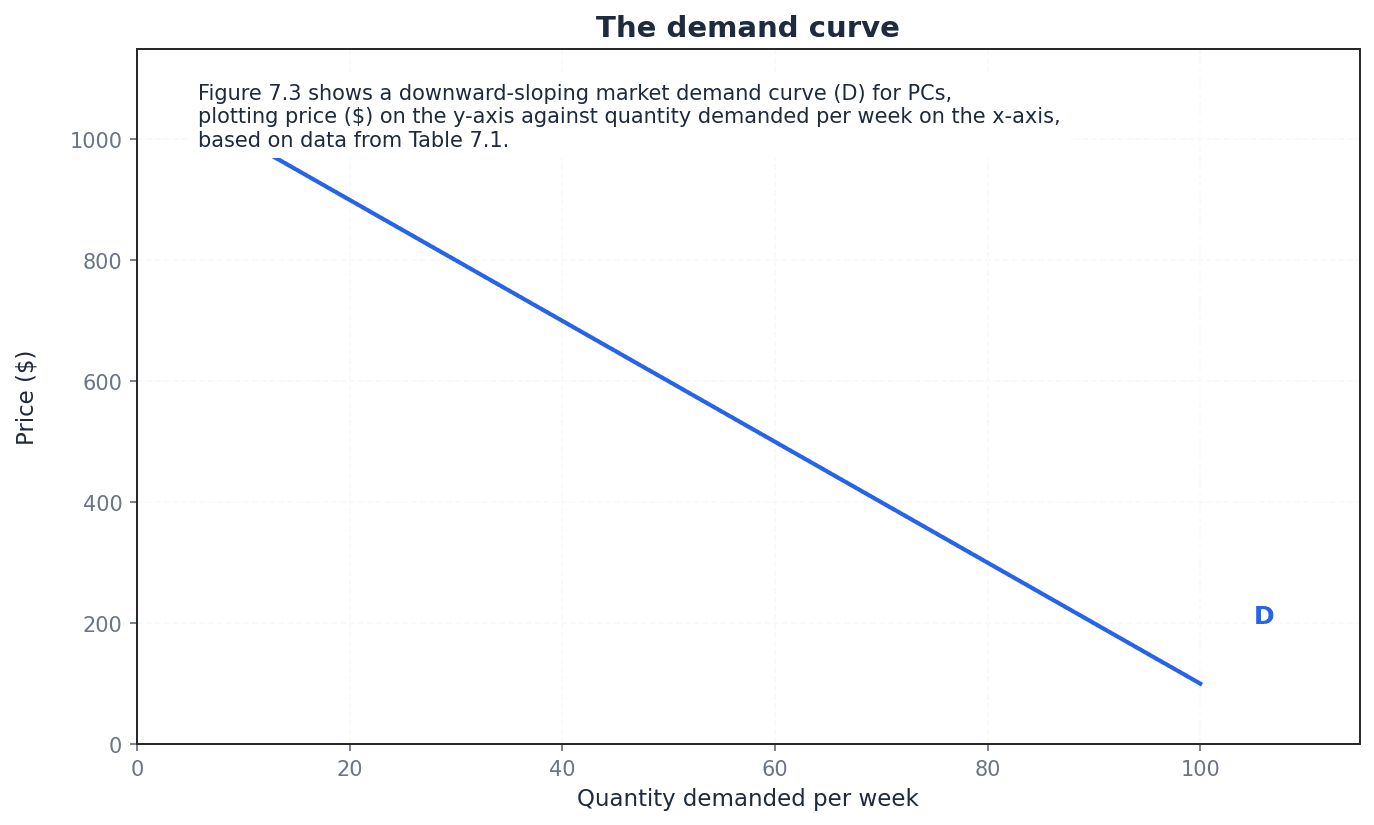
demand curve — A demand curve (D) is a graphical representation of the quantity of a product that buyers are willing and able to buy at different prices per period of time, ceteris paribus.
It typically slopes downwards from left to right, illustrating the inverse relationship between price and quantity demanded. It can represent individual or market demand. Imagine a slide at a playground: as the price (height) goes down, more people (quantity demanded) are willing to 'slide' or buy.
Beyond the product's own price, several non-price factors can influence the overall demand for a good or service, causing the entire demand curve to shift. These include changes in consumer income, the prices of related products, and government policy.
normal goods — Normal goods are goods and services for which there is a positive relationship between income and demand.
As consumers' incomes rise, they tend to buy more of these goods, and conversely, demand falls when income decreases. Most products fall into this category. When you get a pay raise, you might buy more restaurant meals or better quality clothing; these are normal goods.
inferior goods — Inferior goods are products for which there is a negative relationship, with less being purchased as income rises.
When income increases, consumers switch away from these goods to higher-quality alternatives. During recessions or income falls, demand for inferior goods tends to increase. If your income increases, you might stop buying cheap packet noodles and instead buy fresh meat and vegetables; the noodles are the inferior good.
Students often think 'inferior' means poor quality, but actually it refers to how demand changes with income, not necessarily the inherent quality.
Substitutes — Substitutes are alternative goods that satisfy the same want or need.
A change in the price of one substitute is likely to affect the demand for the other. The closer the substitutes, the greater the impact on demand. If the price of Coca-Cola goes up, some consumers might switch to Pepsi because they both satisfy the same thirst; they are substitutes.
Complements — Complements are goods that have a joint demand as they add to the satisfaction that consumers get from another product.
A change in the price or availability of one complementary good will affect the demand for the other. They are consumed together. Cars and petrol are complements; if the price of petrol rises significantly, people might drive less, reducing the demand for cars.
Students often confuse substitutes with complements, but actually substitutes are alternatives, while complements are used together.
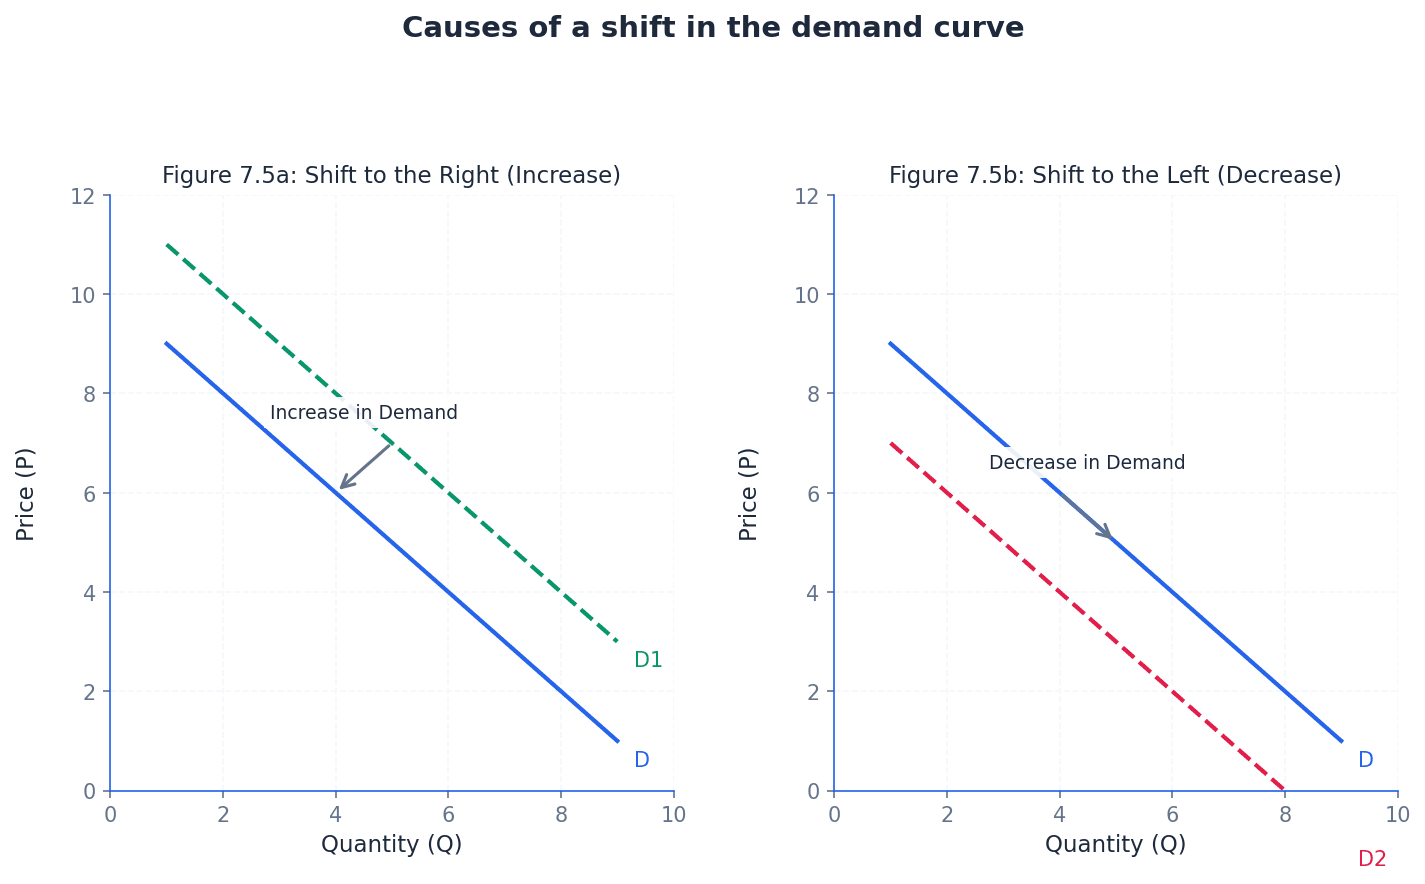
It is crucial to distinguish between a movement along the demand curve and a shift of the entire curve. A change in the product's own price causes a movement along the demand curve, representing a change in the quantity demanded. Conversely, a change in any non-price factor affecting demand causes the entire demand curve to shift.
extension of demand — An extension of demand is an increase in the quantity demanded in response to a change in the price of the product.
This is represented by a downward movement along a stationary demand curve. It occurs when the price of the good falls, leading consumers to buy more. If a shop lowers the price of your favourite chocolate bar, you might buy more of them; this is an extension of demand.
contraction of demand — A contraction of demand is a decrease in the quantity demanded in response to a change in the price of the product.
This is represented by an upward movement along a stationary demand curve. It occurs when the price of the good rises, leading consumers to buy less. If the price of cinema tickets goes up, you might go to the cinema less often; this is a contraction of demand.
Students often confuse a movement along the demand curve with a shift of the demand curve, but actually a movement is due to price change, while a shift is due to non-price factors.
Be precise with your language. Use 'extension' or 'contraction' for movements along a curve, and 'increase' or 'decrease' for shifts of a curve.
Supply — Supply refers to the quantity of a product that suppliers are willing and able to sell at different prices over a period of time, ceteris paribus or other things equal.
This definition emphasizes that suppliers must be both willing (motivated by profit) and able (have the resources) to sell. It's measured over a specific time period and assumes other factors are constant. A baker is willing and able to supply more bread if the price per loaf increases, as it becomes more profitable for them.
Ensure your definition of supply includes 'willing and able to sell', 'at different prices', and 'over a period of time', along with 'ceteris paribus'.
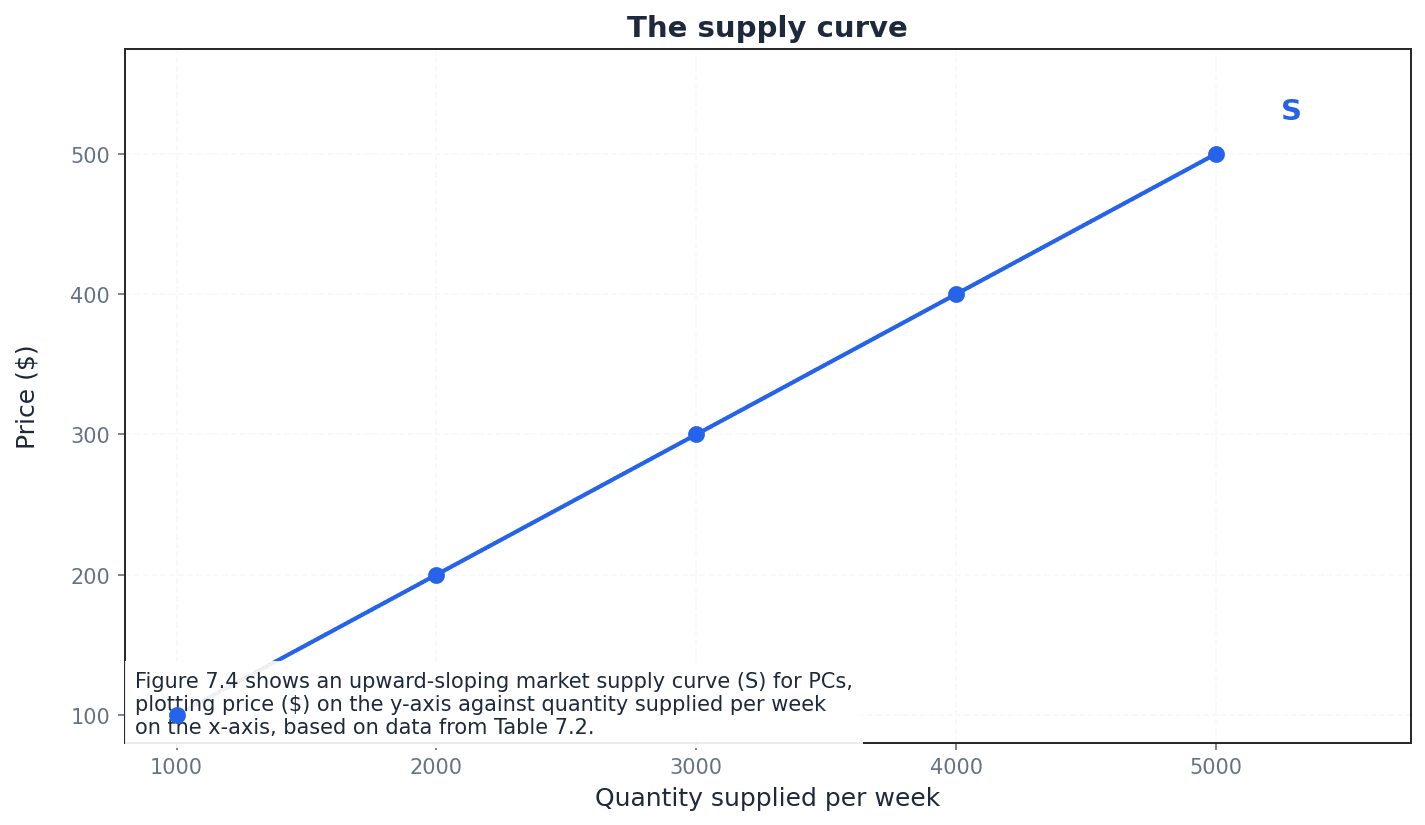
supply curve — A supply curve (S) is a graphical representation of the quantity of a product that suppliers are willing and able to sell at different prices over a period of time, ceteris paribus.
It typically slopes upwards from left to right, illustrating the positive relationship between price and quantity supplied. It can represent individual firm supply or market supply. Imagine climbing a hill: as the price (height) goes up, producers (quantity supplied) are willing to 'climb higher' or supply more.
Similar to demand, supply is influenced by factors other than the product's own price. These non-price factors, such as changes in the costs of production or government policy, can cause the entire supply curve to shift, indicating a change in the overall willingness and ability of producers to sell at various prices.
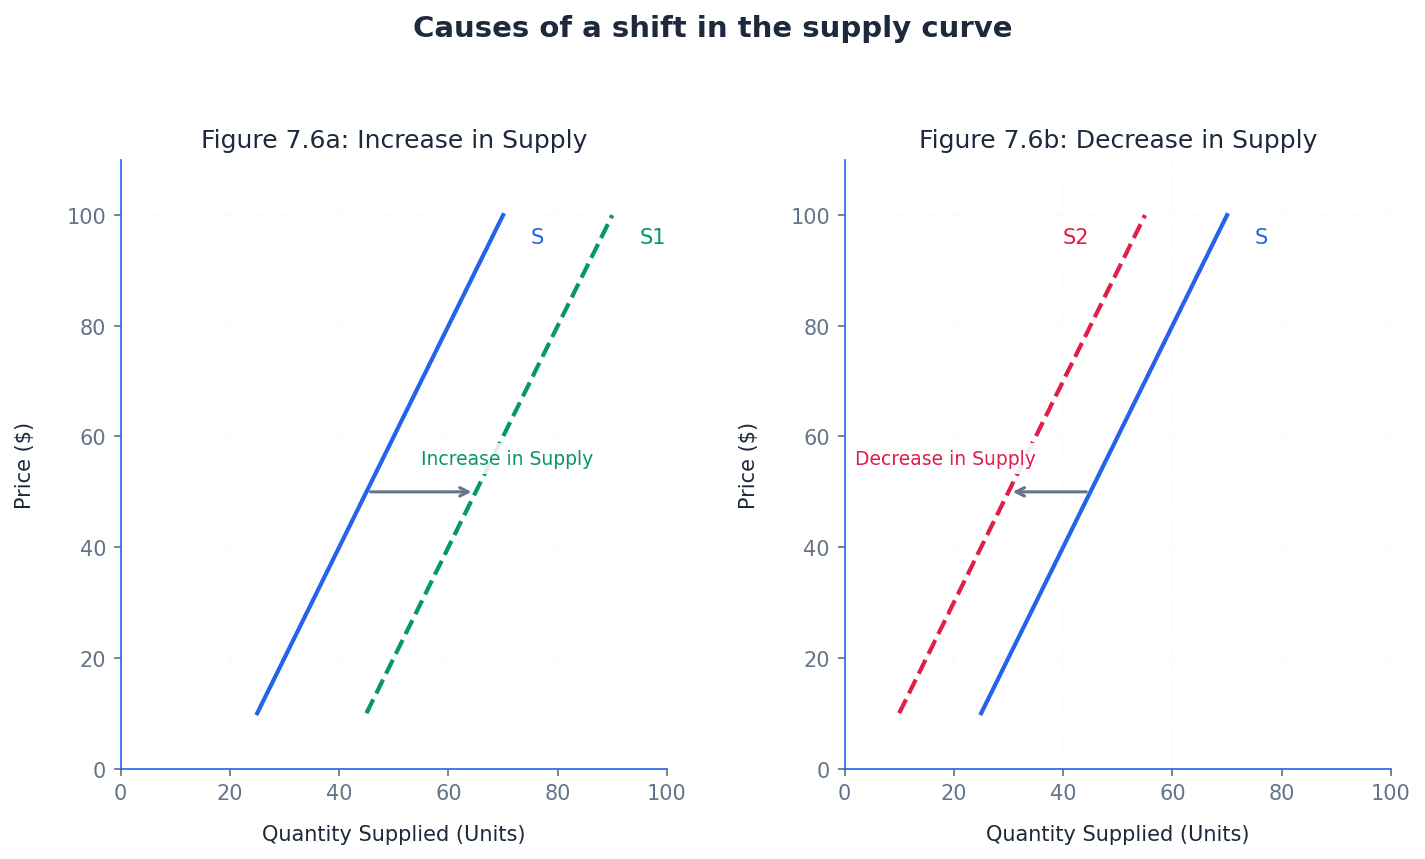
Just as with demand, a change in the product's own price leads to a movement along the supply curve, known as a change in quantity supplied. However, a change in any non-price factor affecting supply will cause the entire supply curve to shift, representing a change in supply.
extension of supply — An extension of supply is an increase in the quantity supplied in response to a change in the price of the product.
This is represented by an upward movement along a stationary supply curve. It occurs when the price of the good rises, incentivizing producers to supply more. If the price farmers get for their corn increases, they might plant more corn next season; this is an extension of supply.
contraction of supply — A contraction of supply is a decrease in the quantity supplied in response to a change in the price of the product.
This is represented by a downward movement along a stationary supply curve. It occurs when the price of the good falls, making it less profitable for producers to supply as much. If the price of milk falls significantly, dairy farmers might reduce their herd size or supply less milk; this is a contraction of supply.
Students often confuse a movement along the supply curve with a shift of the supply curve, but actually a movement is due to price change, while a shift is due to non-price factors.
Clearly label axes (Price, Quantity) and the curve (D or S) when drawing; ensure you understand that a change in price causes a movement along the curve, not a shift.
When drawing a shift, use arrows and label the new curve clearly (e.g., D1 to D2) to show the direction of change.
When explaining a shift, always explicitly state the non-price factor that caused it.
Advantages & Disadvantages
The Price Mechanism
Government Intervention in Markets (e.g., taxes, subsidies)
Evaluation Starters
Essay Structure Guide
Introduction
Begin by defining demand and supply, highlighting the importance of 'effective demand' and 'ceteris paribus'. Briefly state how the price mechanism uses these forces to allocate resources.
Conclusion
Summarise the key role of demand and supply in determining market prices and quantities. Reiterate the importance of understanding the distinction between movements and shifts for economic analysis.
This chapter explores the concept of elasticity, which measures the responsiveness of quantity demanded to changes in price, income, or the price of related goods. It defines and explains Price Elasticity of Demand (PED), Income Elasticity of Demand (YED), and Cross Elasticity of Demand (XED), including their calculation, interpretation, and factors affecting them. Understanding these elasticities is crucial for businesses and governments in making informed decisions regarding pricing, revenue, and policy.
elasticity — Elasticity measures the responsiveness of one variable (such as quantity demanded for a product) after a change in another variable (such as the price of that product), ceteris paribus.
It is a coefficient that quantifies the extent of change. If a small change in price or income produces a bigger change in quantity demanded, the relationship is elastic; if a large change produces a small change, it is inelastic. Think of a rubber band: a very elastic band stretches a lot with a small pull, while an inelastic band barely stretches even with a strong pull. Similarly, elastic demand changes a lot with a small price change, inelastic demand changes little.
Students often think elasticity only refers to price, but it is actually a general concept measuring responsiveness between any two related economic variables.
When defining elasticity, ensure you mention 'responsiveness' and 'ceteris paribus' to achieve full marks. Be precise about which variables are changing.
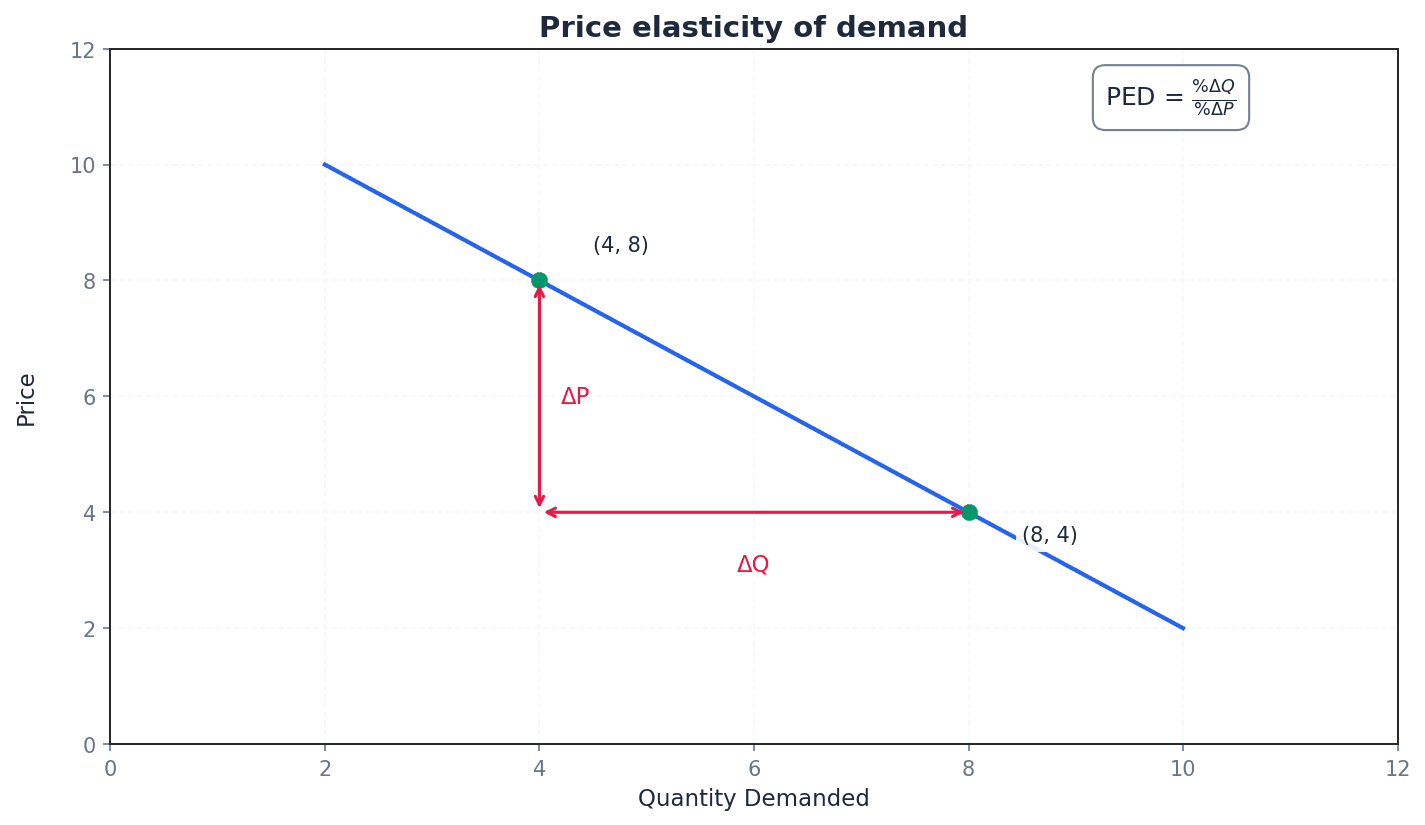
Price elasticity of demand (PED) — Price elasticity of demand (PED) measures the responsiveness of the quantity demanded for a product following a change in the price of the product.
It quantifies how much quantity demanded changes when the product's price changes, assuming all other factors remain constant. A high PED means demand is very sensitive to price changes, while a low PED means it's less sensitive. For example, if a shop raises the price of a common brand of bottled water (high PED), many people will switch to another brand or tap water. If they raise the price of a life-saving medicine (low PED), people will likely still buy it.
Price elasticity of demand (PED)
Used to measure the responsiveness of quantity demanded to a change in the product's own price. Economists usually ignore the negative sign.
Students often think PED is always negative, but economists usually refer to PED in absolute terms by ignoring the negative sign.
Always state the formula for PED and remember to interpret both the size (elastic/inelastic) and the sign (though often ignored for PED) of the coefficient in your analysis.
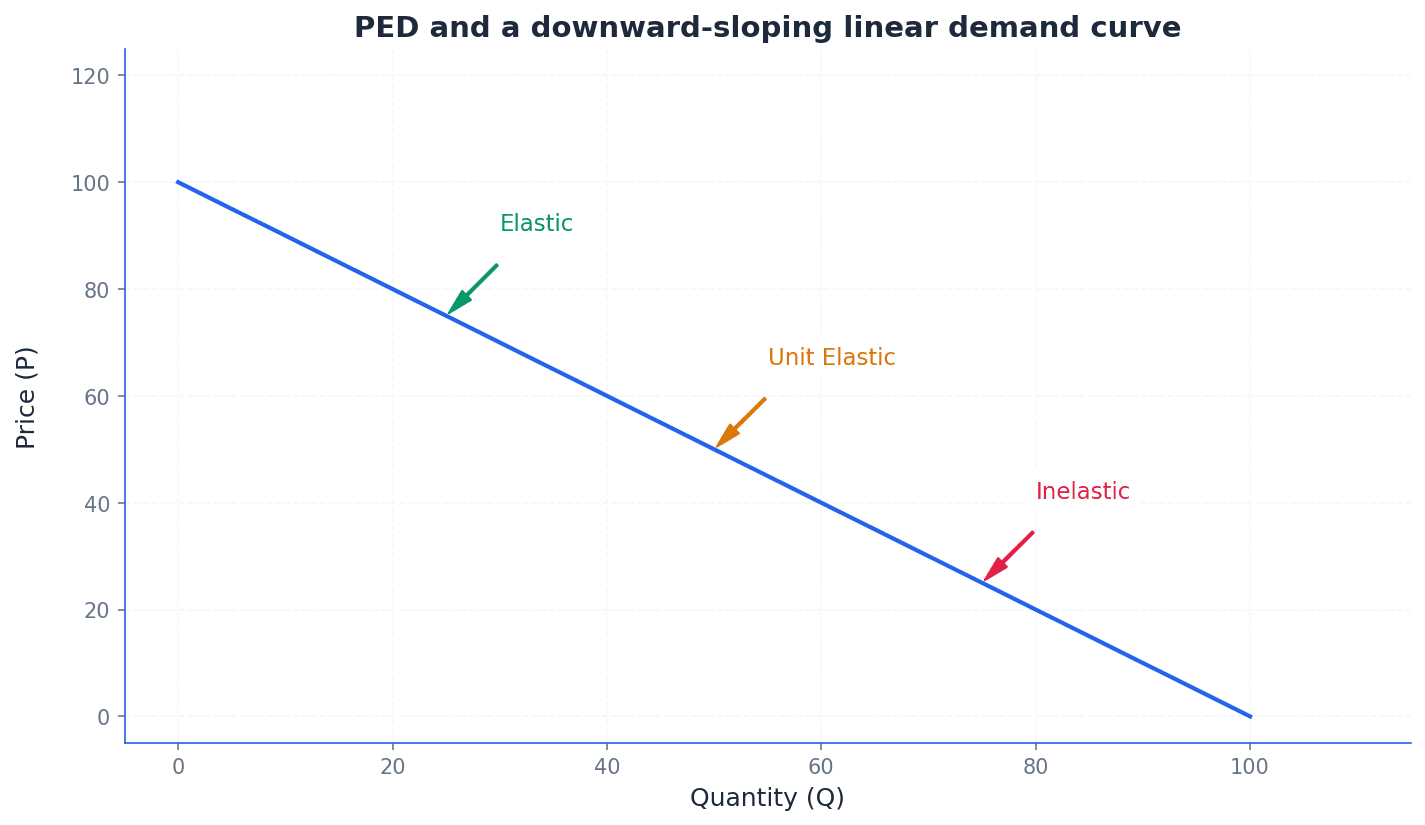
price inelastic — Demand is price inelastic when the numerical value of PED is less than 1, meaning the quantity demanded is unresponsive to price changes.
In this case, a percentage change in price leads to a smaller percentage change in quantity demanded. For firms, this means a price increase will lead to an increase in total revenue. Imagine needing petrol for your car; even if the price goes up significantly, you still need to buy it, so your demand doesn't change much. This is price inelastic.
Students often think 'inelastic' means no change at all, but it actually means a less than proportionate change.
When explaining price inelastic demand, clearly link it to the concept of total revenue: a price increase will raise total revenue, and a price decrease will lower it.
price elastic — Demand is price elastic when the numerical value of PED is greater than 1, meaning the quantity demanded is responsive to price changes.
Here, a percentage change in price leads to a larger percentage change in quantity demanded. For firms, this implies that a price increase will lead to a decrease in total revenue. For example, if a specific brand of chocolate bar increases its price, many consumers will easily switch to a cheaper alternative, showing elastic demand.
When analysing price elastic demand, ensure you explain the inverse relationship with total revenue: a price decrease will increase total revenue, and a price increase will decrease it.
perfectly inelastic — Demand is perfectly inelastic when the PED is 0, meaning it is completely unresponsive to price changes.
Regardless of the price charged, consumers are willing and able to buy the exact same amount. This is represented by a vertical demand curve. A person needing a life-saving drug will buy the same quantity regardless of its price, as there are no substitutes and it's essential.
When drawing a perfectly inelastic demand curve, ensure it is a vertical line to accurately represent a PED of 0.
perfectly elastic — Demand is perfectly elastic when the PED is infinite (∞), meaning consumers will buy all that is available at a specific price, but none at a higher price.
Even a tiny increase in price causes quantity demanded to fall to zero, while a tiny decrease causes quantity demanded to become infinite. This is represented by a horizontal demand curve. In a perfectly competitive market, if a single farmer tries to sell wheat above the market price, they will sell nothing, as buyers can easily get identical wheat from other farmers at the market price.
When drawing a perfectly elastic demand curve, ensure it is a horizontal line to accurately represent an infinite PED.
unit elasticity — Demand has unit elasticity when the PED value is (-)1, meaning the percentage change in price is exactly matched by the percentage fall in quantity demanded.
In this scenario, total expenditure by consumers (and total revenue for firms) remains unchanged when the price changes. The demand curve is typically a rectangular hyperbola. If a 10% price increase leads to a 10% decrease in quantity demanded, the total amount of money spent remains the same, like balancing a seesaw perfectly.
For unit elasticity, remember that total revenue remains constant regardless of price changes. This is a key characteristic to mention in explanations.
The relationship between Price Elasticity of Demand (PED) and total expenditure (or total revenue for firms) is crucial for decision-making. Total expenditure is calculated as Price (P) multiplied by Quantity (Q). If demand is price elastic (PED > 1), a price decrease will lead to a more than proportionate increase in quantity demanded, thus increasing total revenue. Conversely, a price increase will decrease total revenue. If demand is price inelastic (PED < 1), a price decrease will lead to a less than proportionate increase in quantity demanded, decreasing total revenue. A price increase will increase total revenue. When demand has unit elasticity (PED = 1), total revenue remains constant regardless of price changes.
Total expenditure / Total revenue
Represents the total amount of money consumers spend on a product, which is equal to the total revenue received by a firm.
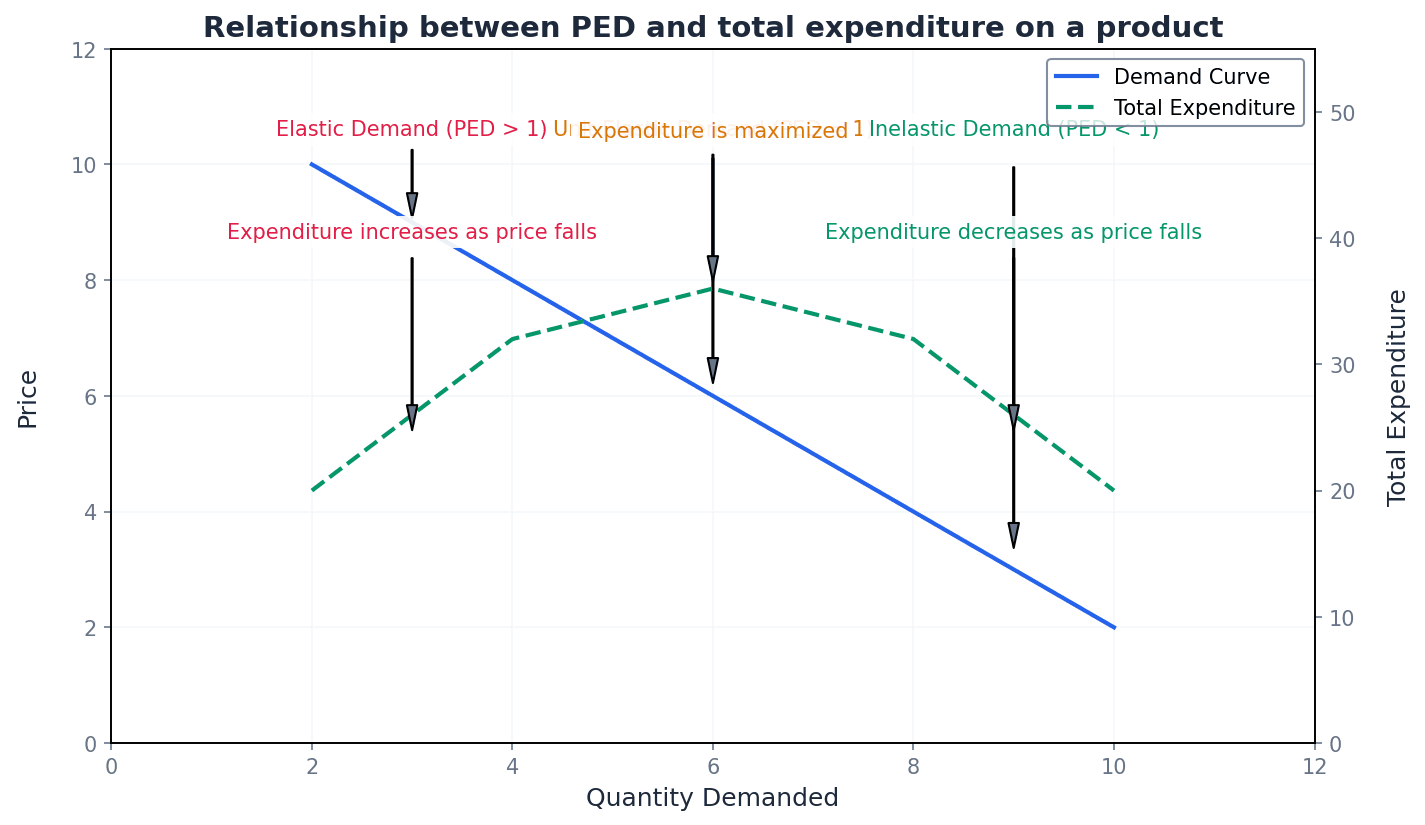
Even along a straight-line, downward-sloping demand curve, the price elasticity of demand is not constant. At higher prices and lower quantities, demand tends to be price elastic. As the price falls and quantity demanded increases, PED moves towards unit elasticity at the midpoint of the demand curve. At lower prices and higher quantities, demand becomes price inelastic. This variation is due to the relative percentage changes in price and quantity along the curve.
Income elasticity of demand (YED) — Income elasticity of demand (YED) measures the responsiveness of the quantity demanded for a product following a change in income.
It indicates how much the quantity demanded of a good changes when consumers' incomes change, assuming other factors are constant. The sign of YED is crucial for classifying goods. For example, if your income doubles, you might buy more restaurant meals (positive YED) but fewer instant noodles (negative YED).
Income elasticity of demand (YED)
Used to measure the responsiveness of quantity demanded to a change in consumer income. The sign (positive/negative) is important for classifying goods.
Students often forget to consider the sign of YED, but the sign (positive or negative) is essential for classifying goods as normal or inferior.
When discussing YED, always refer to both the size (elastic/inelastic) and the sign (positive/negative) of the coefficient to fully classify the good.
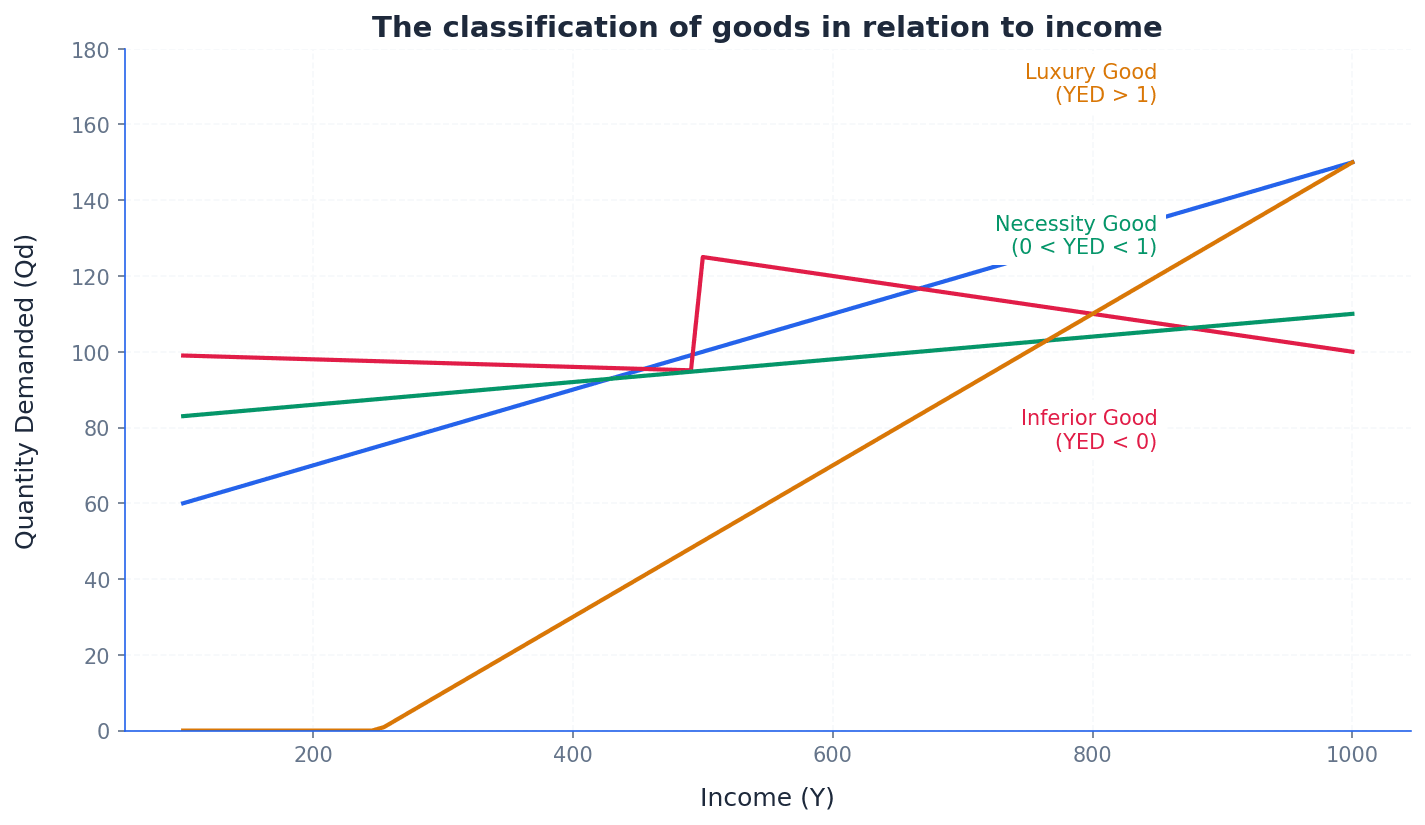
normal good — A normal good is one where the quantity demanded increases as income increases, and its YED is positive and expected to be between 0 and 1.
Most products fall into this category, meaning that as people get richer, they tend to buy more of these goods. Examples include chicken meat in emerging economies or smartphones. As you earn more money, you might buy more clothes or go out to eat more often; these are normal goods.
Students often assume all normal goods have a YED greater than 1, but normal goods can have YED between 0 and 1 (necessities) or greater than 1 (luxuries).
inferior good — An inferior good is one where the quantity demanded decreases as income increases or increases as income falls, and its YED is negative.
Consumers tend to replace inferior goods with better quality substitutes as their income rises. Examples include poor quality rice or packet noodles. When you get a better job, you might stop buying cheap instant coffee and switch to a more expensive, higher-quality brand. The instant coffee is the inferior good.
When identifying inferior goods, explicitly state that the YED is negative and explain the inverse relationship between income and quantity demanded.
Students often think 'inferior' means bad quality, but it actually refers to how demand for the good changes with income, not necessarily its inherent quality.
necessity good — A necessity good is a type of normal good for which the quantity demanded is unlikely to change significantly when income changes, having a positive YED close to zero.
These are staple foodstuffs or essential items that households purchase regularly, and there's a limit to how much more they will buy even with substantial income increases. Examples include rice, flour, and pulses. Even if your income doubles, you won't suddenly buy ten times more bread or milk; you'll still buy roughly the same amount because you only need so much.
Students often confuse necessity goods with inferior goods, but necessity goods have a positive YED (though close to zero), while inferior goods have a negative YED.
superior or luxury good — A superior or luxury good is a normal good with a positive YED that is greater than 1, meaning the quantity demanded is highly responsive to changes in income.
As incomes rise, the demand for these goods increases more than proportionately. Examples include designer clothes, jewellery, or the latest electronic devices. If you get a big raise, you might decide to buy a luxury car or go on an expensive vacation; these are superior goods because your demand for them increases significantly with income.
When discussing superior goods, highlight that the YED is positive and greater than 1, indicating that demand grows faster than income.
Cross elasticity of demand (XED) — Cross elasticity of demand (XED) measures the responsiveness of the quantity demanded for one product following a change in the price of another product.
It quantifies how the demand for product A is affected by a change in the price of product B, assuming other factors are constant. The sign of XED is crucial for determining if goods are substitutes or complements. For example, if the price of coffee goes up, you might buy more tea (positive XED, substitutes). If the price of smartphones goes up, you might buy fewer apps (negative XED, complements).
Cross elasticity of demand (XED)
Used to measure the responsiveness of quantity demanded for one product to a change in the price of another product. The sign (positive/negative) indicates if goods are substitutes or complements.
Students often confuse the numerator and denominator in the XED formula, but the numerator is always the percentage change in quantity demanded of product A, and the denominator is the percentage change in the price of product B.
Always state the XED formula and clearly explain how the sign (positive for substitutes, negative for complements) indicates the relationship between the two goods.
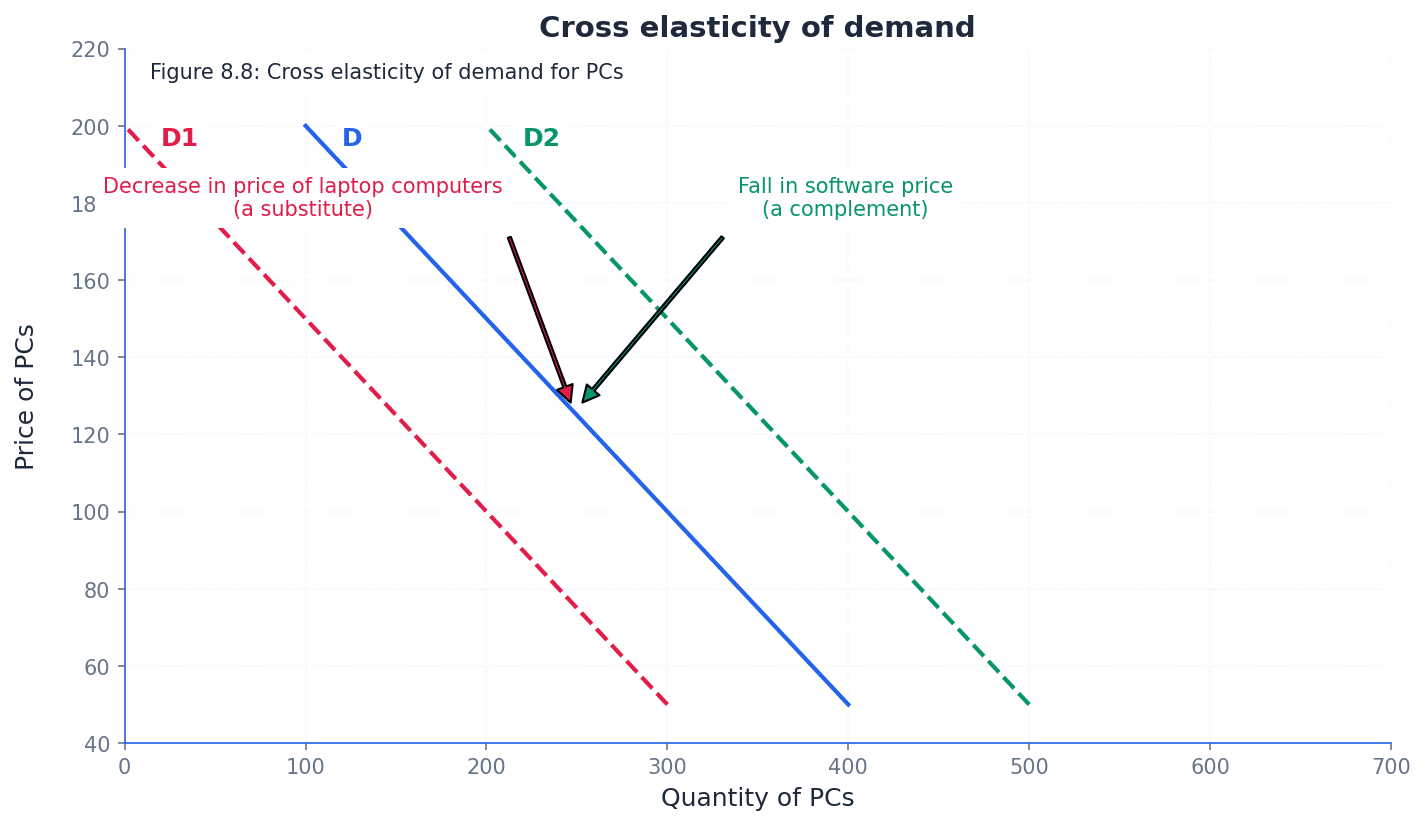
substitutes — Substitutes are two goods for which the XED is positive, meaning an increase in the price of one good causes an increase in the quantity demanded of the other good.
Consumers can switch between these goods to satisfy a similar want or need. The higher the positive XED, the closer the substitutes. Examples include Coca-Cola and Pepsi Cola. If the price of butter goes up, you might buy more margarine instead; butter and margarine are substitutes.
When identifying substitutes, explicitly state that the XED is positive and explain the direct relationship between the price of one good and the demand for the other.
complements — Complements are two goods for which the XED is negative, meaning an increase in the price of one product causes a decrease in the demand for another product.
These goods are jointly demanded, meaning they are often consumed together. The more negative the XED, the stronger the complementary relationship. Examples include smartphones and apps, or cinema tickets and popcorn. If the price of car fuel goes up significantly, people might drive less, leading to less demand for car washes; fuel and car washes are complements.
When identifying complements, explicitly state that the XED is negative and explain the inverse relationship between the price of one good and the demand for the other.
Price, income, and cross elasticities of demand are crucial for decision-making by both businesses and governments. Businesses use PED to formulate pricing strategies, understanding how price changes will affect total revenue. YED helps firms forecast demand changes based on economic growth and classify their products. XED informs firms about competitive relationships and potential impacts from rivals' pricing or the demand for complementary products. Governments use these elasticities to predict the impact of taxes, subsidies, or income policies on consumer behaviour and market outcomes.
In data response questions, look for figures on price, quantity, and income to calculate elasticities yourself, even if not explicitly asked, to add depth to your analysis.
Draw diagrams to illustrate your points. A steep demand curve represents price-inelastic demand, while a shallow curve represents price-elastic demand.
Advantages & Disadvantages
Using PED for business pricing strategies
Using YED for business planning and product classification
Evaluation Starters
Essay Structure Guide
Introduction
Begin by defining elasticity as the responsiveness of quantity demanded to changes in price, income, or related goods' prices, and briefly introduce PED, YED, and XED as the key concepts to be discussed. State the importance of these concepts for decision-making by firms and governments.
Conclusion
Summarise the importance of understanding price, income, and cross elasticities of demand for economic agents. Reiterate that while these concepts are powerful analytical tools, their practical application requires careful consideration of real-world complexities and dynamic market conditions.
This chapter introduces Price Elasticity of Supply (PES), a measure of how responsive the quantity supplied of a product is to changes in its price. It covers the calculation and interpretation of PES, distinguishing between elastic, inelastic, perfectly elastic, and perfectly inelastic supply. The chapter also examines the key factors that influence PES and its implications for how businesses adapt to changing market conditions.
Price elasticity of supply (PES) — Price elasticity of supply (PES) measures the responsiveness of the quantity supplied of a product following a change in the price of the product.
It indicates how much the quantity supplied is affected by a change in the product's price, assuming all other factors remain constant. For example, a baker with spare flour and oven capacity can quickly bake more bread if the price goes up, demonstrating elastic supply. A higher PES means producers can easily adjust output in response to price changes.
Students often confuse 'supply' with 'quantity supplied'; PES measures the responsiveness of quantity supplied. Also, students often think PES is about the change in supply, but actually it's about the percentage change in quantity supplied.
When asked to define PES, ensure you include 'responsiveness', 'quantity supplied', 'change in price', and 'ceteris paribus' for full marks.
Price Elasticity of Supply (PES)
This formula is always positive because the supply curve is upward sloping. It is used to measure the responsiveness of supply to price changes.
The numerical value of the PES coefficient indicates the degree of responsiveness. A value greater than 1 signifies elastic supply, while a value less than 1 indicates inelastic supply. A value of exactly 1 means unitary elasticity. Understanding these values is crucial for analysing how producers react to price fluctuations.
Price elastic supply — Price elastic supply means that the quantity supplied responds more than proportionately to a change in its price, with a numerical value of PES greater than 1.
This indicates that producers are highly responsive to price changes, able to significantly increase or decrease output. For instance, a T-shirt manufacturer with extra fabric and idle sewing machines can quickly increase production if T-shirt prices rise, demonstrating elastic supply. It often occurs when firms have spare capacity, readily available inputs, or can easily switch production.
Students sometimes misinterpret 'elastic' as an absolute large change in quantity, but actually it means a proportionately larger change in quantity supplied relative to the price change.
When analysing elastic supply, discuss the underlying factors like availability of stocks or productive capacity that enable this responsiveness.
Price inelastic supply — Price inelastic supply means that the quantity supplied is proportionately less than the change in price, with a numerical value of PES less than 1.
This indicates that producers are not very responsive to price changes, meaning they cannot easily increase or decrease output. For example, a farmer growing coffee beans cannot quickly increase supply if prices rise, as it takes years for new plants to mature, making their supply inelastic. This is common for goods with limited production capacity, long production times, or scarce inputs.
Students often think 'inelastic' means no change in quantity, but actually it means a proportionately smaller change in quantity supplied relative to the price change.
When explaining inelastic supply, link it to constraints such as fixed capacity, long production lags, or difficulty in storing perishable goods.
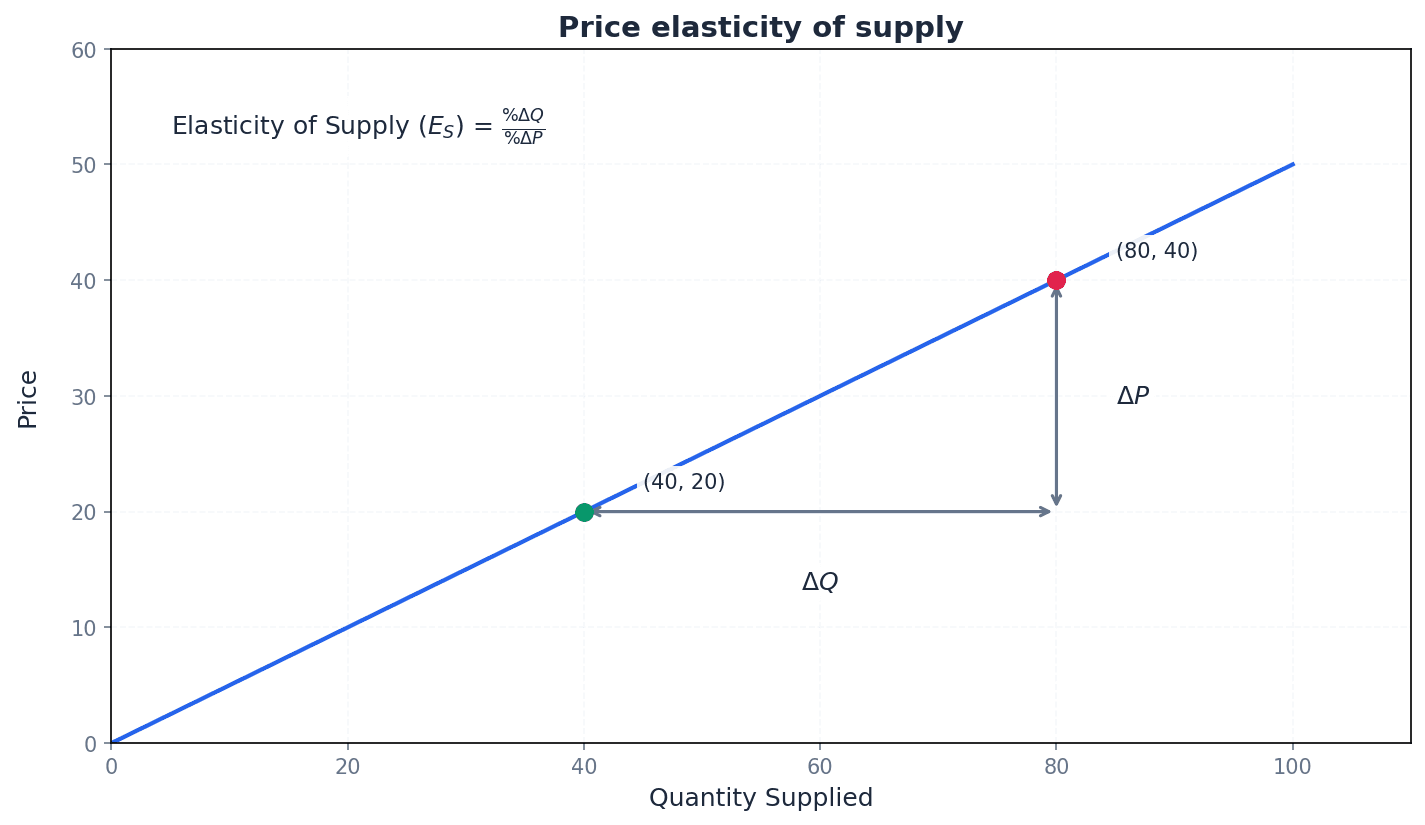
Perfectly inelastic — Perfectly inelastic supply occurs when it is not possible for a producer to increase or decrease supply, regardless of any change in the price of the product, resulting in a PES of zero.
The supply curve is vertical, indicating that the quantity supplied is fixed at a single amount, irrespective of price fluctuations. For instance, a single, unique antique painting has a perfectly inelastic supply; only one exists, so no matter how high the price goes, no more can be supplied. This is typical for highly perishable goods that must be sold immediately once ready.
Students often confuse perfectly inelastic with simply 'inelastic', but actually perfectly inelastic means absolutely no change in quantity supplied.
Illustrate perfectly inelastic supply with a vertical supply curve and provide examples like fresh flowers on a specific day or unique historical artifacts.
Perfectly elastic — Perfectly elastic supply occurs when a producer is only willing to supply products for a given price and no less, resulting in a horizontal supply curve and a PES of infinity (∞).
At this specific price, producers are willing to supply any quantity, but if the price falls even slightly, they will supply nothing. For example, a street vendor selling identical hot dogs might sell unlimited hot dogs at 4.99, demonstrating perfectly elastic supply at $5. This is a theoretical extreme, often used to illustrate concepts in perfect competition.
Students often struggle to grasp infinite PES, but actually it means an infinitesimal price change leads to an infinite change in quantity supplied.
When discussing perfectly elastic supply, explain that it's a theoretical concept often associated with industries where individual firms are price takers.
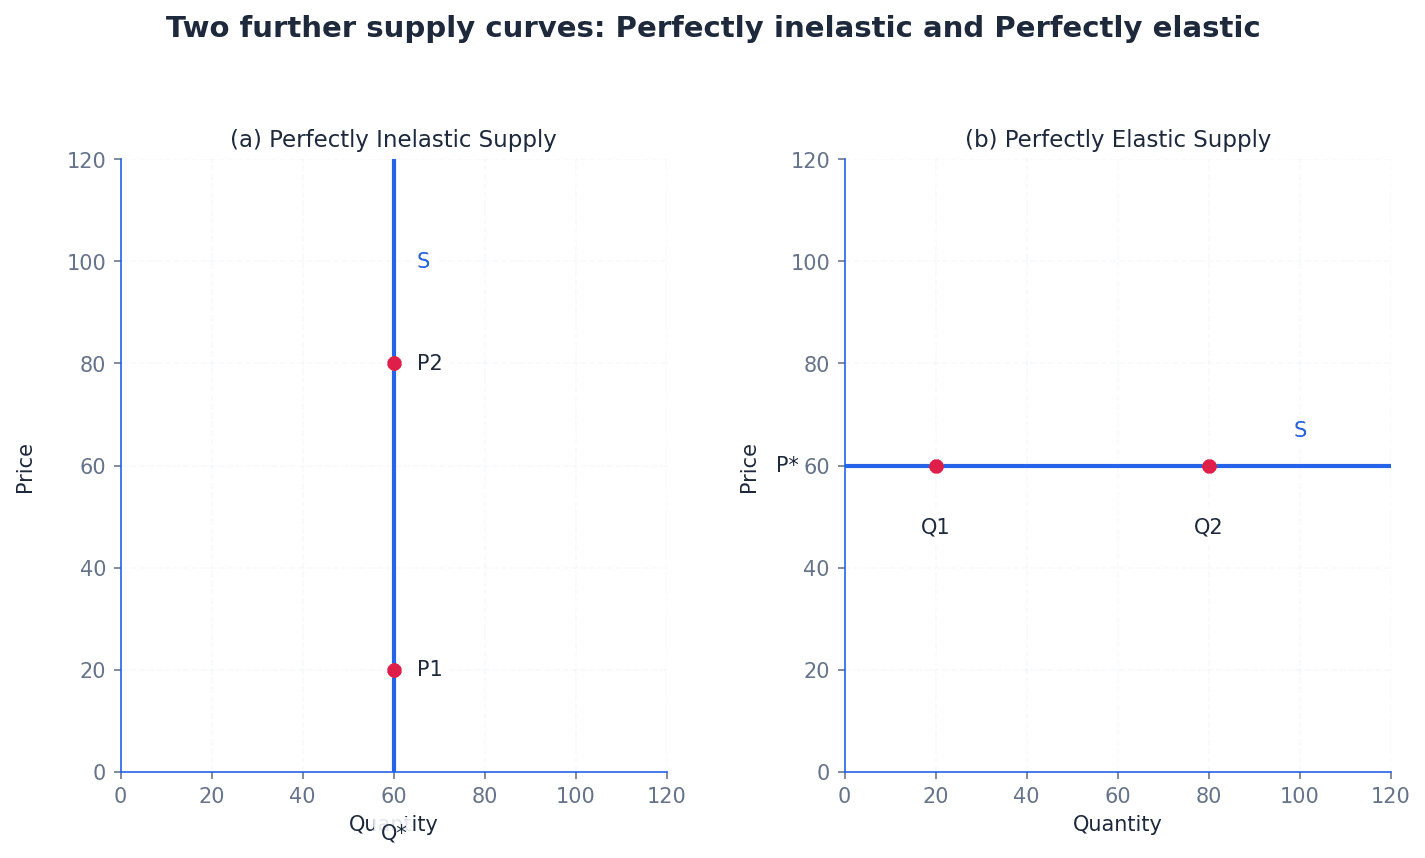
Several key factors determine how responsive producers are to price changes. These include the availability of stocks, the time period under consideration, and the firm's productive capacity. Each of these factors affects the speed and ease with which businesses can adjust their output.
Firms with readily available stocks of finished goods or raw materials can quickly increase quantity supplied in response to a price rise, making their supply more elastic. Conversely, if stocks are low or non-existent, increasing supply quickly becomes difficult, leading to inelastic supply. For example, a manufacturer with a large inventory of T-shirts can respond faster to a price increase than one with no stock.
The time period is a crucial determinant of PES. In the immediate short run, supply is often perfectly inelastic as producers cannot change output. In the short run, some factors of production can be varied, allowing for some adjustment, making supply inelastic. However, in the long run, all factors of production can be adjusted, new firms can enter the market, and existing firms can expand capacity, making supply significantly more elastic. This is particularly relevant for agricultural goods, where growing seasons impose long production lags.
Students may not fully grasp the significance of the time period in determining PES, especially for agricultural goods. Supply is almost always more inelastic in the short run than in the long run.
The extent of a firm's spare productive capacity directly impacts its PES. If a firm has idle machinery, unused factory space, or underemployed labour, it can easily increase production without significant new investment, resulting in elastic supply. If a firm is already operating at full capacity, increasing output requires substantial investment and time, making supply inelastic in the short run.
The PES of a product has significant implications for how businesses react to changing market conditions. Firms producing goods with elastic supply can quickly capitalise on price increases by expanding output, while those with inelastic supply face constraints in responding to such changes. This distinction is particularly evident when comparing agricultural goods, which often have inelastic supply due to long production cycles, with manufactured goods, which tend to have more elastic supply due to greater flexibility in production.
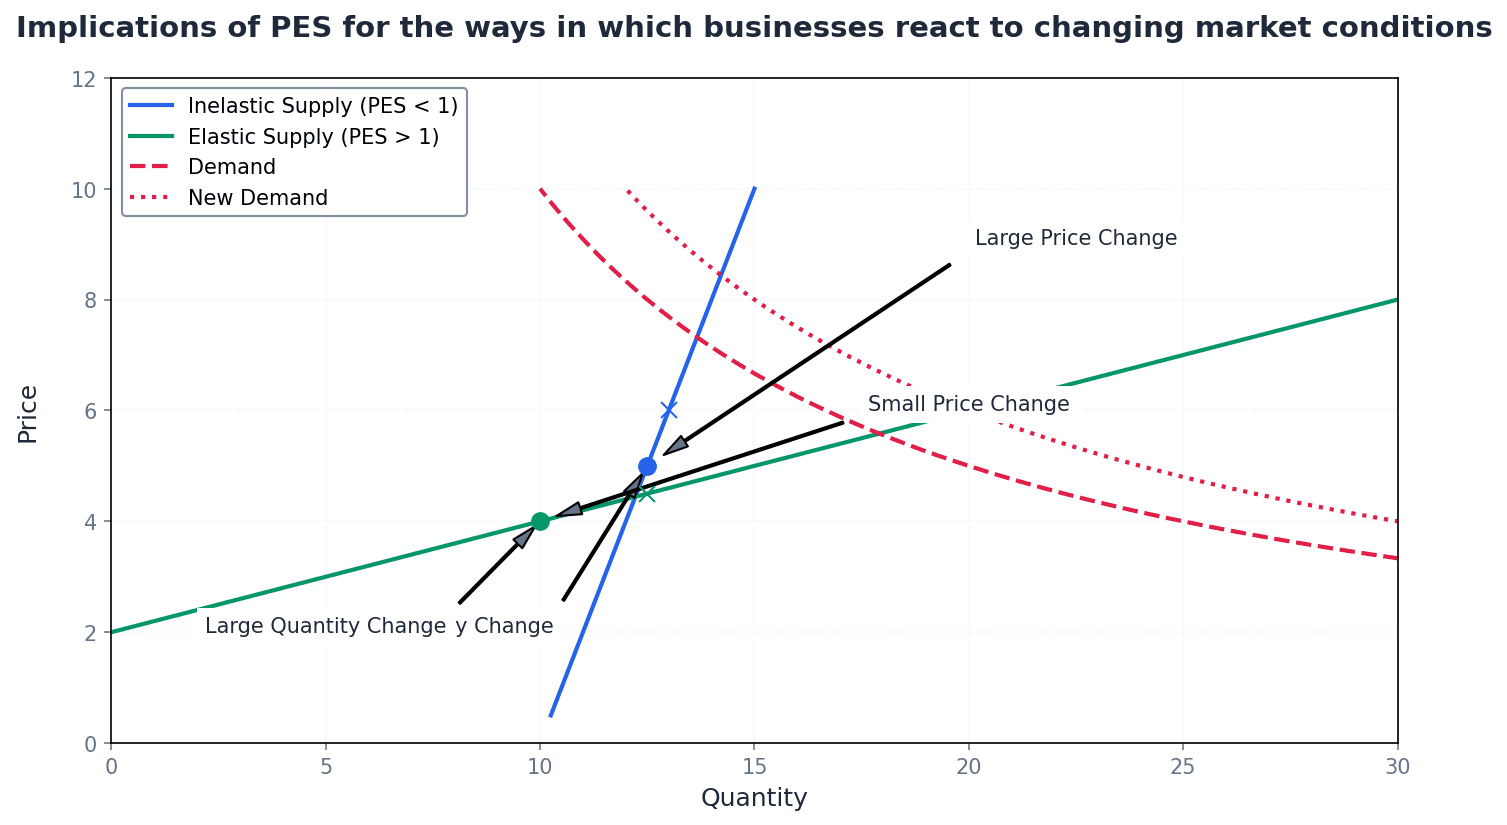
Always start by defining PES and stating the formula to gain initial marks.
Use diagrams to support your explanation: a steep curve for inelastic supply and a shallow curve for elastic supply. Label axes correctly.
Advantages & Disadvantages
High Price Elasticity of Supply (PES > 1)
Low Price Elasticity of Supply (PES < 1)
Evaluation Starters
Essay Structure Guide
Introduction
Begin by defining Price Elasticity of Supply (PES) and stating its formula. Briefly explain what PES measures and why it is an important concept for understanding market dynamics. Outline the key factors that will be discussed in the essay.
Conclusion
Summarise the main arguments regarding the definition, calculation, factors, and implications of PES. Reiterate the importance of understanding PES for businesses and policymakers in responding to market changes. Offer a final thought on the dynamic nature of supply elasticity.
This chapter explores how demand and supply interact to determine market equilibrium and disequilibrium, driven by non-price factors. It also details relationships between markets and analyses the crucial functions of price in resource allocation, including rationing, signalling, and providing incentives.
Equilibrium — A market is in equilibrium when the quantity supplied equals the quantity demanded, representing a balanced situation with no tendency to change, ceteris paribus.
At equilibrium, the plans of consumers (demand) match the plans of suppliers (supply), meaning both parties are satisfied with the current price and quantity. The price mechanism ensures the market 'clears', meaning there is no excess supply or demand. Imagine a tug-of-war where both teams are pulling with equal force; the rope is still, representing equilibrium.
When asked to 'explain equilibrium', ensure you mention both quantity demanded and quantity supplied being equal, and the absence of a tendency to change, often using a diagram to illustrate.
Students often think equilibrium is a static state that never changes, but actually markets are dynamic and constantly adjust towards equilibrium after disturbances.
Equilibrium price — The equilibrium price is the price at which the quantity demanded equals the quantity supplied in a market.
At this price, there is no pressure for the price to change, as the market 'clears' with no excess supply or demand. It is determined by the intersection of the market demand and supply curves. It's like the 'just right' temperature for a room where everyone feels comfortable – not too hot, not too cold.
Always label the equilibrium price clearly on the vertical axis of your demand and supply diagrams.
Equilibrium quantity — The equilibrium quantity is the quantity of a good or service that is both demanded and supplied at the equilibrium price.
At this quantity, the market is cleared, meaning all goods supplied at the equilibrium price are bought, and all demand at that price is met. It is determined by the intersection of the market demand and supply curves. It's the exact number of sandwiches a shop sells when the price is set so that no sandwiches are left over and no customers leave disappointed due to shortages.
Always label the equilibrium quantity clearly on the horizontal axis of your demand and supply diagrams.
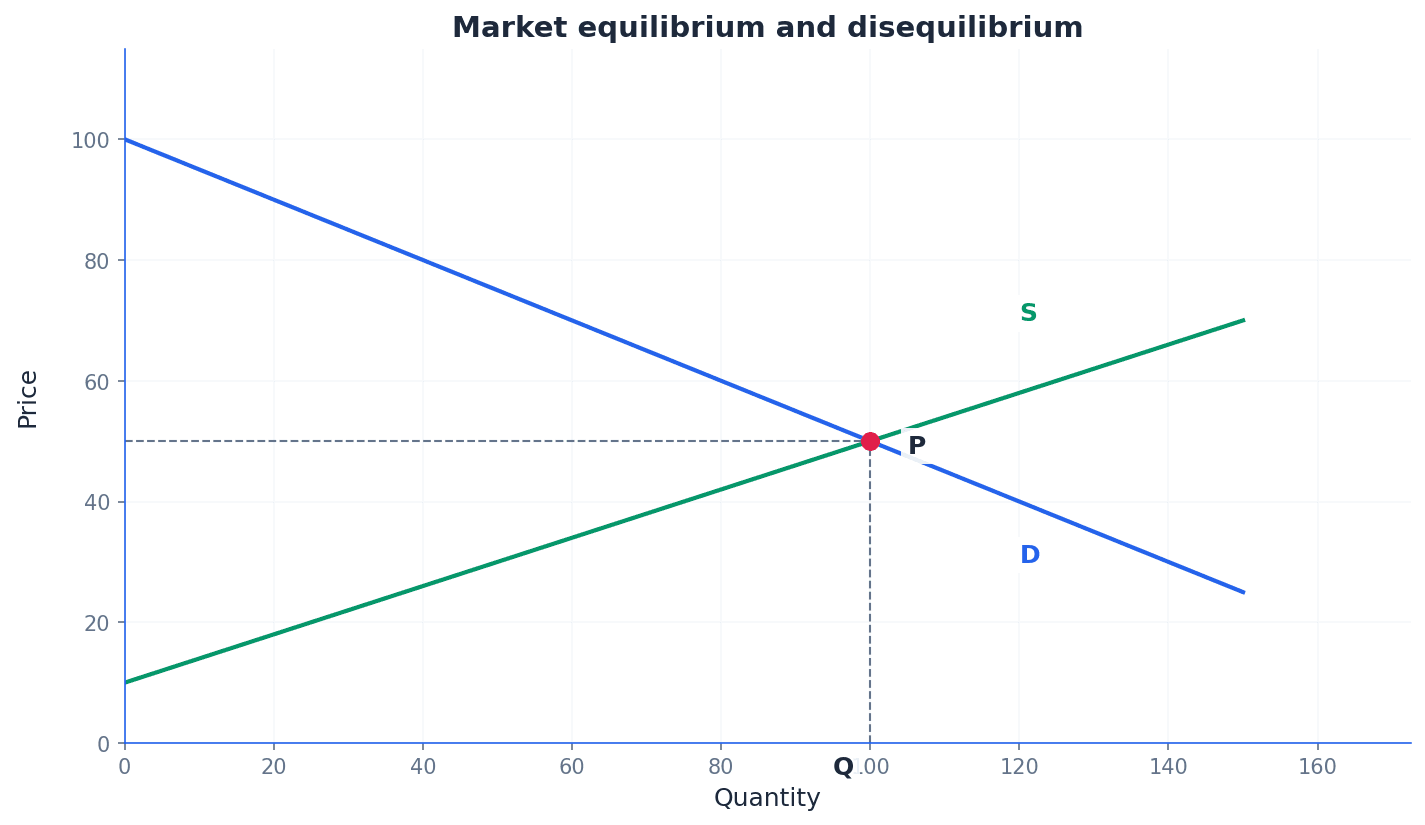
Disequilibrium — Disequilibrium is an imbalance in a market where quantity supplied and quantity demanded are not equal, leading to a tendency for change.
This occurs when the market price is either too high (leading to excess supply) or too low (leading to excess demand). The market mechanism will then adjust prices and quantities until equilibrium is restored. If the tug-of-war teams are not pulling with equal force, one team will be pulled forward, indicating an imbalance or disequilibrium.
When analysing disequilibrium, clearly state whether it's excess supply or demand, and explain the specific market forces (e.g., firms cutting prices for excess supply) that drive the market back to equilibrium.
Excess supply — Excess supply occurs when the quantity supplied is greater than the quantity demanded at a given price, indicating the clearing price is too high.
This situation leads to unsold stocks for producers. To clear these stocks, suppliers will reduce prices, which in turn encourages more consumers to buy and reduces the quantity supplied, moving the market towards equilibrium. A baker makes too many loaves of bread for the day; the unsold loaves are excess supply.
Excess demand — Excess demand occurs when the quantity demanded is greater than the quantity supplied at a given price, indicating the clearing price is too low.
This situation leads to shortages and unmet orders. Suppliers will recognise this opportunity to increase prices, which discourages some consumers and encourages suppliers to increase quantity supplied, moving the market towards equilibrium. A popular concert has more people wanting tickets than available seats; the extra people wanting tickets represent excess demand.
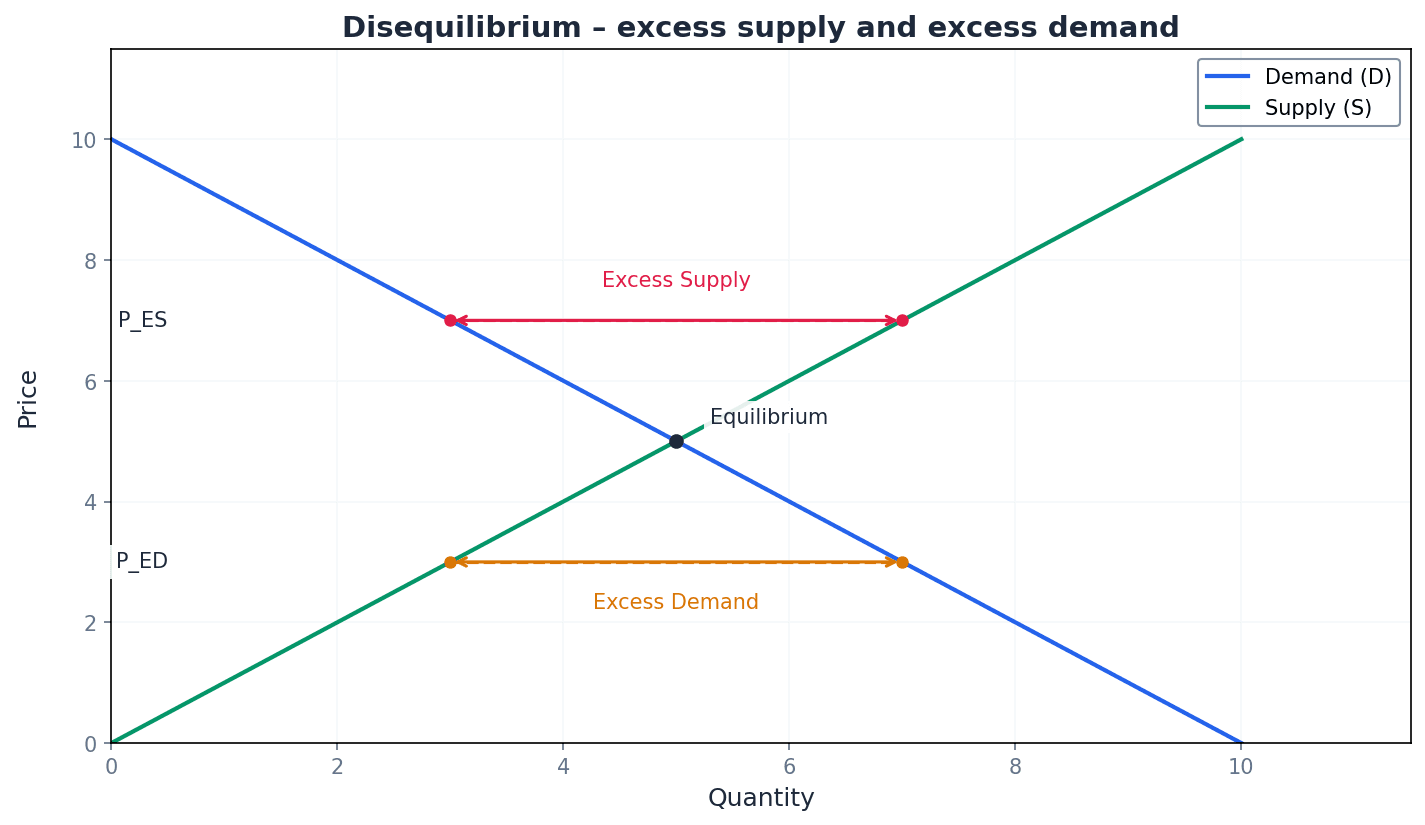
Market equilibrium is dynamic, constantly adjusting to changes in non-price factors that cause shifts in the demand or supply curves. A shift in a curve leads to a new equilibrium price and quantity. It is crucial to distinguish between a 'shift' of a curve, caused by non-price factors, and a 'movement' along a curve, caused by a change in the good's own price.
Students often confuse a 'shift' in a demand or supply curve with a 'movement' along the curve. A shift is due to non-price factors, while a movement is due to a change in price.
The market demand curve shifts due to changes in non-price factors such as income, the price and availability of related products, and fashion, taste, and attitudes. An increase in demand shifts the curve to the right, leading to a higher equilibrium price and quantity, while a decrease shifts it to the left, resulting in a lower equilibrium price and quantity.
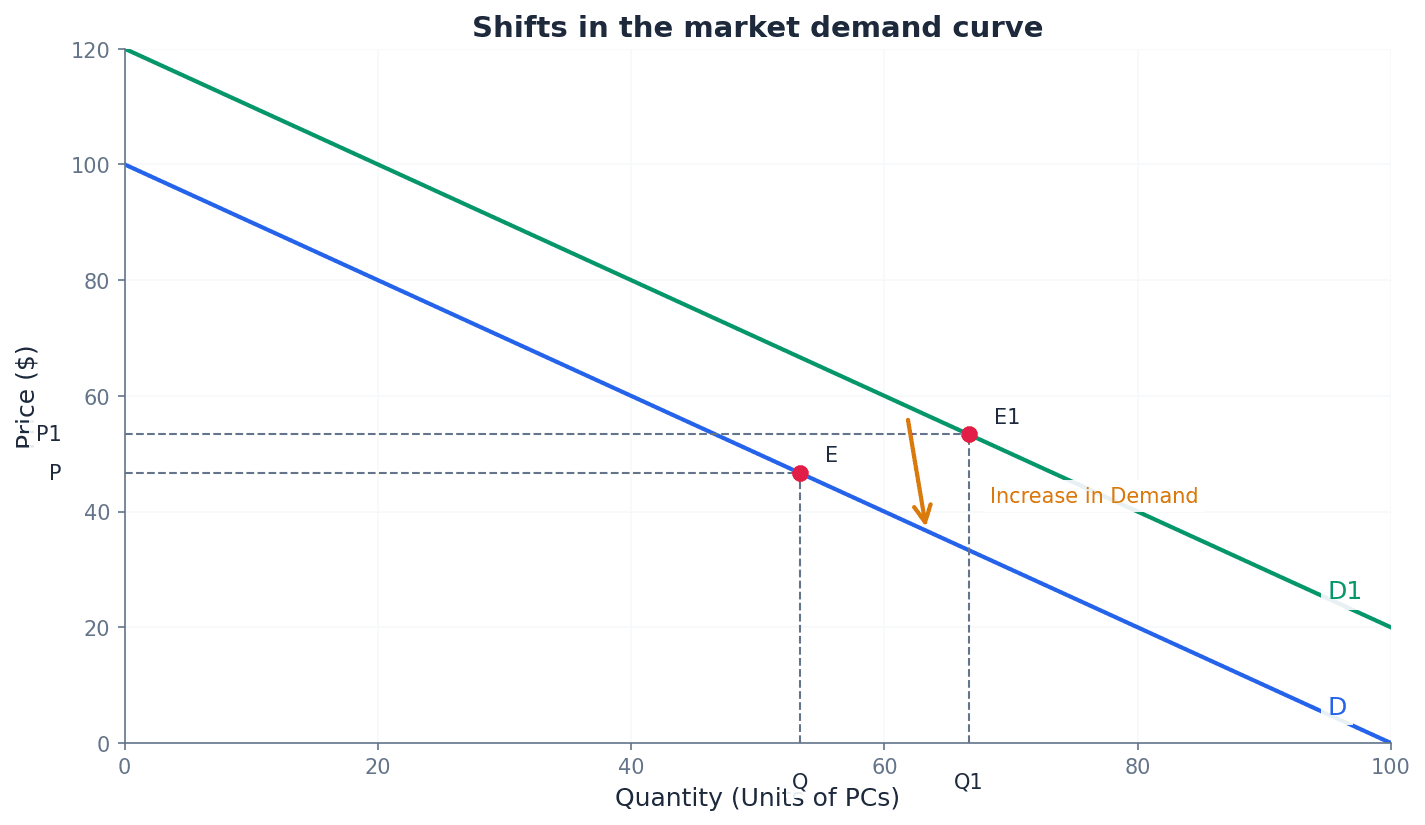
Normal goods — Normal goods are products for which demand increases as a purchaser's income increases, and decreases as income falls.
Most goods and services fall into this category. An increase in income generally leads to a rightward shift in the demand curve for normal goods, assuming other factors remain constant. If you get a raise at work, you might buy more restaurant meals or better quality clothes; these are normal goods.
Inferior goods — Inferior goods are products for which demand decreases as a purchaser's income increases, and increases as income falls.
Consumers tend to switch from inferior goods to higher-quality or more expensive substitutes when their income rises. An increase in income leads to a leftward shift in the demand curve for inferior goods. If your income increases, you might stop buying instant noodles and instead buy fresh pasta; instant noodles would be an inferior good.
The market supply curve shifts due to changes in non-price factors affecting production, such as costs associated with supply, changes in the prices of other products, the size and nature of the industry, and government policy. An increase in supply shifts the curve to the right, leading to a lower equilibrium price and higher quantity, while a decrease shifts it to the left, resulting in a higher equilibrium price and lower quantity.
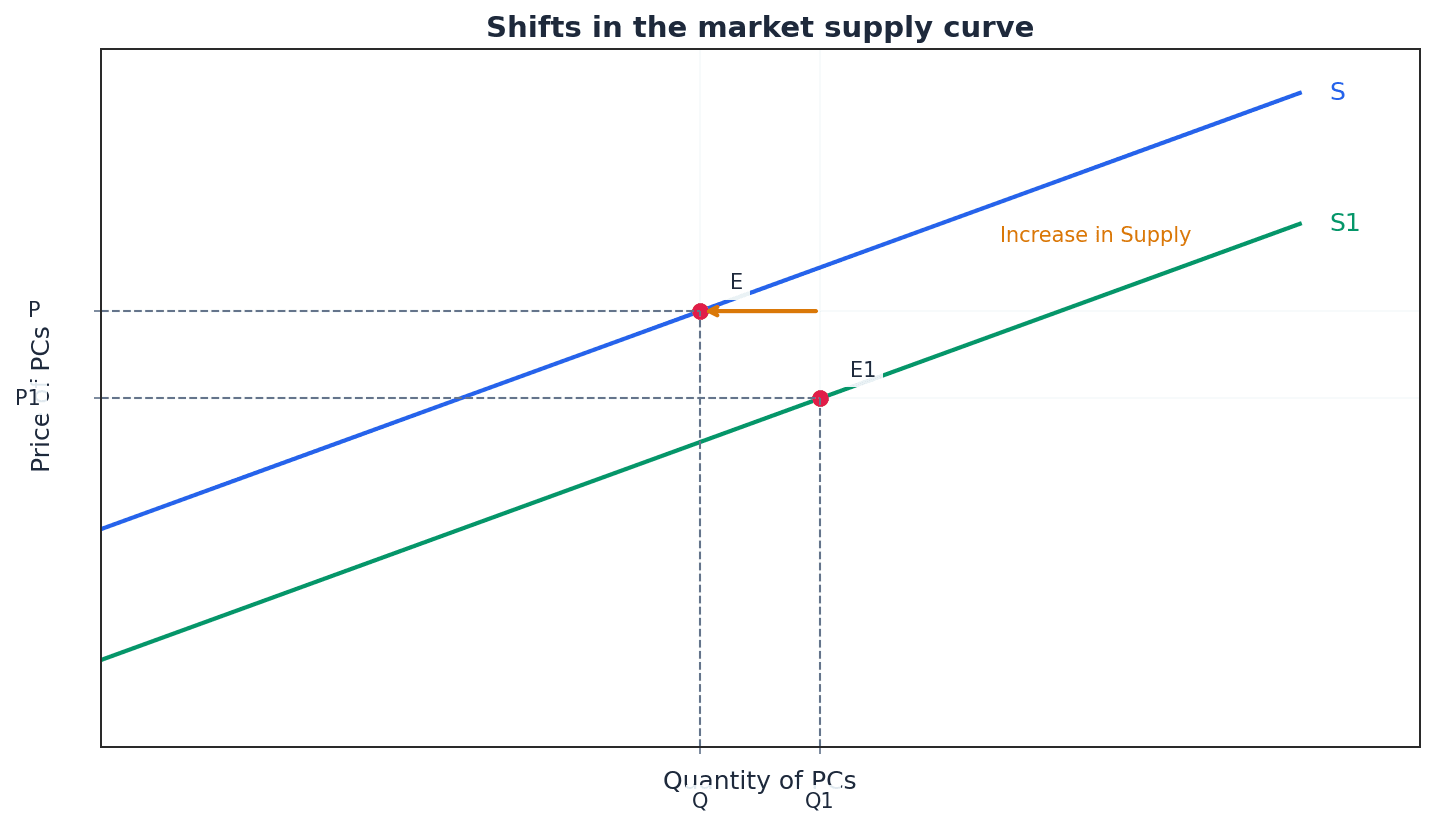
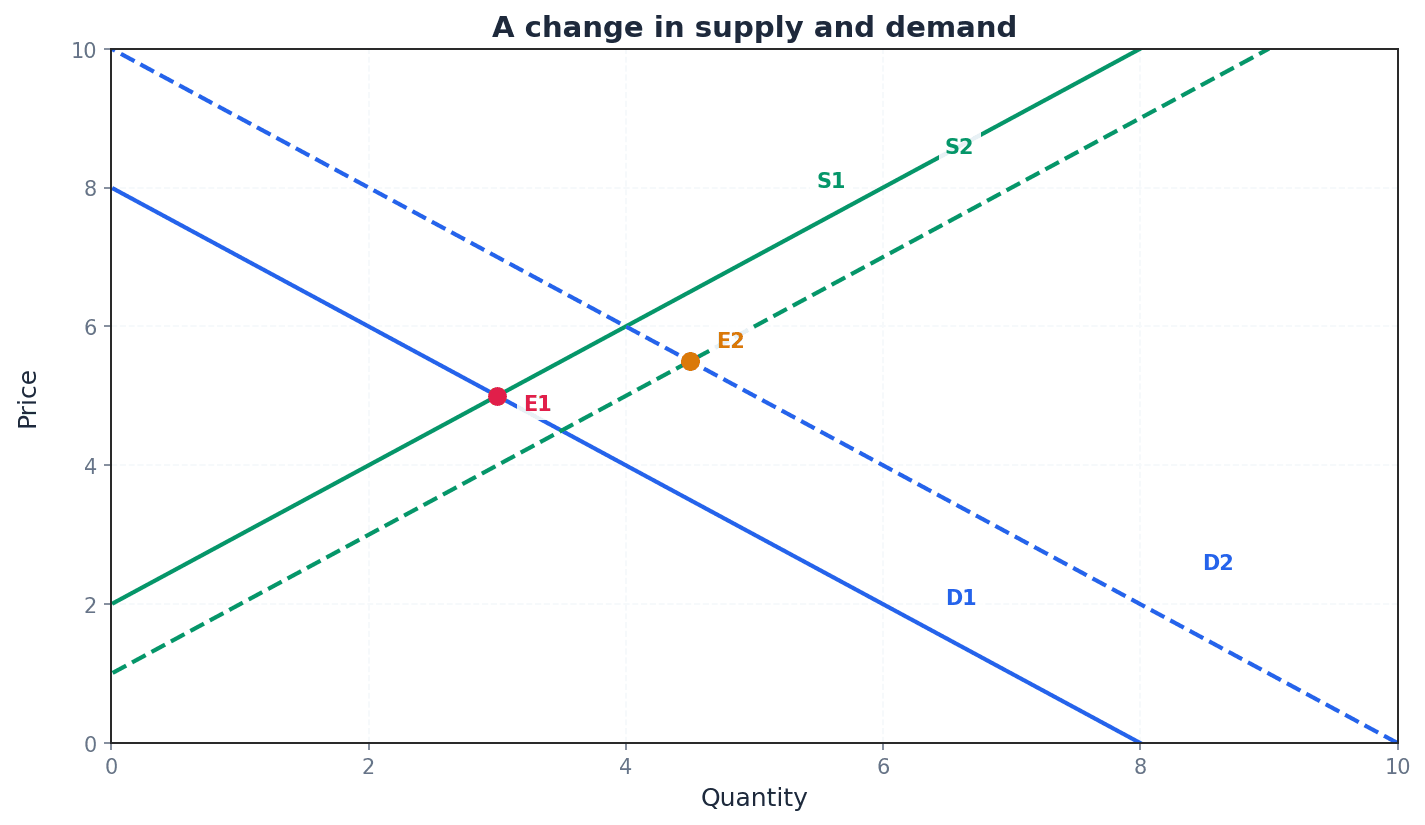
Markets are interconnected, and a change in one market can have significant effects on others. Understanding these relationships is crucial for comprehensive economic analysis. These relationships include alternative demand (substitutes), joint demand (complements), derived demand, and joint supply.
Substitute products — Substitute products are alternative goods that can satisfy the same want or need, so a change in the price of one affects the demand for the other.
If the price of one substitute rises, consumers will switch to the relatively cheaper alternative, causing an increase in demand for the substitute. Conversely, a fall in price of one will decrease demand for its substitute. If the price of Coca-Cola goes up, some people might buy more Pepsi instead; Coca-Cola and Pepsi are substitutes.
Alternative demand — Alternative demand refers to the relationship between substitute goods, where a rise in the price of one product leads to an increase in demand for its alternative.
This occurs because consumers switch their purchasing power to the relatively cheaper alternative when the price of their preferred good increases. It results in a rightward shift of the demand curve for the alternative good. If the price of butter increases, consumers might buy more margarine, as margarine is an alternative.
Students often confuse substitutes with complements, but actually substitutes are consumed instead of each other, while complements are consumed together.
Complements — Complements are products that are consumed together, so a change in the price of one affects the demand for the other.
A rise in the price of one product will reduce the quantity demanded for it and its associated complement. Conversely, a fall in the price of one will lead to an increase in demand for its complement. If the price of coffee beans falls, people might buy more coffee machines; coffee beans and coffee machines are complements.
Joint demand — Joint demand refers to the relationship between complementary goods, meaning they are consumed together.
An increase in the supply of one good, leading to a fall in its price, will prompt an increase in demand for its complement. This is because the lower price makes the combined consumption more attractive. If the price of cinema tickets falls, people might buy more popcorn, as they are often consumed together.
Students often confuse substitute products with complementary products, leading to incorrect analysis of demand shifts.
Derived demand — Derived demand applies where something is required because it is needed for the production of other goods and services.
The demand for a factor of production (like labour or raw materials) is derived from the demand for the final product it helps to create. If demand for the final product increases, demand for the factor of production will also increase. The demand for bricks is derived from the demand for new houses; if more houses are wanted, more bricks are needed.
Students often think derived demand is direct demand, but actually it's indirect, stemming from the demand for another good.
Joint supply — Joint supply occurs when two goods are produced together from a single productive process, but for different purposes.
An increase in the demand for one of the jointly supplied products will lead to an increase in its supply, which in turn automatically increases the supply of the other jointly supplied product, often leading to a fall in its price. When sheep are raised for wool, meat is also produced; wool and meat are in joint supply.
Students often think joint supply is the same as joint demand, but they refer to different relationships in production and consumption, respectively.
In a market economy, price plays a crucial role in allocating scarce resources efficiently. The price mechanism performs three key functions: rationing, signalling, and providing incentives. These functions ensure that resources are directed to where they are most valued by consumers and where producers can earn profits.
Rationing — Rationing is a function of the price system where high prices limit the quantity demanded of a product, ensuring it is in line with the quantity supplied to the market.
In a market economy, price acts as an automatic mechanism to allocate scarce resources. Products with high prices, often exclusive ones, are rationed to those willing and able to pay, thus limiting demand. If there's a limited edition pair of sneakers, the very high price rations them to only a few buyers.
When discussing rationing, link it directly to scarcity and how price serves to allocate limited goods to those with the highest willingness and ability to pay.
Signalling — Signalling is a function of price where changes in price communicate information to both producers and consumers about market conditions.
A rise in price signals to producers that demand has increased and they should produce more, while a fall in price signals that demand has decreased and less should be produced. This helps guide resource allocation. Traffic lights signal to drivers when to stop and go; similarly, prices signal to producers when to increase or decrease production.
Transmission of preferences — Transmission of preferences is a function of the price mechanism that allows the wants of consumers to be made known to producers.
Through their purchasing decisions (or lack thereof), consumers 'vote' with their money, and these signals are transmitted via prices to producers. If a product is not liked or is too expensive, producers receive this message and can react by improving the product or reducing its price. It's like consumers sending a direct message to producers through their shopping carts: 'I like this, make more!' or 'I don't like this, change it!'
Emphasise that the transmission of preferences function highlights consumer sovereignty, where consumer choices, expressed through prices, direct resource allocation.
Incentive — Incentive is a function of price that motivates buyers and sellers to act in certain ways.
Low prices incentivise consumers to buy more, while high prices incentivise suppliers to produce more for the market. Conversely, high prices discourage consumers, and low prices discourage suppliers, potentially leading them to exit a market. A sale price is an incentive for you to buy a product, just as a high profit margin is an incentive for a company to produce more of that product.
When discussing incentives, clearly explain how price changes affect the willingness of both consumers (to buy) and producers (to supply).
For questions on market changes, follow a clear structure: 1. Identify the initial equilibrium. 2. State the factor causing a shift and which curve moves. 3. Describe the resulting disequilibrium. 4. Explain the movement to the new equilibrium.
When analysing a market, always consider the knock-on effects on related markets (substitutes, complements, derived demand, etc.) if the question requires it.
Advantages & Disadvantages
The Price Mechanism in Resource Allocation
Market Equilibrium and Disequilibrium
Evaluation Starters
Essay Structure Guide
Introduction
Begin by defining market equilibrium and disequilibrium, and briefly state the role of demand and supply in determining them. Outline the key functions of price in resource allocation that will be discussed.
Conclusion
Summarise the main arguments, reiterating how demand and supply interact to determine market outcomes and the multifaceted role of price. Conclude with a final evaluative statement on the overall efficiency and challenges of the market mechanism in resource allocation.
This chapter introduces consumer and producer surplus, which quantify the net benefits to consumers and producers in a market. It explains how these surpluses are determined by market prices and individual willingness to pay or accept, and how they change with price variations and elasticity. The sum of these surpluses represents the total net benefit to society from market operations.
Consumer surplus — Consumer surplus is the difference between the price a consumer is willing to pay for a product and its market price.
This concept highlights that some consumers value a product more than its market price, leading to a 'surplus' benefit. For example, if you'd happily pay 4, your consumer surplus is $6, representing the extra satisfaction you get beyond what you paid.
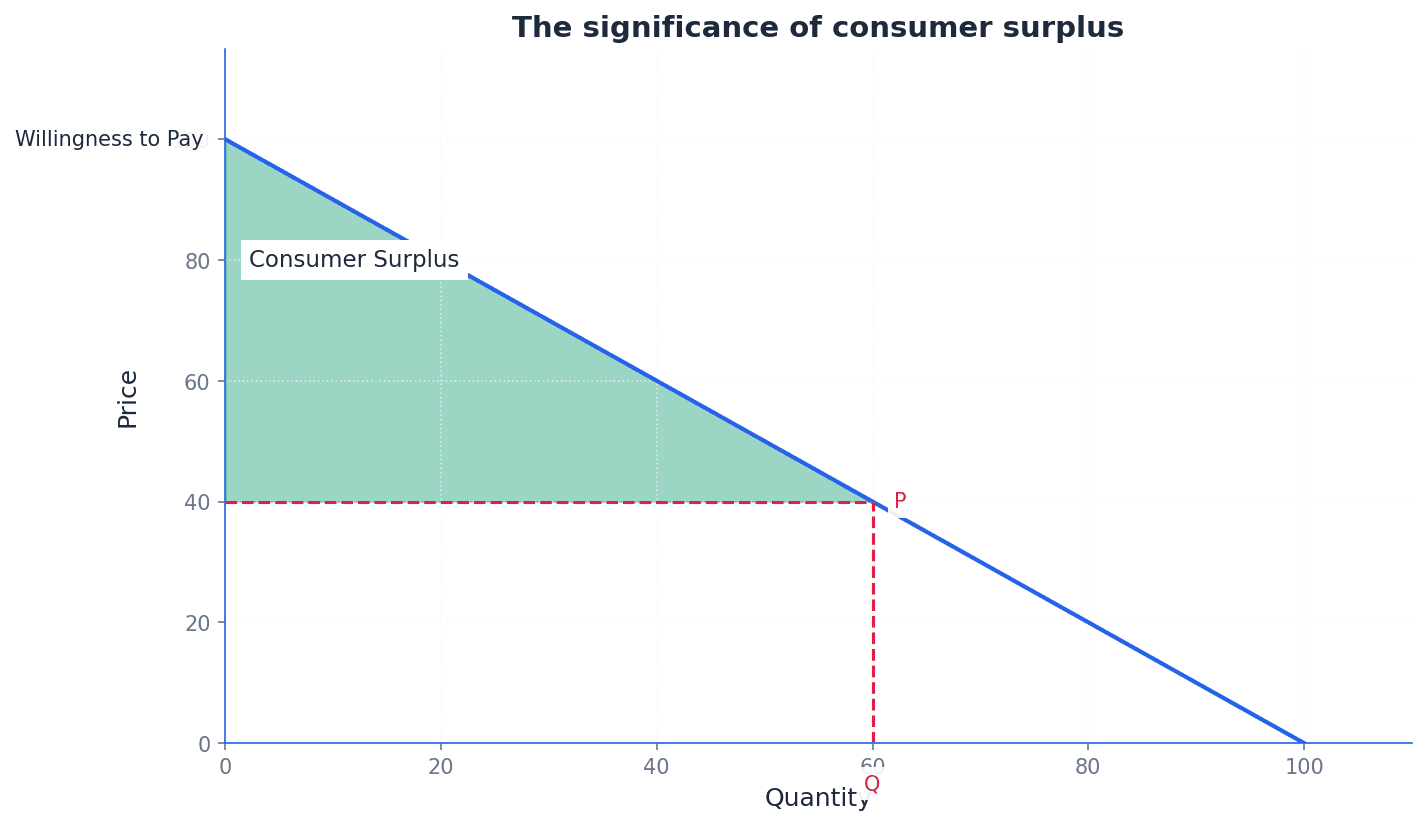
Students often think consumer surplus is simply the money saved, but it is actually the difference between the maximum price they would have paid and the actual market price. It is also not the same as total satisfaction or utility, but rather the net monetary benefit.
When asked to explain consumer surplus, define it clearly and use a diagram to illustrate the area. For analysis questions, discuss how changes in price or elasticity affect its magnitude.
Producer surplus — Producer surplus is the additional revenue to the airline over and above that for the base line price.
This occurs because some producers are willing to supply a product at a lower price than the market price, gaining extra revenue. For instance, if a farmer is willing to sell wheat for 8, the $3 difference is their producer surplus, representing extra profit.
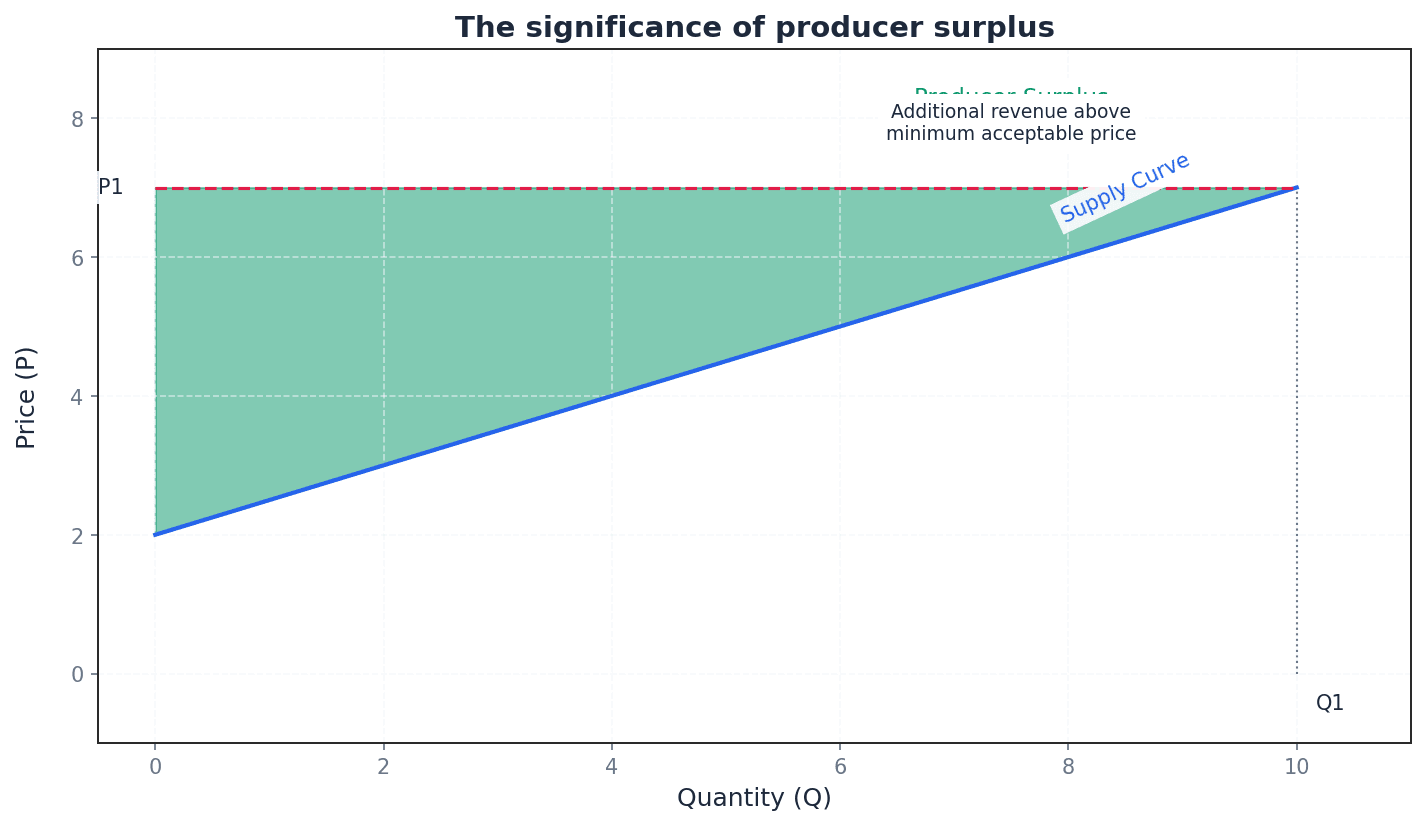
Students often think producer surplus is the same as profit, but it is actually the difference between the market price and the minimum price a producer is willing to accept, before all costs are deducted. Students also often find it difficult to distinguish between consumer surplus and producer surplus, especially when interpreting diagrams.
Define producer surplus precisely and use a supply and demand diagram to show it as the area above the supply curve and below the market price. Discuss how price changes and price elasticity of supply impact its size.
The sum of consumer and producer surplus represents the total net benefit to society, also known as social surplus, derived from a market's operations. This combined surplus is a measure of the overall welfare generated by the market. An efficient market maximises this total net benefit.
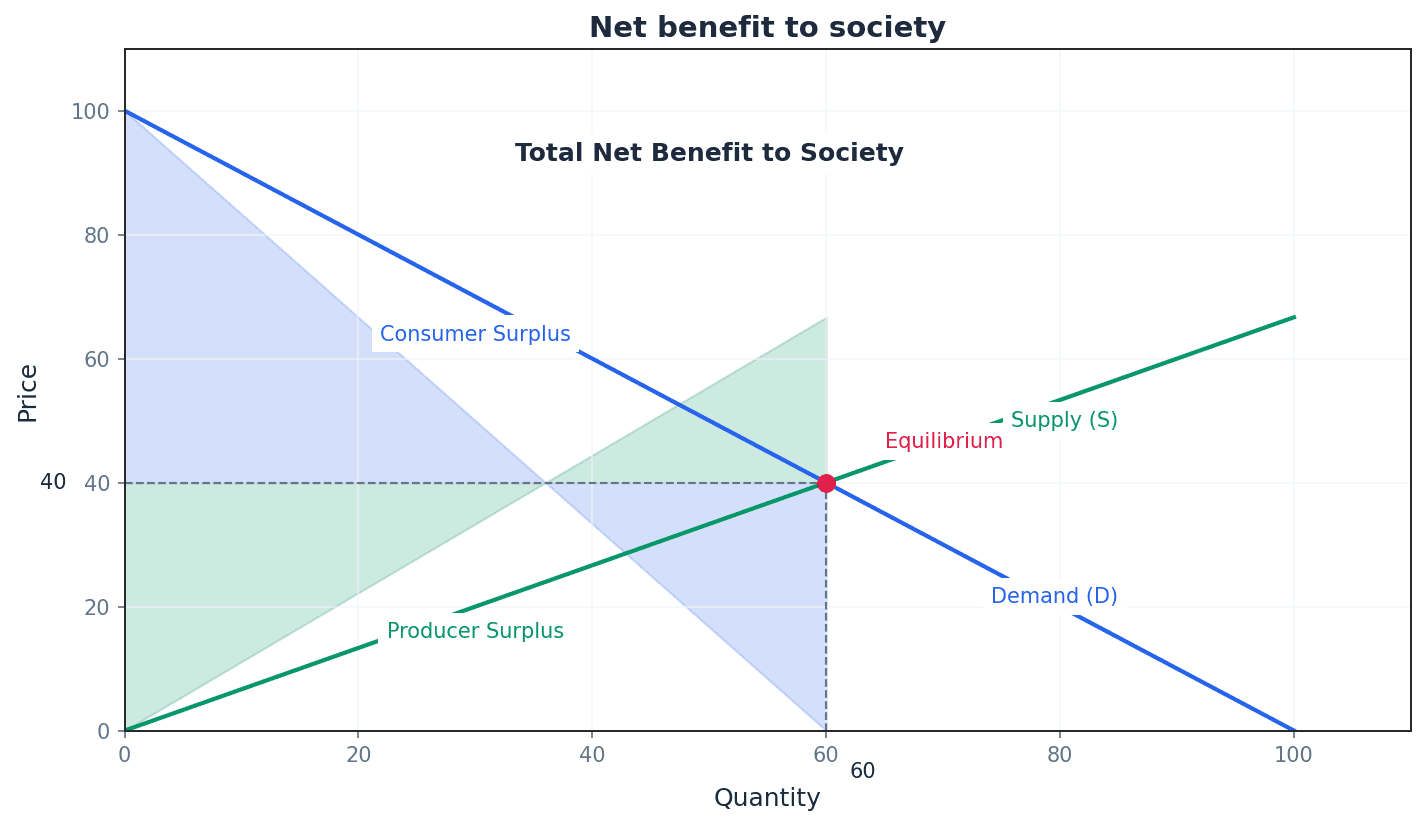
When market prices fall, consumer surplus increases. This occurs because existing consumers pay less for the product, and new consumers who were previously unwilling to pay the higher price now enter the market. Conversely, a price increase will lead to a decrease in consumer surplus.
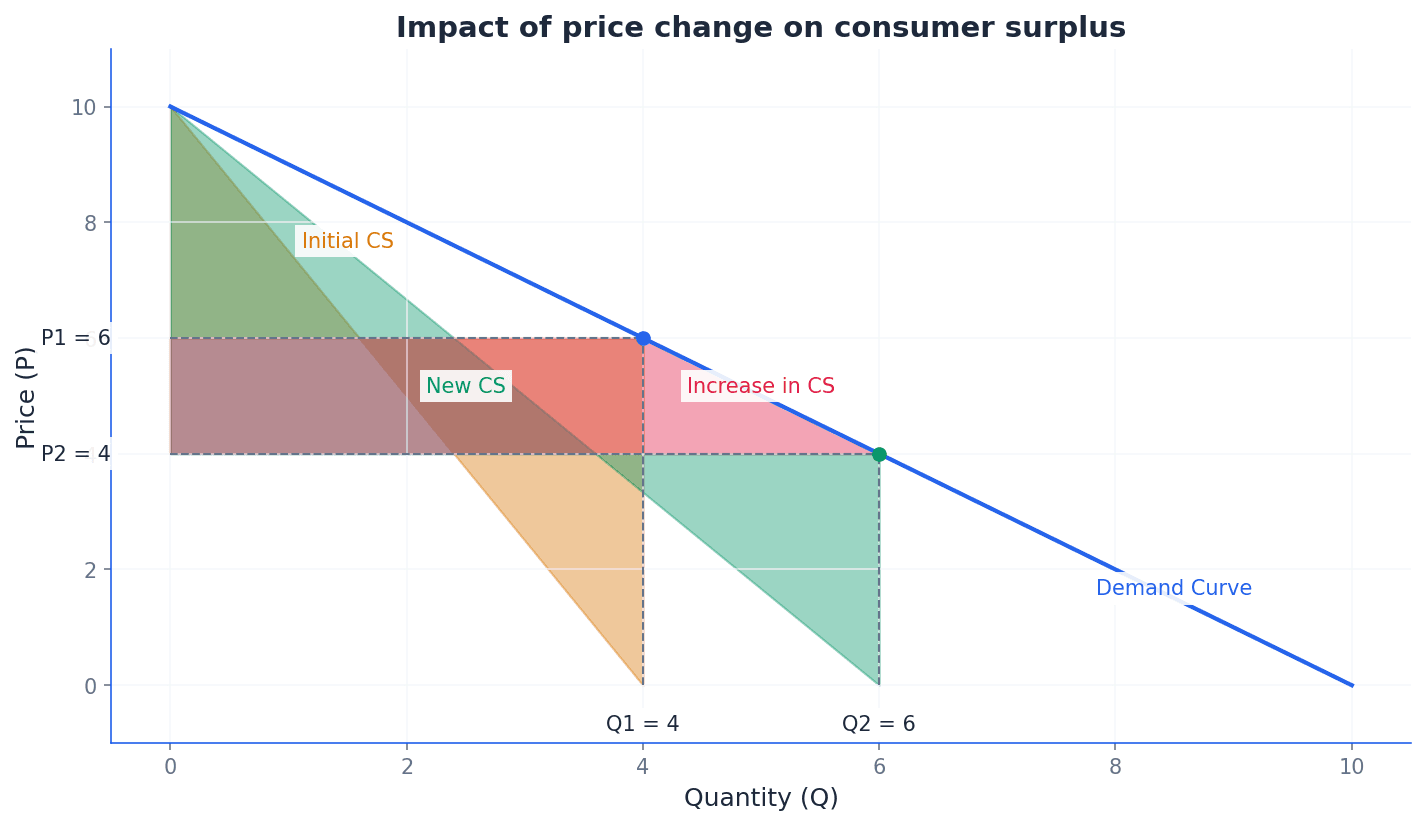
A decrease in market price generally leads to a reduction in producer surplus. Producers receive less revenue for their goods, and some producers who were only willing to supply at the higher price may exit the market. Conversely, an increase in price will expand producer surplus.
The magnitude of changes in consumer and producer surplus in response to price variations is significantly influenced by the price elasticity of demand and supply. For instance, with price inelastic demand, a fall in price leads to a proportionally smaller increase in quantity demanded, affecting the change in consumer surplus. Similarly, the elasticity of supply determines how much producer surplus changes.
Students might not fully grasp how price elasticity of demand and supply influences the magnitude of changes in consumer and producer surplus. Remember that more inelastic demand/supply leads to a larger potential surplus at any given price and a proportionally smaller change in quantity for a given price change.
Always draw a large, clearly labelled supply and demand diagram. Shade and label the specific areas for Consumer Surplus (CS) and Producer Surplus (PS). When analysing a price change, show the 'before' and 'after' surplus areas on your diagram and explain the change for BOTH consumers and producers.
If a question involves elasticity, explicitly link it to the size of the surplus. For example, 'Because demand is price inelastic, the fall in price leads to a proportionally smaller increase in quantity, affecting the change in surplus.'
Advantages & Disadvantages
Price decrease and consumer surplus
Price increase and producer surplus
Evaluation Starters
Essay Structure Guide
Introduction
Begin by defining consumer surplus and producer surplus, explaining their significance as measures of net benefit to consumers and producers respectively. State the overall argument or the main factors you will discuss regarding changes in these surpluses.
Conclusion
Summarise the main points regarding the meaning, significance, and causes of changes in consumer and producer surplus. Reiterate the importance of elasticity in determining the magnitude of these changes and offer a final evaluative thought on their role in understanding market outcomes and welfare.
This chapter explores the reasons for government intervention in markets, primarily focusing on market failure. It details how governments address the non-provision of public goods, the overconsumption of demerit goods, and the underconsumption of merit goods, often due to information failure. Additionally, it covers how governments control prices through maximum and minimum price policies to protect consumers and producers.
Market failure — Market failure is an inefficient allocation of goods and services in the market where the free market mechanism does not make the best use of scarce resources.
This occurs when the price mechanism fails to account for all costs and benefits of production or consumption, often due to inefficient production or consumers lacking perfect information. It necessitates government intervention to correct the misallocation. Imagine a group project where everyone only does the parts they enjoy, leading to some crucial parts being left undone or poorly done, and the overall project failing to meet its potential. This is like market failure, where individual self-interest doesn't lead to the best collective outcome.
Students often think market failure means the market completely collapses, but actually it means the market allocates resources inefficiently, not necessarily that it ceases to function.
When asked to explain market failure, ensure you link it to the inefficient allocation of resources and mention specific causes like lack of public goods, information failure, or externalities.
Public goods — Public goods are goods that are consumed collectively and whose use by one person does not make them less available to others, making it difficult to charge directly for their consumption.
They possess characteristics of non-rivalry and non-excludability, leading to the free rider problem where individuals can benefit without contributing to the cost. Consequently, the private sector has no incentive to provide them, requiring government funding through taxation. Streetlights are a public good; once installed, everyone on the street benefits from the light (non-rivalrous), and you can't stop someone from using the light even if they don't pay for it (non-excludable).
Students often think any good provided by the government is a public good, but actually public goods are defined by their non-rivalrous and non-excludable nature, not just who provides them.
When defining public goods, always mention both non-rivalry and non-excludability, and explain how these characteristics lead to the free rider problem and non-provision by the private sector.
Free rider problem — The free rider problem means that people can enjoy the use of a public good without contributing towards its cost.
This problem arises because public goods are non-excludable, meaning it's impossible to prevent individuals from consuming the good even if they haven't paid for it. This lack of incentive to pay leads to under-provision or non-provision by the private sector. If a neighbour pays for a security camera that covers the whole street, other neighbours might benefit from increased security without paying, 'free riding' on the first neighbour's expense.
When discussing public goods, explicitly link the free rider problem to the non-excludability characteristic and explain why it discourages private provision.
Public goods, due to their non-rivalrous and non-excludable nature, lead to the free rider problem, where individuals can benefit without paying. This lack of incentive means the private sector will not provide them. Governments intervene by funding public goods through taxation, ensuring their provision for collective consumption, such as street lighting or national defence.
Demerit goods — Demerit goods are ones that are considered undesirable for consumers and that tend to be over provided, therefore over consumed in the free market.
Consumers often lack full information about the true costs or negative consequences of consuming demerit goods, leading to overconsumption. Governments intervene through regulations, taxes, or information campaigns to reduce their consumption. Smoking is a demerit good; individuals might not fully appreciate the long-term health costs, leading to overconsumption, which governments try to curb through warnings and bans.
Students often think demerit goods are simply 'bad' goods, but actually the key is that consumers underestimate their negative effects, leading to overconsumption from a societal perspective.
When analysing demerit goods, focus on the information failure aspect and how it leads to overconsumption, rather than just stating they are 'bad'.
Demerit goods are overconsumed in the free market primarily due to information failure, where consumers do not fully understand the negative consequences of their consumption. Governments intervene to reduce this overconsumption through various strategies, including imposing taxes, implementing regulations, or launching public information campaigns to highlight the true costs.
Merit goods — Merit goods are more beneficial to consumers than they may realise, often due to information failure on the part of consumers.
When left to the private sector, merit goods are underprovided because consumers do not fully appreciate their benefits or cannot afford them. Governments intervene through direct provision, subsidies, or legislation to increase their consumption for societal benefit. Education is a merit good; individuals might not fully grasp its long-term benefits for their career and well-being, or might not be able to afford it, so governments often make it compulsory or provide it free.
Students often think merit goods are simply 'good' goods, but actually the crucial point is that consumers underestimate their benefits, leading to underconsumption from a societal perspective.
When discussing merit goods, highlight information failure and the positive externalities they generate, explaining why private provision leads to underconsumption and why government intervention is justified.
Merit goods are underconsumed in the free market because consumers often suffer from information failure, underestimating their true benefits, or face affordability issues. To correct this, governments intervene to increase their consumption, often through direct provision (like public education or healthcare), subsidies to lower prices, or legislation making consumption compulsory.
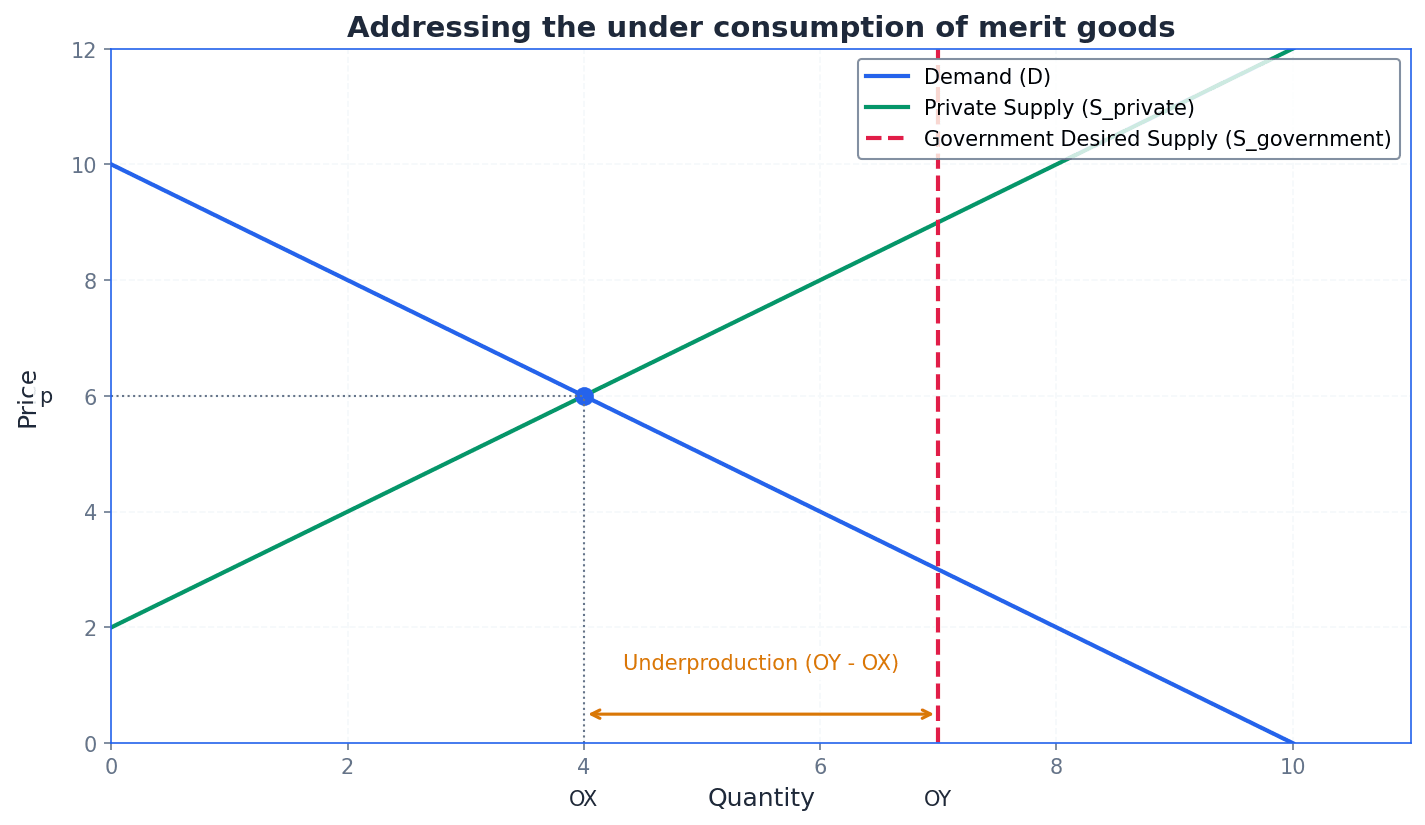
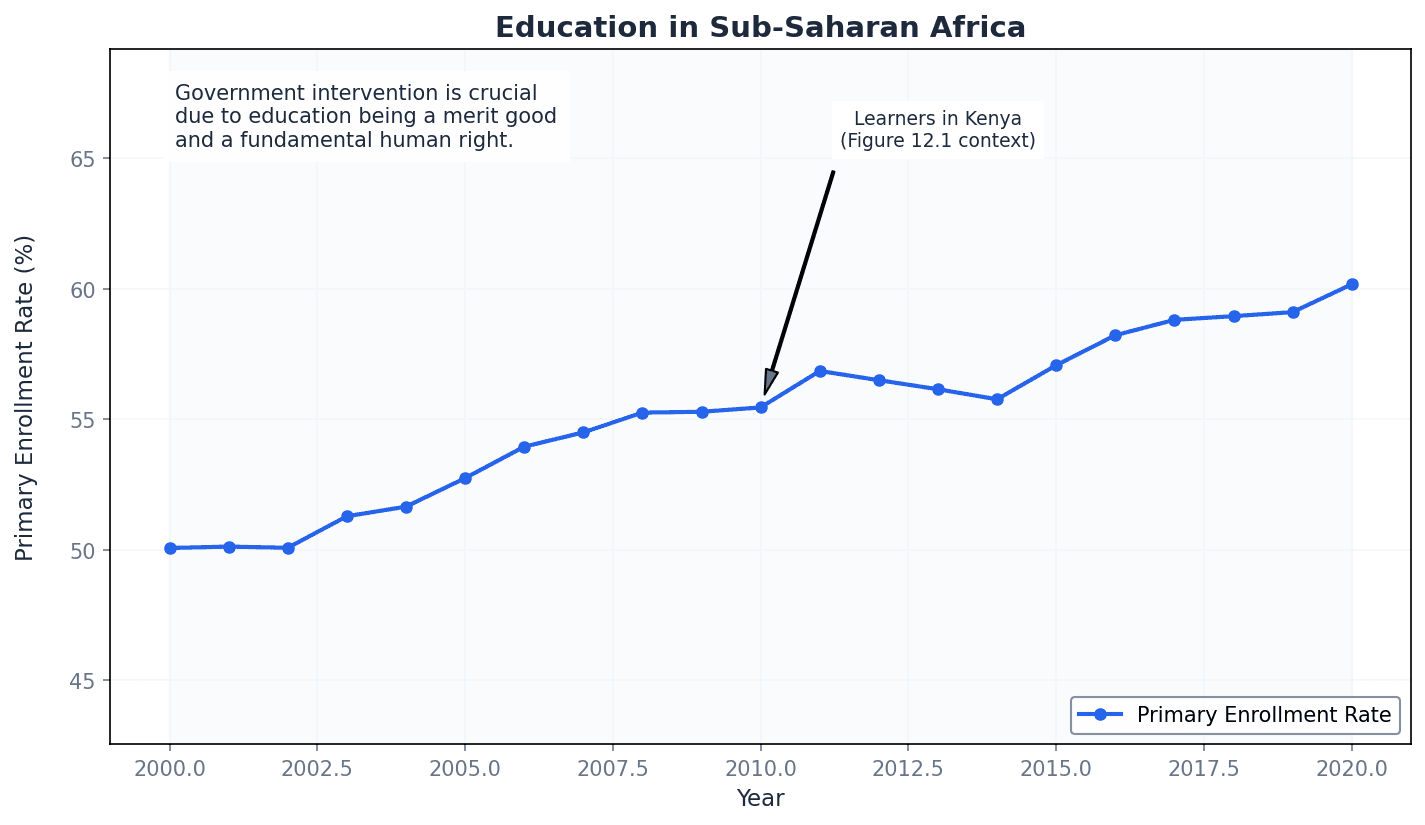
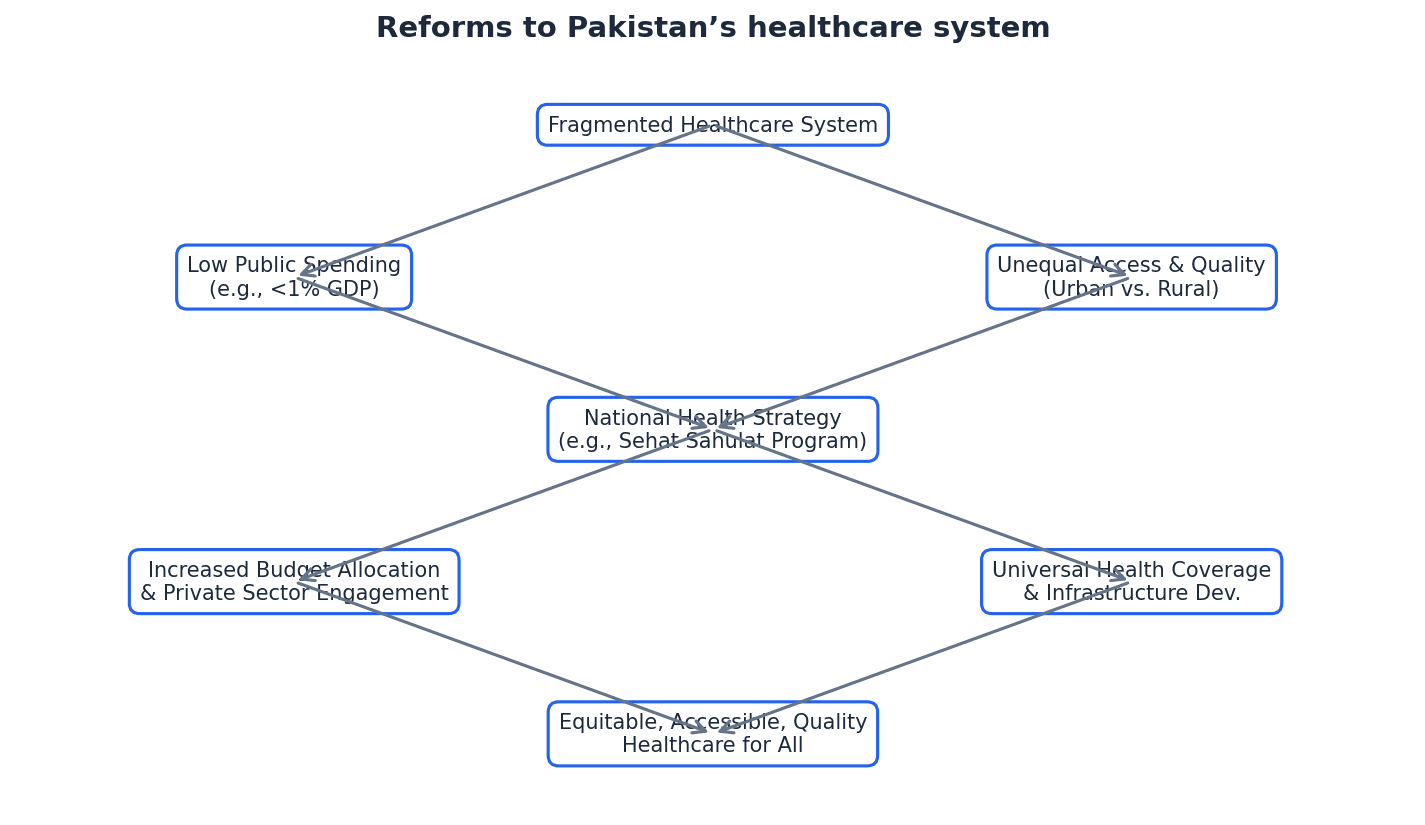
Governments also intervene in markets by controlling prices through maximum and minimum price policies. Maximum prices (price ceilings) are set below the equilibrium to protect consumers from excessively high prices, while minimum prices (price floors) are set above the equilibrium to protect producers from low incomes. These interventions aim to achieve specific social or economic objectives but can lead to shortages or surpluses respectively.
Always start your answer by defining market failure as 'an inefficient allocation of goods and services'.
For questions on price controls, always draw a supply and demand diagram. Label the equilibrium, the price control, and the resulting shortage or surplus.
Structure your analysis: 1. Identify the type of market failure. 2. Explain the reason for it. 3. Describe a relevant government intervention.
Advantages & Disadvantages
Government provision of public goods
Government intervention for demerit goods (e.g., taxes, regulations)
Evaluation Starters
Essay Structure Guide
Introduction
Begin by defining market failure as an inefficient allocation of resources and state that government intervention aims to correct this. Briefly outline the types of market failure and interventions you will discuss.
Conclusion
Summarise the main reasons for government intervention and the types of policies used. Reiterate that while intervention can correct market failures, it is not without its own challenges and potential inefficiencies. Conclude with a balanced judgement on the role of government in markets.
This chapter examines various government interventions in markets, including indirect taxes, subsidies, direct provision, and price controls. It analyses their impact on market prices, quantities, and the distribution of economic burdens and benefits, alongside buffer stock schemes and information provision.
Ad valorem taxes — Taxes that are a proportion or percentage of the price charged by the retailer.
These taxes are included in the final price paid by consumers and are common for goods like VAT or GST. The amount of tax increases as the price of the good increases, similar to a sales tax where the tax amount depends on how expensive the item is.
Specific taxes — Taxes that are a fixed amount per unit purchased.
These taxes are based on a measurable quantity, such as per litre for fuel, and are included in the final price. They cause a parallel shift of the supply curve, much like a fixed charge per text message regardless of its content or length.
Students often confuse specific taxes (a constant monetary amount per unit) with ad valorem taxes (a percentage of the price). Remember that ad valorem taxes are a percentage, while specific taxes are a fixed amount per unit.
When analysing ad valorem taxes, remember that the supply curve will pivot, not shift parallel, as the tax amount changes with price.
When drawing the effect of a specific tax, ensure the supply curve shifts upwards by the exact amount of the tax, indicating a parallel shift.
Indirect taxes, whether specific or ad valorem, increase the cost of production for firms, leading to a reduction in supply. This shifts the supply curve to the left, resulting in a higher equilibrium price and a lower equilibrium quantity in the market. The specific type of tax determines how the supply curve shifts.
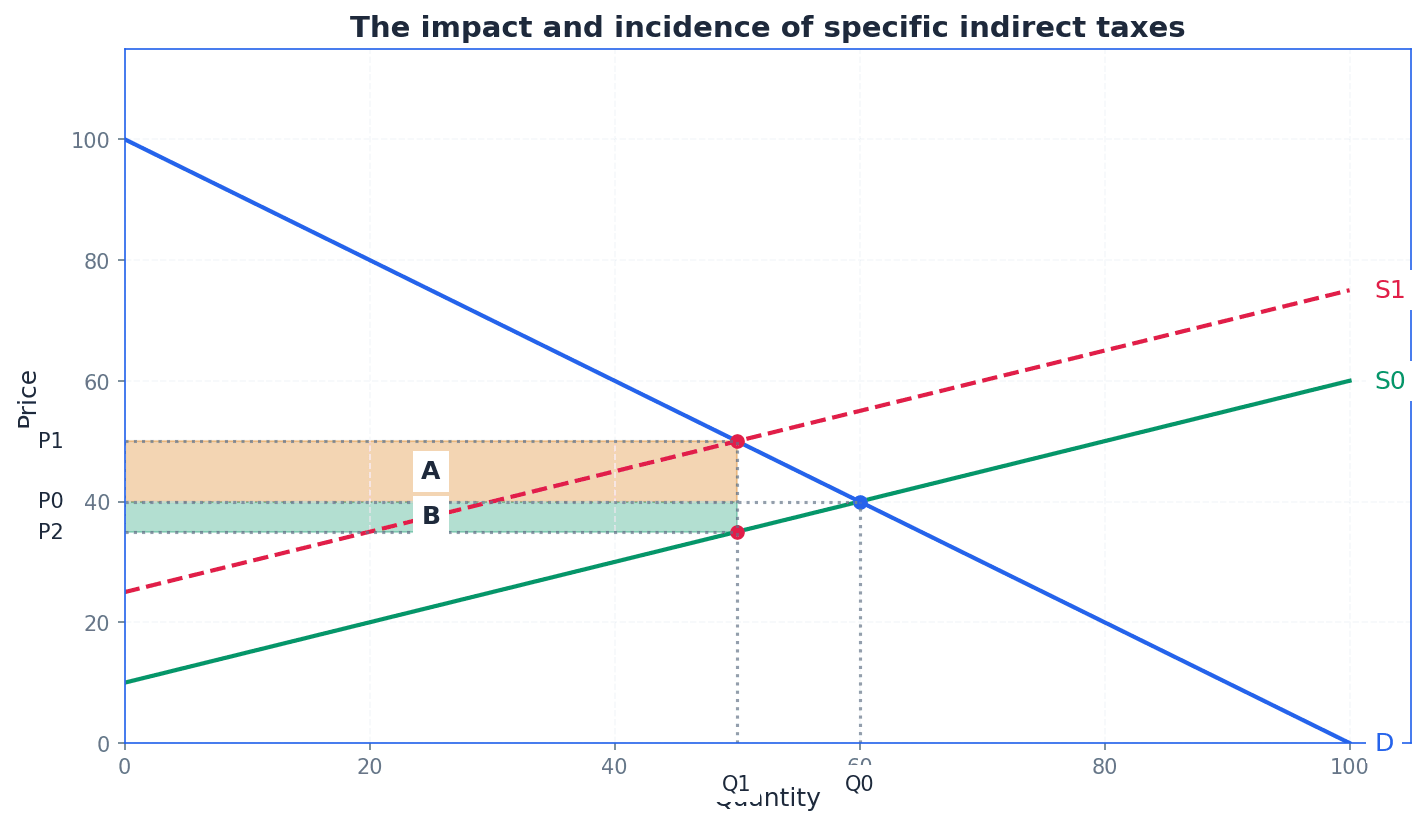
Incidence of an indirect tax — The term used to describe the extent to which the tax burden is borne by the producer, by the consumer or by both.
The distribution of the tax burden depends on the price elasticities of demand and supply. If demand is inelastic, consumers bear more of the burden; if supply is inelastic, producers bear more. This is like two people pushing a heavy box; who feels more strain depends on how firmly each person is planted.
Students often think the party on whom the tax is legally imposed bears the entire burden, but actually the burden is shared between consumers and producers.
When asked to analyse tax incidence, always refer to price elasticity of demand and supply to explain the distribution of the burden.
Subsidies — Direct payments made by governments to the producers of goods and services.
Subsidies aim to reduce market prices, encourage consumption of merit goods, or support producers' incomes. They effectively reduce production costs, shifting the supply curve to the right, much like a coupon given to a store by the government for every item sold, allowing the store to sell at a lower price to customers.
Students often confuse subsidies with taxes, but actually subsidies reduce prices and increase quantity, while taxes increase prices and reduce quantity.
When explaining the effects of a subsidy, clearly state that it shifts the supply curve to the right, leading to a lower equilibrium price and higher equilibrium quantity.
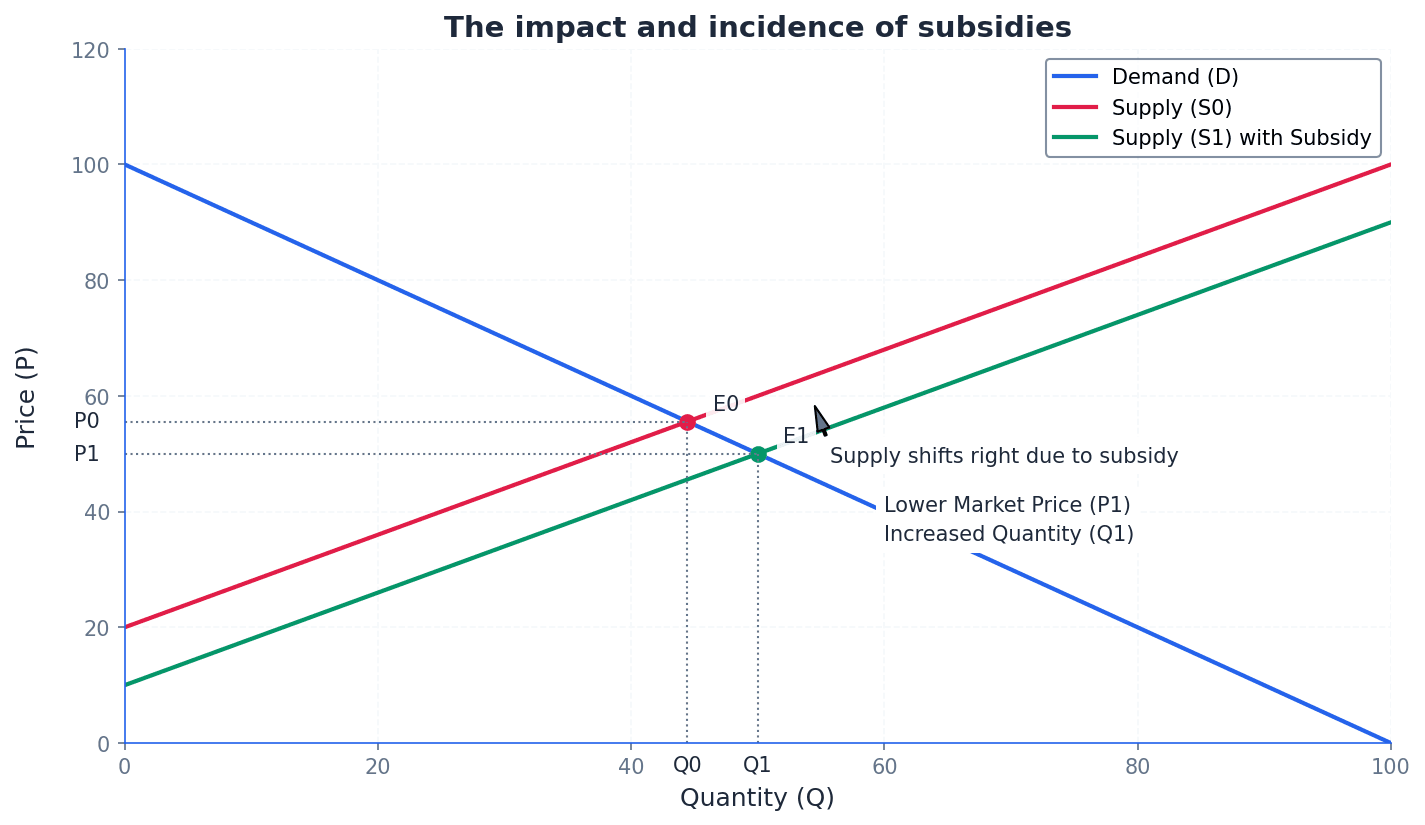
Governments can intervene directly in markets by providing goods and services themselves. This method is often used for public goods or merit goods, such as healthcare or education, where the free market may under-provide or fail to provide them efficiently or equitably.
Maximum price controls — Legislation imposed by the government to set a maximum price on a particular good or service, also known as price ceilings.
These controls are only effective if set below the free market equilibrium price, aiming to assist low-income families or reduce inequality. They can lead to shortages and the emergence of informal markets, similar to a landlord being legally prevented from charging more than a certain rent.
Students often think maximum prices always benefit all consumers, but actually they can lead to shortages, meaning some consumers cannot buy the product at all.
When analysing maximum prices, always explain that they must be set below the equilibrium price to be effective and discuss the potential for shortages and black markets.
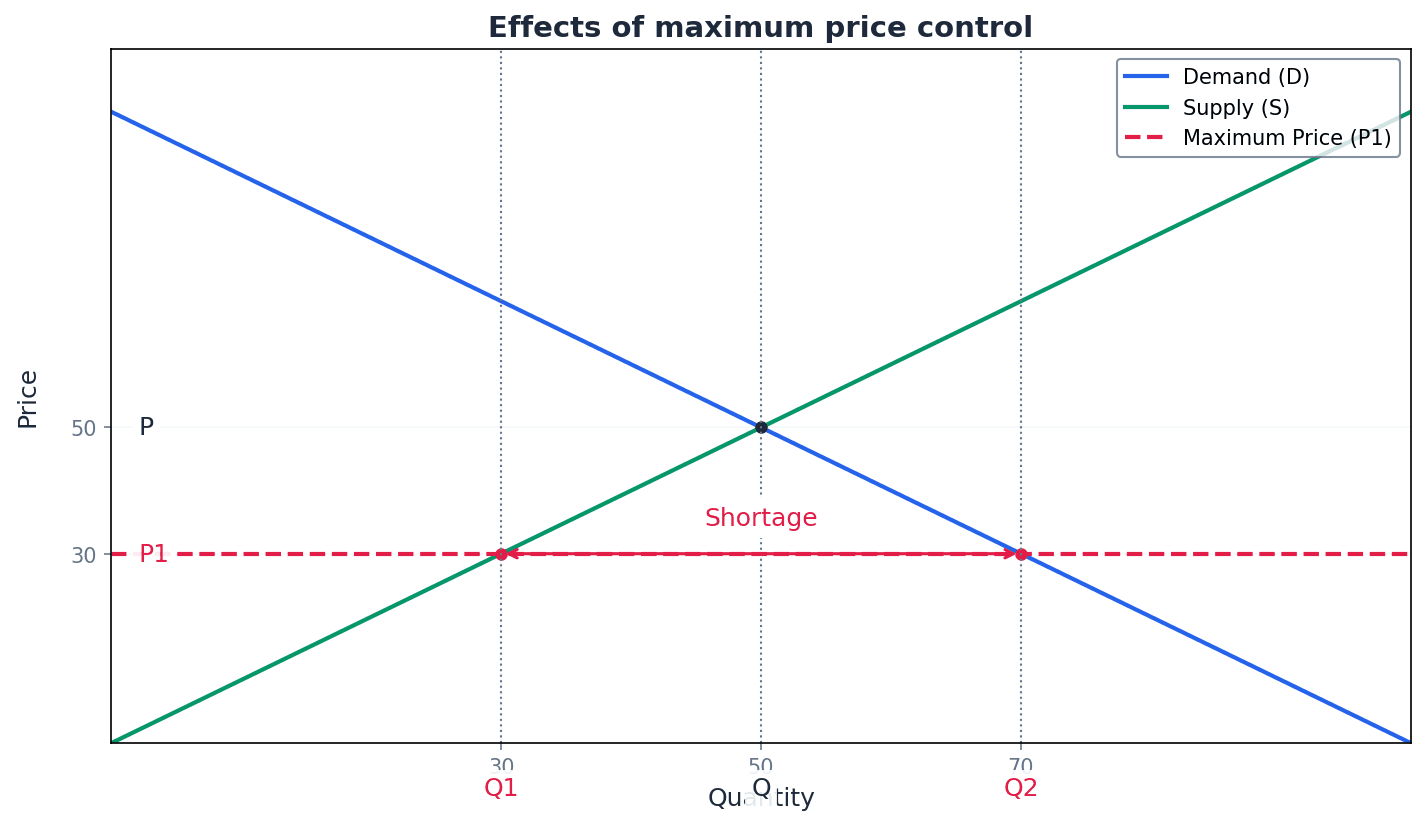
Minimum price control — Legislation imposed by the government to set a minimum price on a particular good or service, also known as a price floor.
These controls are only effective if set above the free market equilibrium price, often used for demerit goods, agricultural products, or wages. They can lead to excess supply, much like a minimum wage law where employers cannot pay workers less than a certain hourly rate.
Students often think minimum prices always benefit all producers, but actually they can lead to excess supply, which the government may have to buy up.
When analysing minimum prices, always explain that they must be set above the equilibrium price to be effective and discuss the potential for excess supply and inefficiency.
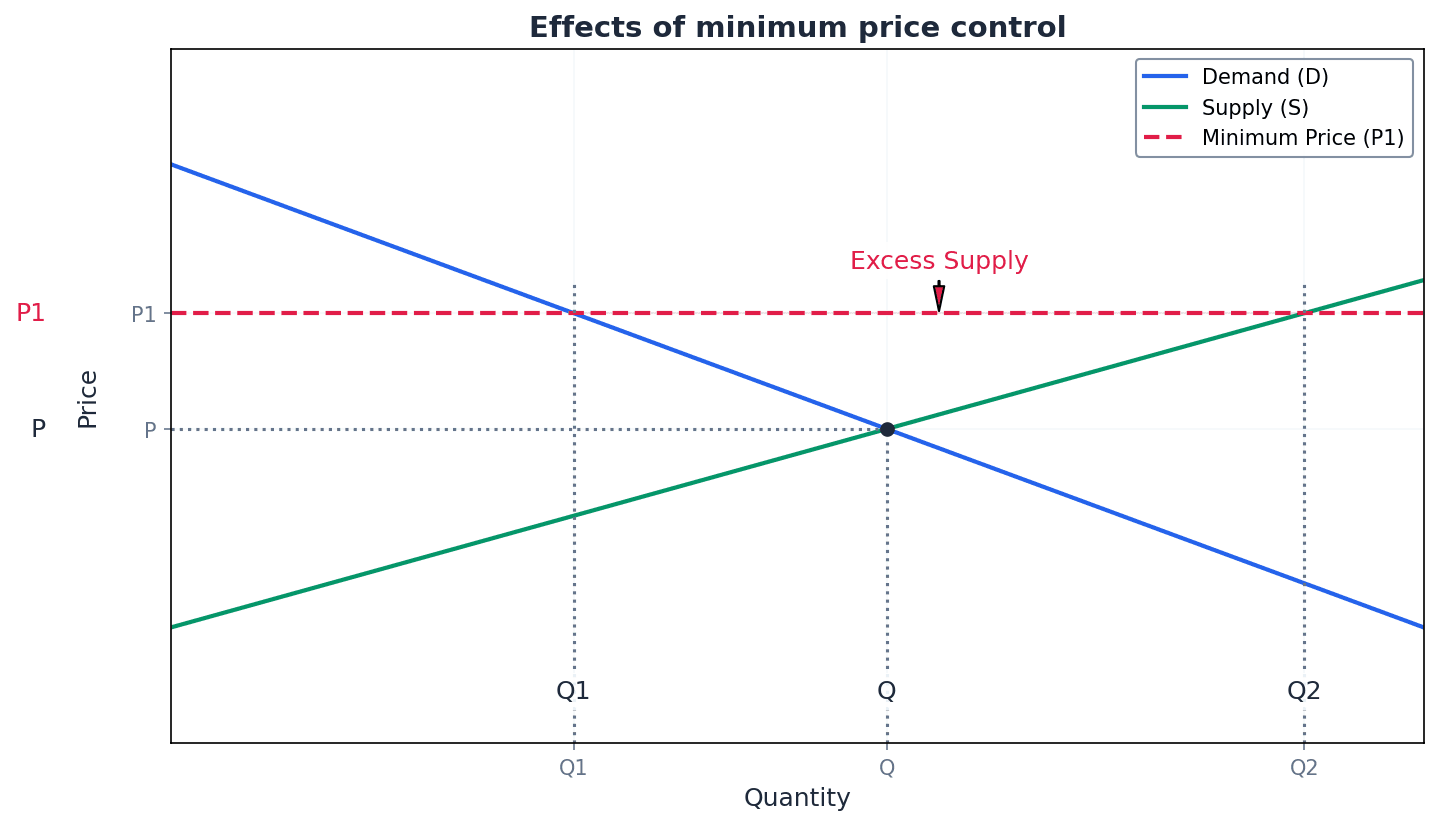
Buffer stock scheme — A scheme designed to smooth price rises and falls by buying and selling stocks of products depending on market conditions.
These schemes combine the principles of minimum and maximum price controls, buying up stocks when prices fall below a minimum and selling stocks when prices rise above a maximum, often used for agricultural products. This is like a thermostat that turns a heater on when the temperature drops too low and off when it gets too high, keeping the temperature stable.
Students often think buffer stock schemes eliminate price fluctuations entirely, but actually they aim to smooth or reduce volatility, not remove it.
When discussing buffer stock schemes, explain both the buying (to support minimum price) and selling (to enforce maximum price) mechanisms and their impact on supply.
Another method of government intervention is the provision of information. This aims to correct market failures arising from imperfect information, allowing consumers and producers to make more informed decisions, thereby improving market efficiency and welfare.
Always use a fully labelled diagram to illustrate the effects of any intervention. Show the before and after equilibrium points (P1, Q1 -> P2, Q2).
For price controls, always evaluate both the intended consequences (e.g., making goods affordable) and the unintended consequences (e.g., shortages, black markets, surpluses).
Advantages & Disadvantages
Indirect Taxes
Subsidies
Evaluation Starters
Essay Structure Guide
Introduction
Begin by defining the specific government intervention being discussed and briefly state its primary objective (e.g., 'A maximum price control is legislation imposed by the government to set a maximum price on a particular good or service, aiming to assist low-income families.').
Conclusion
Summarise the main arguments for and against the intervention. Provide a reasoned judgement on its overall effectiveness and desirability, considering both its intended and unintended consequences, and the context in which it is applied.
This chapter explores the fundamental distinction between income as a flow and wealth as a stock, and how the Gini coefficient quantifies inequality. It examines economic factors contributing to these disparities and discusses various government policies, such as minimum wage, progressive taxes, and state provision, aimed at redistributing income and wealth to foster greater equality.
Income — Income is the reward for the services of a factor of production.
It is a flow concept, measured over a period, like wages for labour or profits for entrepreneurship. Think of income like the water flowing into a bathtub from the tap; it's a continuous stream over time, providing purchasing power.
Wealth — Wealth describes the stock of assets that someone has built up over time.
These assets, such as property, shares, or businesses, are measured at a specific point in time and can generate future income. Think of wealth like the amount of water already in a bathtub at a given moment; it's a static quantity.
Students often confuse income and wealth. Remember: income is a flow of payments over time, while wealth is a stock of assets at a specific point in time.
When asked to 'explain the difference between income and wealth', clearly state that income is a flow concept and wealth is a stock concept, providing examples for each to secure full marks.
Gini coefficient — The Gini coefficient is a numerical measure of the extent of income inequality in an economy.
It ranges from 0 (perfect equality, where everyone has the same income) to 1 (perfect inequality, where one person has all the income). A lower Gini coefficient indicates a more equal distribution of income, useful for comparing countries or trends. Imagine a pie being shared among friends: 0 means everyone gets an equal slice, 1 means one person gets the whole pie.
Students often think a Gini coefficient of 1 means everyone has some income. It means all income accrues to just one person.
When interpreting Gini coefficients, remember that a value closer to 0 indicates greater equality, and a value closer to 1 indicates greater inequality. Be prepared to compare and contrast Gini coefficients for different countries.
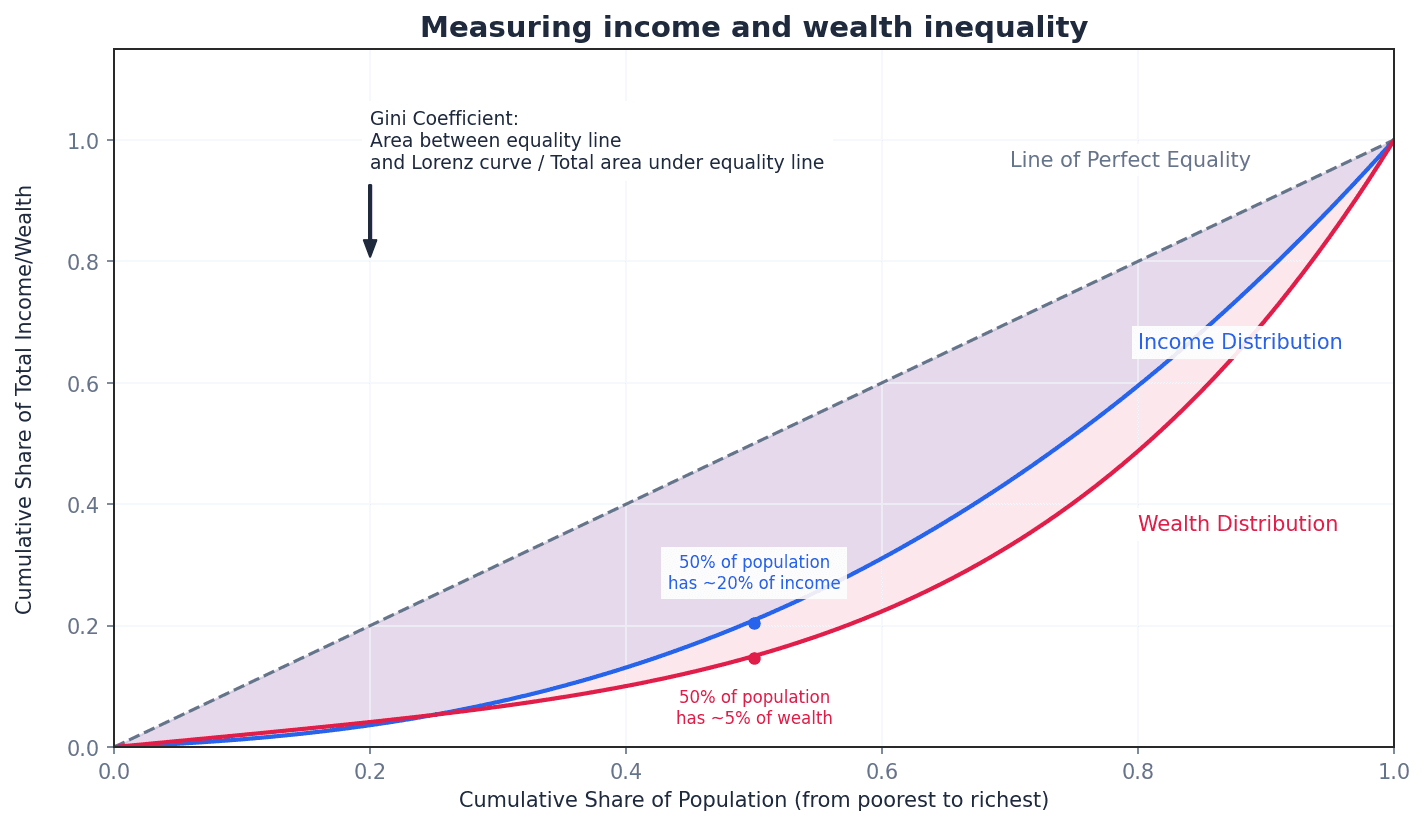
Income and wealth disparities arise from various economic factors. These include a lack of opportunities for certain segments of the population, often exacerbated by poor infrastructure. Such conditions can limit access to education, healthcare, and well-paying jobs, perpetuating cycles of low income and limited wealth accumulation.
Governments implement various policies to address income and wealth inequality. These policies aim to redistribute resources from higher-income or wealthier individuals to those with lower incomes or less wealth. The goal is to foster greater equality and improve living standards for vulnerable groups.
Minimum wage rate — A minimum wage rate is a legal requirement of what employers must pay an employee per hour.
This rate, before tax and social security deductions, aims to reduce poverty and income inequality by setting a floor for earnings. It's like a price floor for labour; the government sets a minimum price employers must pay for an hour of work.
Students often think a minimum wage always reduces unemployment. It can lead to unemployment if the wage is set above the equilibrium, as firms demand less labour.
When analysing the effects of a minimum wage, use a supply and demand diagram for labour, clearly showing the equilibrium wage, the minimum wage, and the resulting unemployment (excess supply of labour).
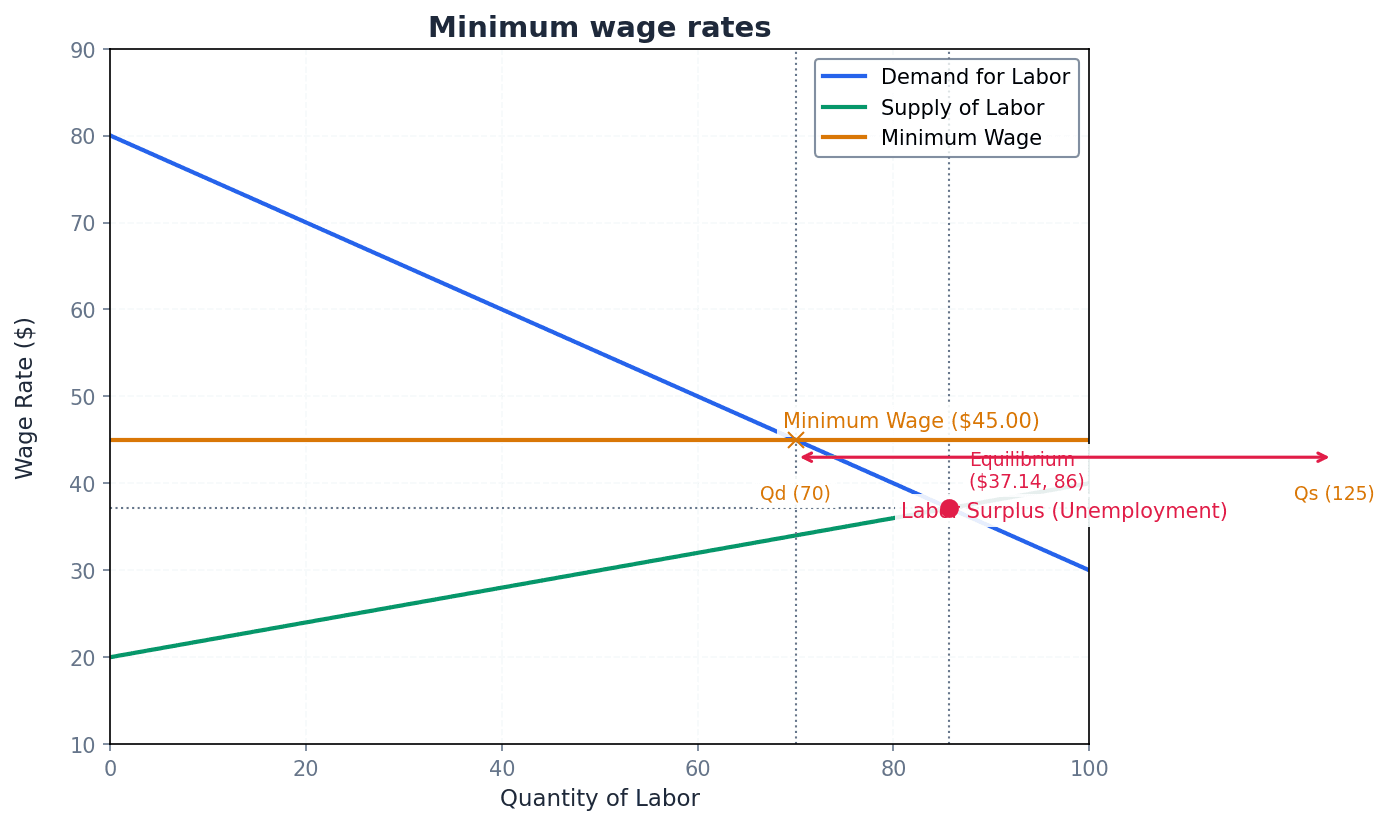
Transfer payment — A transfer payment is a payment from tax revenue that is received by certain members of the community.
These payments, such as old age pensions or unemployment benefits, are not made through the market as no production takes place. Their function is to provide a more equitable distribution of income, targeting vulnerable groups. Think of it as the government taking money from taxpayers and putting it into recipients' pockets without goods or services being exchanged for that specific payment.
Students often think transfer payments are earned income. They are payments for which no current production takes place, funded by taxes.
When discussing transfer payments, highlight their role in income redistribution and poverty reduction, but also acknowledge the potential disincentive effects on work for some recipients.
Progressive income tax — A progressive income tax is a tax system whereby those earning higher incomes are taxed a higher rate or percentage of their income than those on lower incomes.
This system aims to reduce income differentials and promote a more equal distribution of income, as the average rate of tax rises with income. Imagine a ladder where the higher you climb (the more you earn), the larger the percentage of each step (income) you have to give away.
Students often think a progressive tax simply means taxes increase as incomes rise. It means the *rate* or *percentage* of tax increases as income rises.
When defining a progressive tax, explicitly state that the 'rate of taxation' increases with income, not just the absolute amount of tax paid, to avoid a common definitional error.
Inheritance tax — Inheritance tax is a tax imposed on individuals who inherit more than a certain amount of wealth.
This policy aims to reduce wealth inequalities by requiring a portion of inherited wealth to be paid to the government. It's like a toll booth on a bridge to receiving inherited wealth; if the value is above a certain amount, a fee is paid to the government.
Capital tax — Capital tax is a tax payable on the financial gain a person may have made in the time that an asset, such as property or a financial portfolio, has been owned.
This tax targets wealth accumulation by taxing the increase in value of assets over time, rather than income. It's like paying a tax on the profit you make when you sell a valuable item that has increased in value since you bought it.
Governments can also reduce inequality by directly providing essential goods and services, such as healthcare and education. This ensures that everyone, regardless of their income or wealth, has access to fundamental necessities, thereby reducing inequality of opportunity and improving overall welfare.
When evaluating any redistribution policy, always consider both its intended benefits (e.g., reduced inequality) and potential drawbacks (e.g., disincentive effects, government failure).
Explain the full mechanism of redistribution. For example, 'Progressive taxes reduce the disposable income of high earners, and this revenue can then be used to fund transfer payments for low earners, reducing the income gap.'
Advantages & Disadvantages
Minimum Wage Rate
Progressive Income Tax
Evaluation Starters
Essay Structure Guide
Introduction
Begin by defining income and wealth, clearly distinguishing between them as flow and stock concepts. Introduce the Gini coefficient as a measure of inequality and briefly state the chapter's focus on reasons for inequality and policy responses.
Conclusion
Summarise the main arguments, reiterating the importance of addressing inequality. Conclude with a final evaluative statement on the challenges of implementing effective redistribution policies and the trade-offs involved, perhaps suggesting that a combination of policies is often most effective.
This chapter defines national income and explains its purpose, differentiating between GDP, GNI, and NNI. It details the three methods of measuring GDP and covers adjustments from market prices to basic prices, and from gross to net values, by accounting for taxes, subsidies, and depreciation.
National income — National income is a country’s total output.
It represents the total value of goods and services produced in an economy over a period, typically a year. This output generates income for factors of production, which is then spent on the output, creating a circular flow. Think of a family's total annual earnings from all their jobs and investments; that's their 'family income', similar to a country's national income.
Students often think national income only refers to money, but it actually represents the total value of goods and services produced, which then generates income.
National income statistics — National income statistics is a general term for a number of measures of a country’s economic activity in terms of its output, income and expenditure.
These statistics are crucial for governments and international organisations to assess economic performance, compare countries, and formulate economic policies aimed at stimulating growth and improving living standards. Like a doctor uses various vital signs (heart rate, temperature) to assess a patient's health, economists use national income statistics to assess an economy's health.
Be prepared to explain the purpose of national income statistics, such as assessing economic performance, comparing countries, and informing policy decisions.
Students often think national income statistics are just one number, but they encompass various measures like GDP, GNI, and NNI, each providing a different perspective.
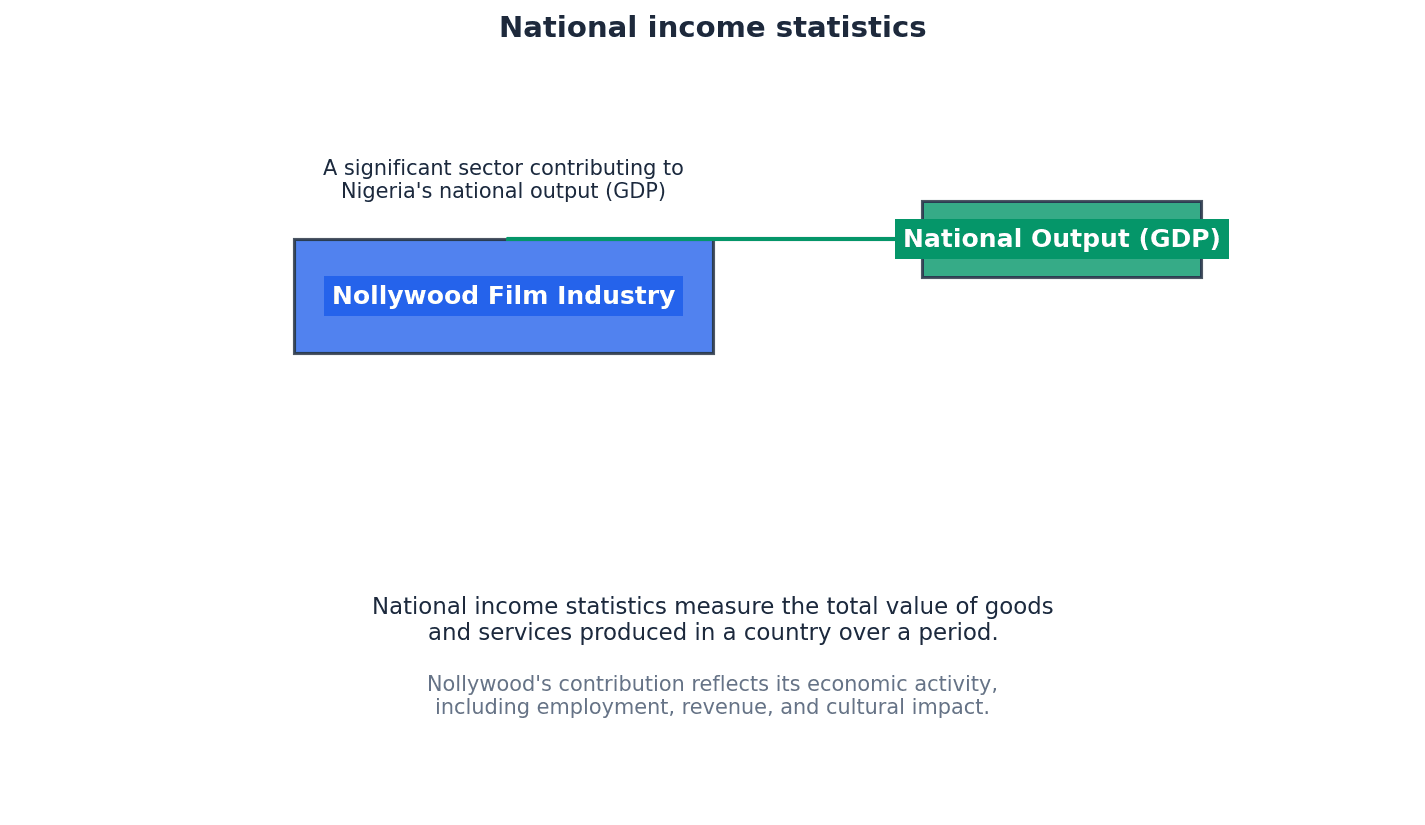
Gross domestic product (GDP) — GDP is a measure of the total value of output produced by the factors of production based in a country in a year.
It focuses on the geographical boundaries of a country, including output produced by foreign-owned firms within the country. It is the most widely used measure of national income. Imagine a factory in your town that makes cars. If that factory is owned by a foreign company, the value of the cars it produces still counts towards your town's 'domestic product', not the foreign country's.
Students often think GDP only includes output by domestic firms, but it actually includes all output produced within the country's borders, regardless of ownership.
Clearly distinguish 'domestic' (within borders) from 'national' (by residents) when defining GDP, as this is a common point of confusion and assessment.
Gross national income (GNI) — GNI is the total income earned by the country’s residents and firms regardless of where it is earned.
It includes net property income from abroad, net receipts of compensation of employees, and net taxes less subsidies on products, shifting the focus from output produced domestically to income earned by residents. If you work abroad and send money home to your family, that money contributes to your home country's GNI, even though it wasn't earned within its borders.
Students often think GNI is just GDP plus income from abroad, but it also accounts for income foreigners earn in the country and other net payments like compensation of employees and taxes/subsidies.
When comparing GDP and GNI, explain how net property income from abroad, compensation of employees, and net taxes/subsidies on products differentiate the two measures.
Compensation of employees — Compensation of employees is wages earned by workers who are resident in one country but who work abroad for short periods.
This includes income earned by seasonal workers or cross-border commuters who reside in one country but earn their wages in another. These net receipts are added to GDP to calculate GNI. A construction worker living in Mexico but working daily across the border in the US, sending his wages home, contributes to Mexico's GNI through 'compensation of employees'.
GDP can be measured using three equivalent methods: the output method, the income method, and the expenditure method. Each method captures a different aspect of the circular flow of income, but theoretically, they should yield the same total value for a country's economic activity.
The output method measures GDP by summing the 'value added' at each stage of production across all industries in the economy. This approach avoids double counting intermediate goods by only including the new value created by each firm.
Value added — Value added is the difference between the price a firm pays for the goods and services it buys from other firms and the price it sells its product for.
This measure is used in the output method to avoid double counting by only including the new value created at each stage of production, rather than the total value of intermediate goods. A baker buys flour for 3. The 'value added' by the baker is 3, because the flour's value was already counted.
When explaining the output method, explicitly state how 'value added' prevents double counting, which is a key concept for accurate GDP measurement.
The income method calculates GDP by summing all incomes earned by factors of production within the country's borders. This includes wages, salaries, profits, rent, and interest. Transfer payments are excluded from this calculation as they do not represent payment for current production.
Transfer payments — Transfer payments are transfers of income from taxpayers to groups of individuals for welfare payments and to firms in the form of subsidies.
These payments are not included in the income or expenditure methods of GDP calculation because they do not represent payment for a good or service produced in the current period; they are simply a redistribution of existing income. Receiving a birthday gift of money is a transfer payment; you didn't 'earn' it by producing something, it was just given to you.
Students often think all government spending is included in GDP, but transfer payments like unemployment benefits are excluded because they don't represent new production.
Always remember to exclude transfer payments when calculating GDP using either the income or expenditure methods, as they do not reflect current production of goods and services.
The expenditure method measures GDP by summing the total spending on all final goods and services produced within a country in a given period. This includes consumption by households, investment by firms, government spending on goods and services, and net exports (exports minus imports).
National income figures can be presented at market prices or basic prices. Market prices reflect the actual prices consumers pay, while basic prices represent the income received by producers before government intervention through taxes and subsidies.
Market prices — Market prices are the prices charged to consumers, including any taxes on products (indirect taxes) and deducting any subsidies that have been given to producers.
These are the actual prices consumers pay in the market. They reflect government intervention through indirect taxes and subsidies, which affect the final price. The price tag you see on a new shirt in a store is its market price, including any sales tax.
Basic prices — Basic prices (also referred to as factor cost) are the prices which would be charged without government intervention and which equal the income paid to the factors of production for making the output.
These prices reflect the true cost of production before any indirect taxes are added or subsidies are deducted. They represent the income earned by the factors of production. Imagine the price a farmer would sell their produce for directly to a distributor, before any government taxes are added or subsidies are applied to the final consumer price.
Students often confuse market prices with basic prices, forgetting that market prices include indirect taxes and deduct subsidies, while basic prices do not.
When converting between market prices and basic prices, remember that indirect taxes are added to basic prices to get market prices, and subsidies are deducted from basic prices to get market prices.
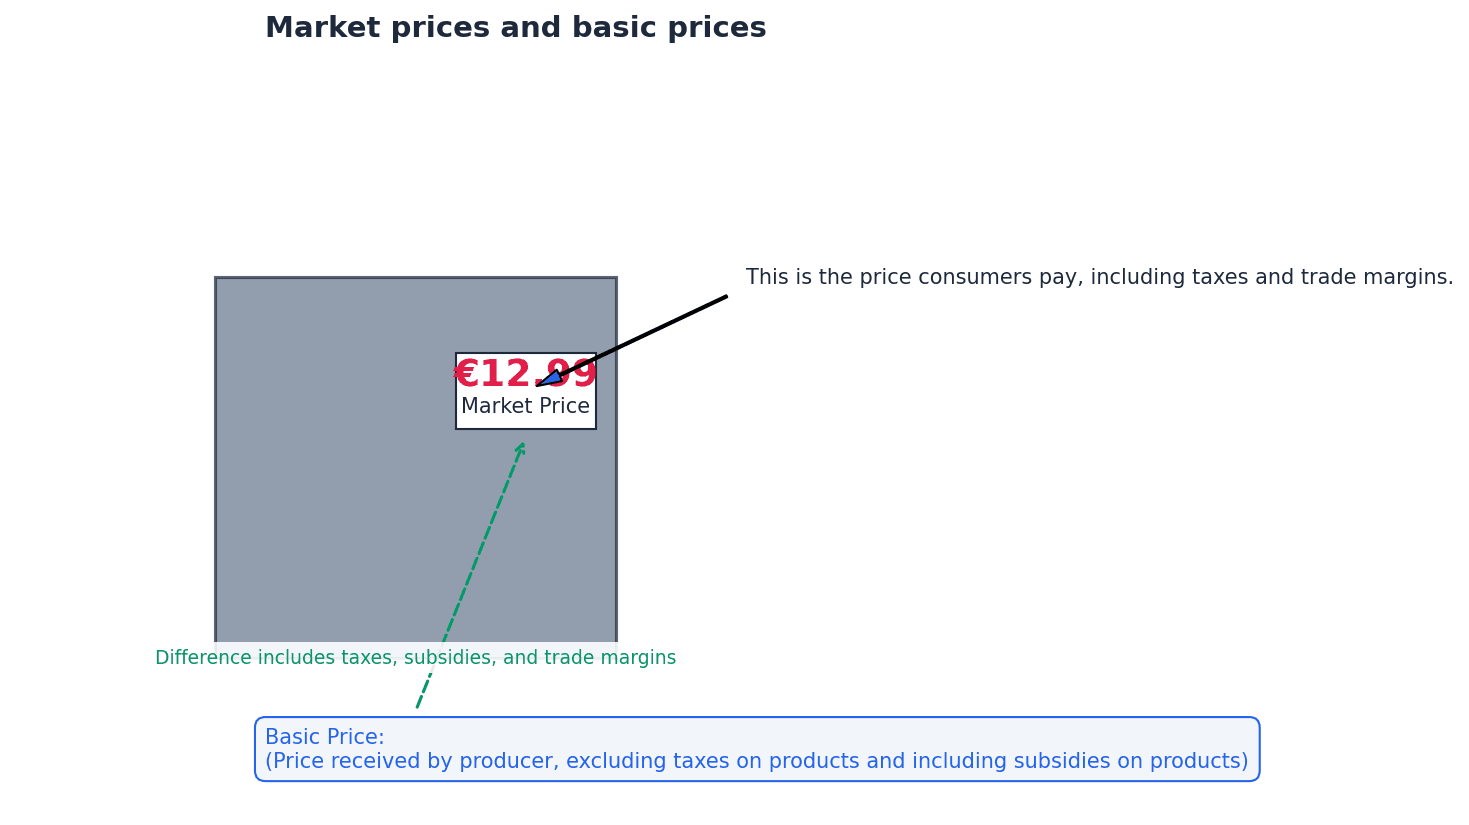
National income measures can also be presented as gross or net values. Gross values include the total output or income before accounting for the wear and tear on capital goods, while net values subtract this cost to provide a more accurate picture of sustainable output.
Gross investment — Gross investment includes the output of capital goods both used to replace existing capital goods that have worn out or become out of date due to advances in technology and capital goods required to expand capacity.
It represents the total spending on new capital goods in an economy. It includes both investment for replacement and investment for expansion. If a company buys a new machine, that's gross investment. It doesn't matter if it's replacing an old machine or adding a new one to increase production.
Depreciation — Depreciation or capital consumption is the value of the replacement capital goods.
It represents the wear and tear or obsolescence of existing capital goods over a period. Subtracting depreciation from gross investment gives net investment, and from gross national income gives net national income. Just like your car loses value over time due to use and age, a country's factories and machines also 'depreciate' and need to be replaced.
Depreciation is a crucial adjustment when moving from 'gross' to 'net' measures of national income, reflecting the cost of maintaining capital stock.
Net domestic product (NDP) — Net domestic product (NDP) only includes net investment, deducting the value of replacement capital goods.
NDP is derived from GDP by subtracting depreciation (capital consumption). It provides a more accurate picture of the actual increase in a country's capital stock and its sustainable productive capacity. If a company's gross profit is 20,000 was spent replacing old equipment, its 'net profit' (similar to NDP) is $80,000.
Net national income (NNI) — Net national income (NNI) is GNI minus depreciation.
NNI provides a measure of national income that accounts for the consumption of fixed capital (depreciation). It indicates the income available to residents after maintaining the existing capital stock. If your total income (GNI) is 5,000 to repair your work tools (depreciation), your 'net income' (NNI) is $45,000.
Students often forget to deduct depreciation when moving from gross to net national income measures, which is a critical adjustment.
If a question involves 'Net National Income', your first step should be to recall the formula: NNI = GNI - Depreciation.
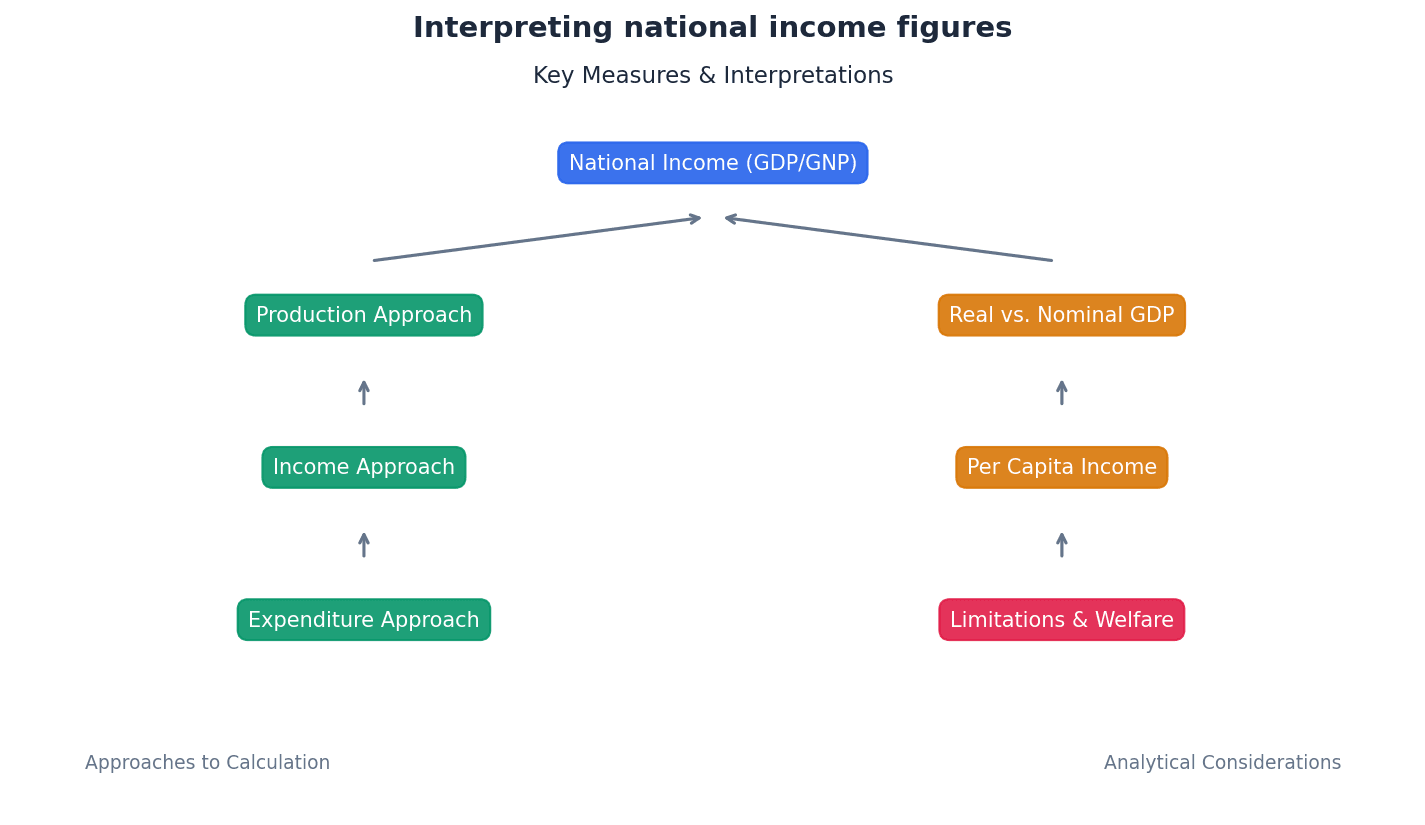
When defining GDP, always specify 'within a country's geographical borders' and 'over a given period of time' for full marks.
Be precise with the expenditure formula: C + I + G + (X-M). Remember that 'G' is government spending on goods and services, not including transfer payments.
Advantages & Disadvantages
Using GDP as a measure of economic performance
Using GNI instead of GDP
Evaluation Starters
Essay Structure Guide
Introduction
Begin by defining national income and briefly stating the purpose of national income statistics. Introduce the key measures like GDP and GNI and outline the scope of your discussion.
Conclusion
Summarise the main points, reiterating the definitions and distinctions between the various national income measures. Conclude by emphasising the importance of understanding these statistics while acknowledging their inherent limitations in fully capturing economic welfare.
This chapter introduces the circular flow of income model, illustrating how income, spending, and output move through an economy. It differentiates between closed and open economies, explaining how the flow involves households, firms, the government, and the international economy. The chapter analyses the impact of injections and leakages on the circular flow, and defines the conditions for equilibrium and disequilibrium income.
circular flow of income — The circular flow of income model shows how income, spending and output move around an economy.
This model illustrates the interdependence of economic agents such as households, firms, the government, and the international economy, and how economic activity generates a continuous flow of money and goods/services. It explains why GDP can be measured by calculating a country's output, income, or expenditure. Think of a water fountain where water (income/spending) is continuously pumped around.
Students often think the circular flow only involves money, but it also represents the real flow of products and factor services.
When asked to explain the circular flow, ensure you describe both the real and money flows and identify the key economic agents involved. Use a diagram to support your explanation.
closed economy — A closed economy is one that does not export or import goods and services.
In a closed economy, all economic activity occurs within national borders, with no international trade. While no economy is truly closed, this model simplifies analysis by excluding the international sector. Consider a self-sufficient island community that produces everything it consumes and doesn't trade with any other islands.
Students often think a closed economy is a realistic scenario, but it is a theoretical model used for simplification, as all real economies engage in some form of international trade.
When discussing a closed economy, clearly state that it is a theoretical construct and explain why it is used in economic models (e.g., to simplify analysis before introducing international trade).
open economy — An open economy is an economy that takes part in international trade.
In an open economy, there are flows of goods, services, and capital across national borders, meaning it exports and imports. This contrasts with a closed economy, which does not engage in international trade. Imagine a house with open windows and doors, allowing people and goods to move freely in and out.
Students often think an open economy means there are no trade barriers, but it simply means the economy engages in international trade, regardless of the level of barriers.
When comparing open and closed economies, explicitly mention the role of exports and imports in an open economy and their absence in a closed economy model.

leakages — Leakages are withdrawals from the circular flow of income.
These are parts of income that are not immediately spent on domestically produced goods and services. Common leakages include saving (S), taxation (T), and imports (M), which reduce the amount of money circulating within the domestic economy. Think of a leaky bucket where water (income) is flowing out through holes.
Students often think leakages are always bad for an economy, but saving can finance investment, and taxation funds government spending, both of which can be beneficial.
When analysing the impact of leakages, remember to explain how they reduce aggregate demand and can lead to a fall in national income if not offset by injections. Use the symbols S, T, M.
injections — Injections are extra items of spending that add to the circular flow of income.
These are additions to the spending stream that do not originate from current domestic income. Key injections are investment (I), government spending (G), and exports (X), which increase the total spending in the economy. Imagine adding water to a bucket that has some water already.
Students often think injections only come from outside the country, but investment and government spending are domestic injections.
When discussing injections, clearly state how they increase aggregate demand and can lead to a rise in national income. Use the symbols I, G, X.
The circular flow of income is continuously affected by injections and leakages. Injections, such as investment, government spending, and exports, add to the flow, increasing total spending and potentially national income. Conversely, leakages, including saving, taxation, and imports, withdraw money from the flow, reducing domestic spending.
equilibrium income — For income to be unchanged, injections of extra spending into the circular flow of income must equal leakages from the circular flow.
Equilibrium income occurs when the total amount of money entering the circular flow (injections) exactly balances the total amount leaving it (leakages). At this point, there is no tendency for national income to rise or fall. Consider a balanced scale where the weight on one side (injections) equals the weight on the other (leakages).
Students often think equilibrium means the economy is at its optimal level, but it just means there's no tendency for change, which might still be below full employment.
When asked to define or explain equilibrium income, always state the condition: Injections = Leakages (I+G+X = S+T+M) and explain what happens if this condition is not met.
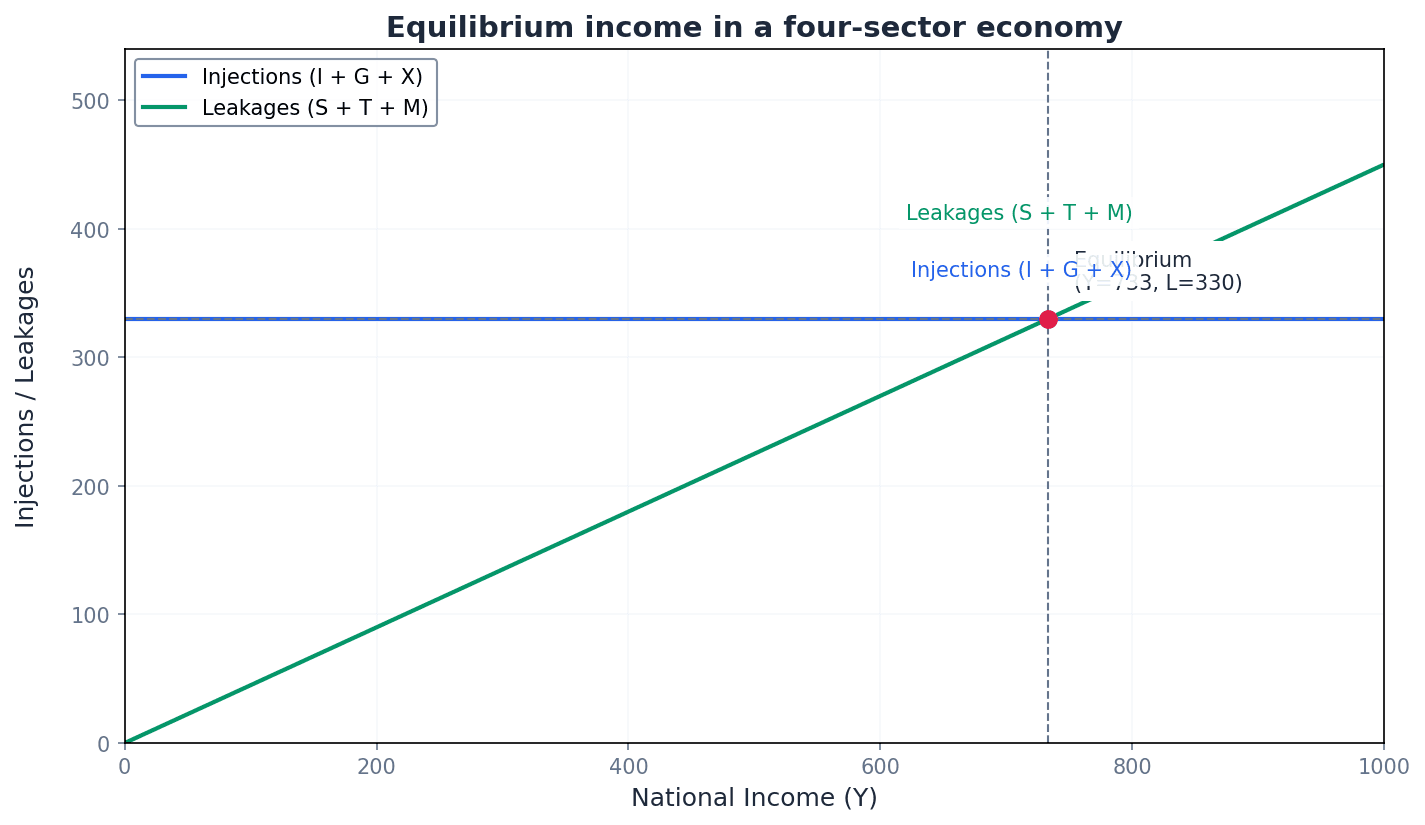
disequilibrium — Disequilibrium occurs when injections are not equal to leakages in the circular flow of income.
If injections are greater than leakages, there will be extra spending, causing income to rise. Conversely, if leakages exceed injections, more spending will leave the circular flow, and income will fall, moving the economy away from its previous equilibrium. If a balanced scale suddenly has more weight added to one side, it becomes unbalanced or in disequilibrium.
When analysing disequilibrium, clearly explain the direction of change in income (rise or fall) based on whether injections are greater or less than leakages.
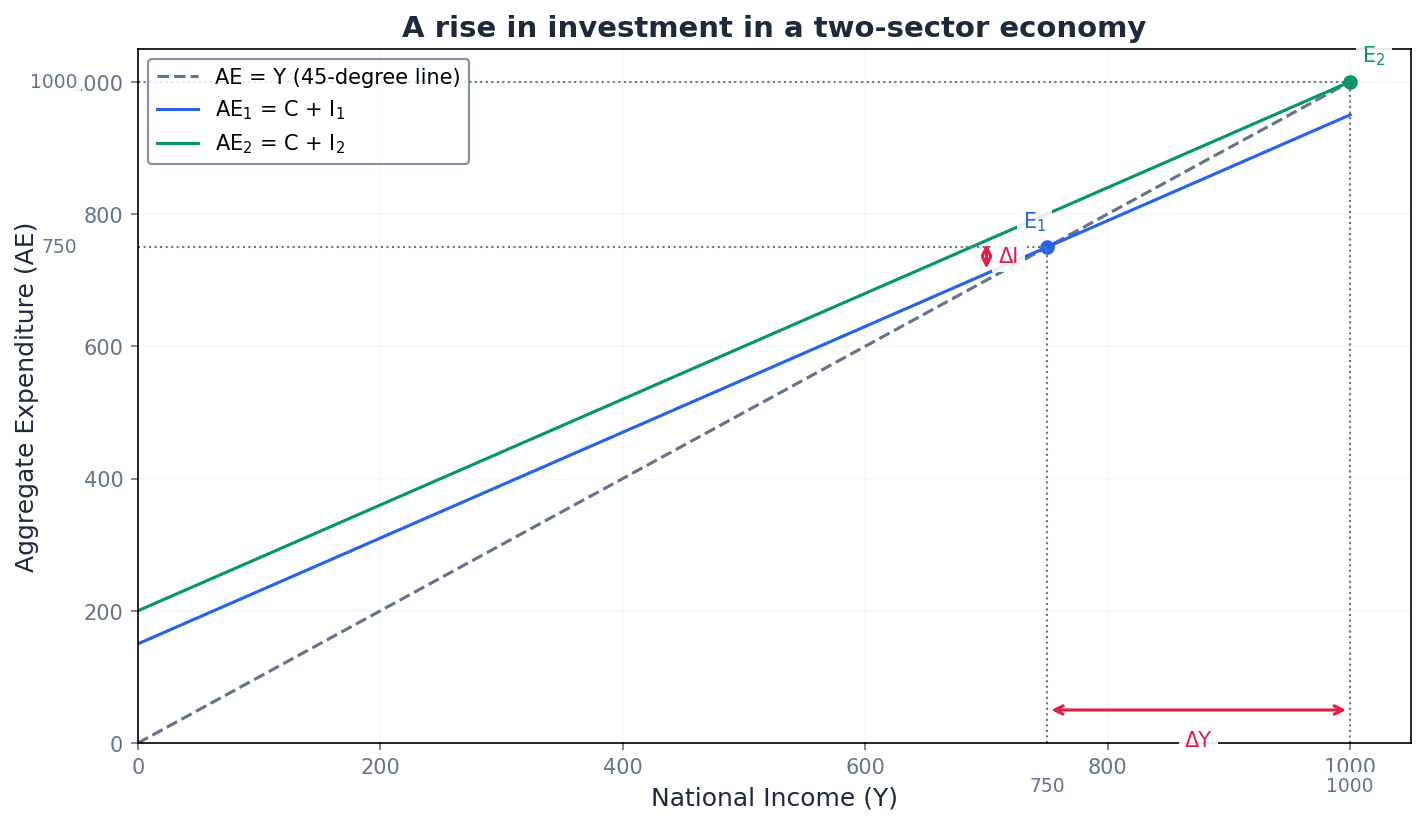
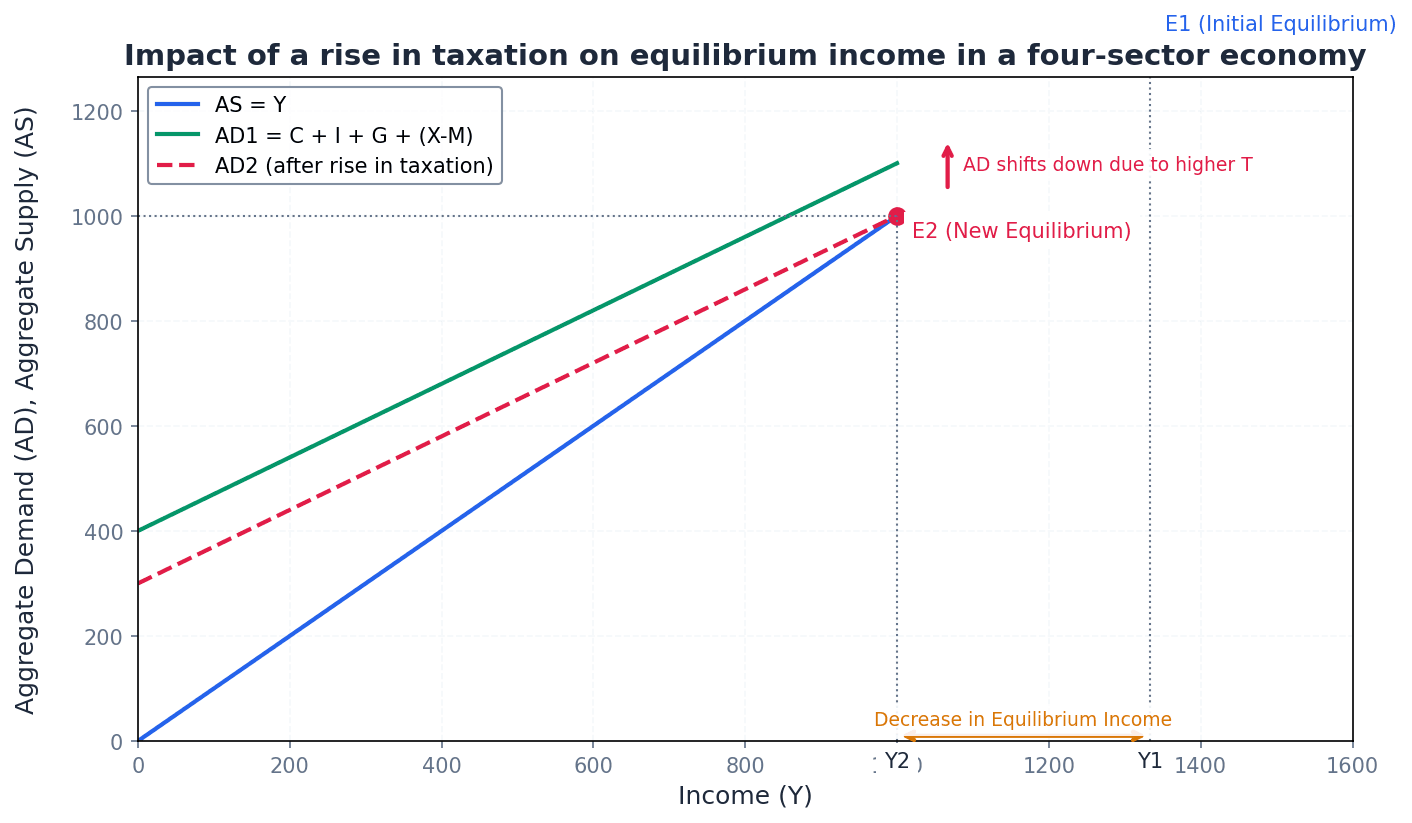
Always draw a clear, fully-labelled diagram when explaining the circular flow. Distinguish between two-sector and four-sector models.
To analyse a change (e.g., a rise in investment), explain the initial disequilibrium (Injections > Leakages) and the process that leads to a new, higher equilibrium income.
Show deeper understanding by explaining the links between leakages and injections (e.g., savings are channelled through financial institutions to fund investment).
Advantages & Disadvantages
Closed Economy Model
Leakages (Saving, Taxation, Imports)
Evaluation Starters
Essay Structure Guide
Introduction
Begin by defining the circular flow of income and briefly outlining its purpose in illustrating economic activity. State whether you will focus on a closed or open economy, or both, depending on the question.
Conclusion
Summarise the key takeaways regarding how income, spending, and output move through an economy and the importance of injections and leakages in determining national income. Reiterate the model's value as a foundational concept in macroeconomics.
This chapter introduces aggregate demand (AD) and aggregate supply (AS) as fundamental tools for macroeconomic analysis. It defines AD's components and determinants, explaining the downward slope of the AD curve, and then defines AS, differentiating between short-run (SRAS) and long-run (LRAS) curves. Finally, it explains how the interaction of AD and AS determines macroeconomic equilibrium, influencing real output, the price level, and employment.
Aggregate demand (AD) — Aggregate demand (AD) in economics is used to describe the total spending of consumers (households), firms and the government plus foreigners’ spending on the country’s exports minus spending by the country’s consumers, firms and government on imports.
AD represents the total demand for all goods and services produced in an economy at a given price level. It is composed of consumption, investment, government spending, and net exports. Think of aggregate demand as the total shopping cart of an entire country, including everything everyone in the country buys, plus what foreigners buy from the country, minus what the country buys from abroad.
Students often think AD is just the sum of individual demands, but actually it's the total spending on all goods and services in an economy, influenced by the overall price level, not just relative prices.
When asked to 'explain' AD, ensure you list and briefly describe its four components (C+I+G+(X-M)). For 'analyse' questions, discuss the determinants of these components.
Consumer expenditure — Consumer expenditure (also called consumer spending or consumption) is spending by households on goods and services to satisfy current wants, for example, spending on food, clothing, travel and entertainment.
This is the largest component of aggregate demand and is primarily influenced by disposable income. Imagine all the money spent by every household in a country on everyday items and services, from groceries to haircuts, that's consumer expenditure.
Students often think consumer expenditure only includes essential items, but actually it covers all spending by households on goods and services, including luxuries.
When discussing changes in consumer expenditure, link it to disposable income, interest rates, and consumer confidence. Avoid just stating 'income' and specify 'disposable income'.
Saving — Saving is defined as disposable income minus consumer expenditure.
Saving represents the portion of disposable income that is not spent on consumption. It can be held in bank accounts or other financial assets and is a source of funds for investment. If your weekly allowance is your disposable income, and you spend some on snacks, the money you put aside for a bigger purchase later is your saving.
Students often think saving is just putting money in a bank, but actually it's any disposable income not spent on current consumption, which can include paying off debt or investing.
Investment — Investment includes private sector spending by firms on capital goods, such as factories, offices, machinery and delivery vehicles.
This component of AD is crucial for an economy's long-term growth as it increases productive capacity. It is influenced by consumer demand, interest rates, technology, cost of capital, expectations, and government policy. Think of a baker buying a new, more efficient oven for their bakery; that's investment – spending on something that will help produce more in the future.
Students often confuse financial investment (buying shares) with economic investment, but actually economic investment refers to the purchase of new capital goods by firms.
When analysing investment, consider both the demand-side (consumer demand, expectations) and supply-side (interest rates, technology, cost of capital) influences. Remember government investment is usually in government spending.
Government spending — Government spending includes expenditure on providing merit goods, such as education and healthcare, and public goods, such as defence.
This component of AD is determined by government policy, tax revenue, and demographic changes. It can be used to stimulate economic activity or provide essential services. Imagine the government building new roads, funding schools, or paying for national defence; all these are examples of government spending contributing to aggregate demand.
Students often think government spending only includes welfare payments, but actually it encompasses all government purchases of goods and services, including infrastructure and public sector wages.
Net exports — Net exports are foreigners’ spending on the country’s exports minus spending by the country’s consumers, firms and government on imports.
This component reflects the balance of trade and is influenced by a country's GDP, other countries' GDPs, relative price and quality competitiveness, and the exchange rate. A positive value adds to AD, while a negative value subtracts. If a country sells more goods to other countries than it buys from them, it has positive net exports, like a shop that sells more than it buys from suppliers.
Students often think net exports only depend on the quality of domestic goods, but actually it's also heavily influenced by the exchange rate and incomes in both the domestic and foreign economies.
Aggregate demand (AD) curve — The aggregate demand (AD) curve shows the different quantities of total demand for the economy’s products at different prices.
It slopes downwards due to the wealth effect (reduced purchasing power of savings), the international effect (exports become less competitive, imports more competitive), and the interest rate effect (higher prices increase demand for money, raising interest rates and reducing C and I). Imagine the total amount of goods and services everyone in a country wants to buy. If prices generally go up, people feel poorer, foreign goods look cheaper, and borrowing becomes more expensive, so they buy less overall.
Students often confuse the AD curve with a microeconomic demand curve, but actually the AD curve shows the relationship between the overall price level and total output demanded, not the relative price of a single good.
When explaining the downward slope of the AD curve, explicitly mention and explain the wealth effect, international effect, and interest rate effect. Do not just say 'people buy less when prices rise'.
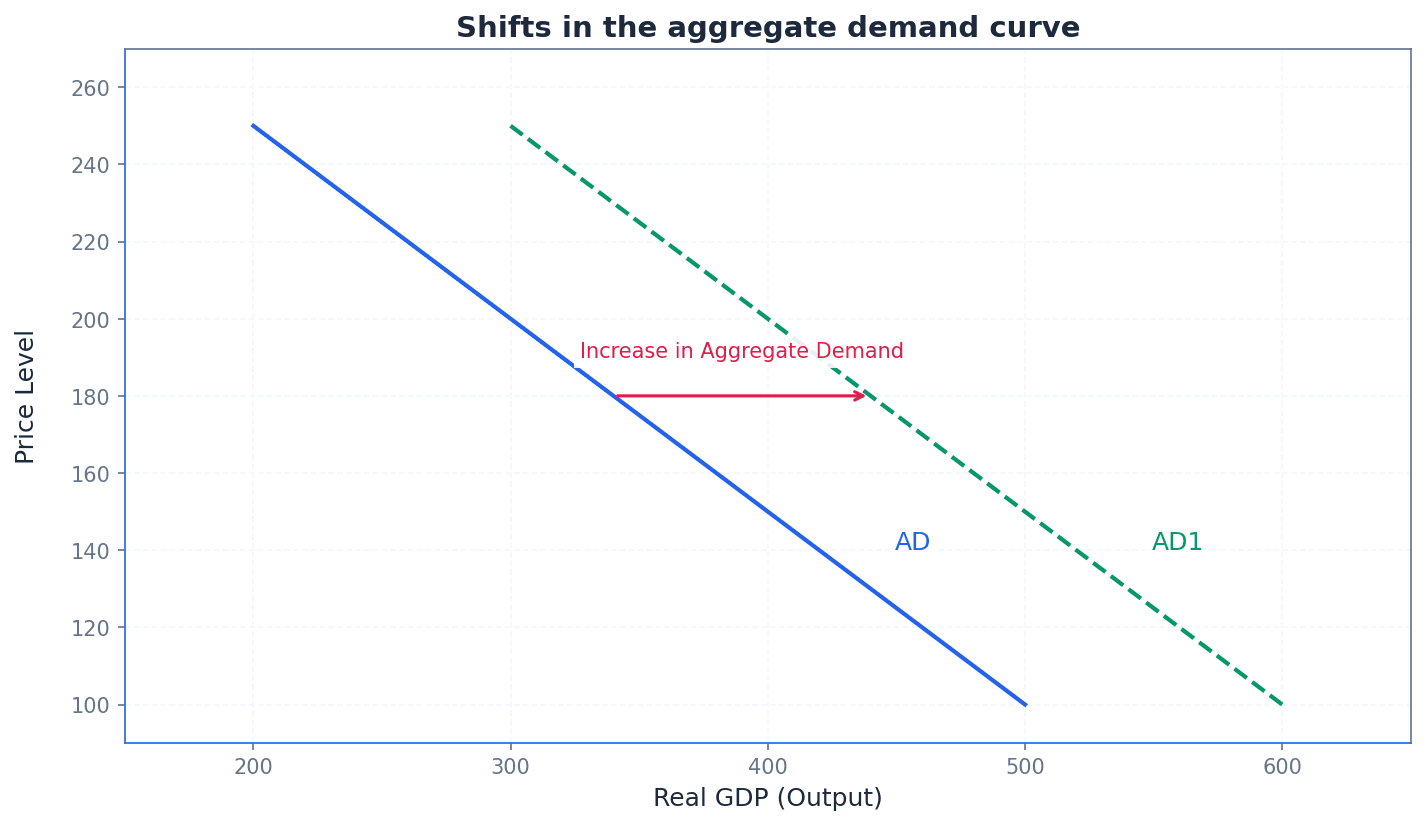
A shift in the aggregate demand curve occurs when any of the determinants of its components (C, I, G, X-M) change, other than the price level. For example, an increase in consumer confidence or a fall in interest rates would increase consumption and investment, shifting the AD curve to the right. Conversely, a decrease in government spending or a rise in the exchange rate (making exports more expensive) would shift the AD curve to the left.
Aggregate supply (AS) — Aggregate supply (AS) is the total planned supply of all the producers in the country.
AS represents the total quantity of goods and services that firms are willing and able to produce and sell at a given price level. It is often differentiated into short-run (SRAS) and long-run (LRAS). Think of aggregate supply as the total amount of goods and services that all the factories, farms, and service providers in a country are collectively willing to produce.
Students often think AS is just the sum of individual firms' supply curves, but actually it's the total output of an entire economy, influenced by factors of production and technology.
Always specify whether you are referring to short-run (SRAS) or long-run (LRAS) aggregate supply, as their determinants and shapes differ significantly.
Short-run aggregate supply — Short-run aggregate supply is the output that will be supplied in a period of time when the prices of factors of production (inputs, resources) have not had time to adjust to changes in aggregate demand and the price level.
The SRAS curve slopes upwards because as the price level rises, firms' profits increase (due to sticky input prices), average costs may rise with increased output, and producers may misinterpret general price rises as relative price rises for their products. Imagine a factory that can quickly increase production by having workers do overtime, but their wages (input costs) don't immediately go up; they'll produce more if they can sell at higher prices.
Students often think SRAS is vertical, but actually it's upward sloping because some input prices are sticky in the short run, allowing firms to increase profits by producing more at higher output prices.
When explaining the upward slope of SRAS, refer to the profit effect, cost effect, and misinterpretation effect. When discussing shifts, focus on changes in factor prices, taxes, productivity, and quantity of resources.
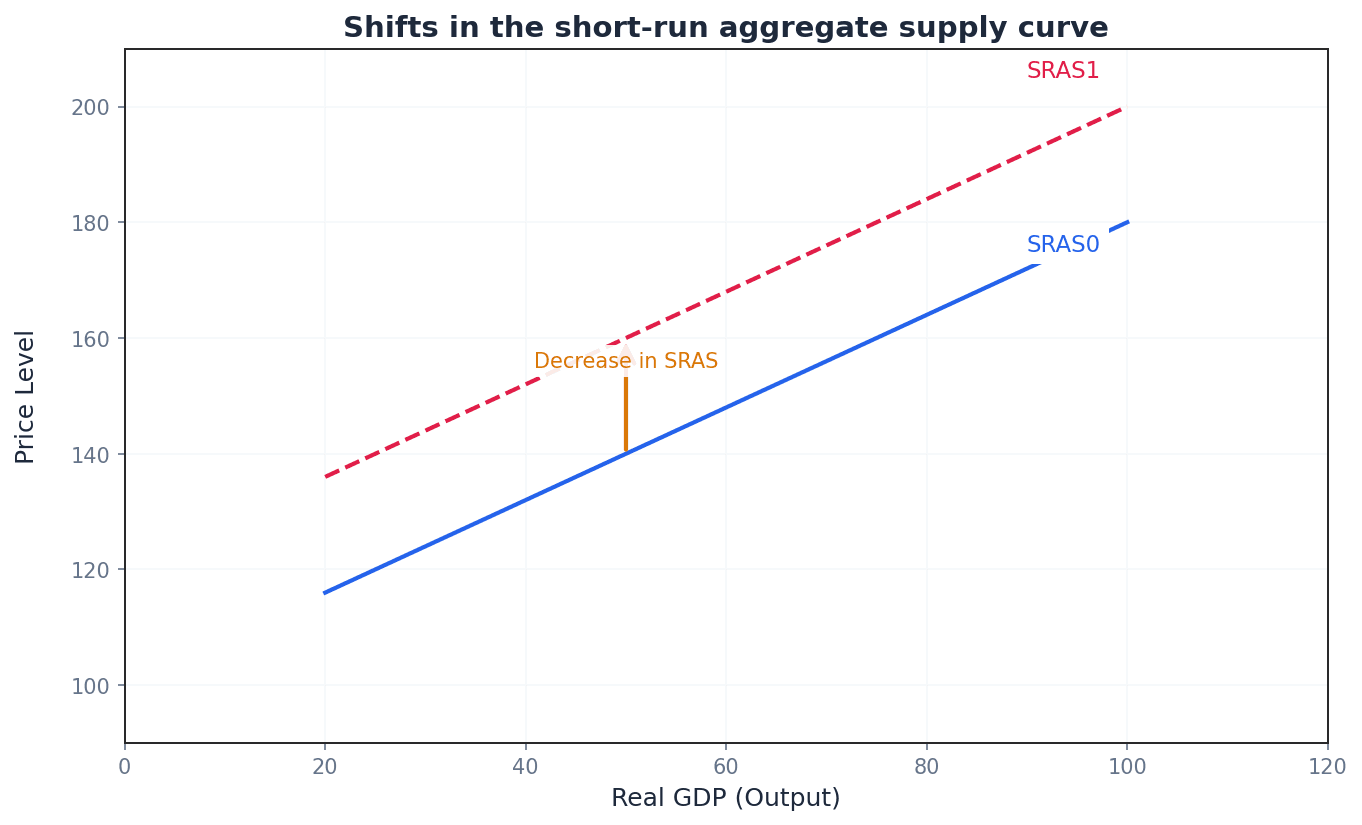
The SRAS curve shifts due to changes in the costs of production. For example, a rise in wage rates, an increase in the price of raw materials (like oil), or an increase in indirect taxes would increase firms' costs, shifting the SRAS curve to the left. Conversely, a fall in input prices or an increase in productivity would shift the SRAS curve to the right, allowing firms to supply more at each price level.
Long-run aggregate supply — Long-run aggregate supply is the output that will be supplied in the time period when the prices of factors of production have fully adjusted to changes in aggregate demand and the price level.
In the long run, all input prices are flexible, so the economy's output is determined by its productive potential (quantity and quality of resources), not the price level. Its shape differs between Keynesian and new classical views. Think of the maximum sustainable output a country can produce if all its resources are fully and efficiently employed, regardless of how much money is circulating.
Students often think LRAS is always vertical, but actually the Keynesian view suggests it can be horizontal at low output levels due to spare capacity before becoming vertical at full capacity.
Clearly state whether you are using the Keynesian or new classical LRAS curve, as this impacts the analysis of policy effects. Shifts in LRAS are caused by changes in the quantity and/or quality of resources.
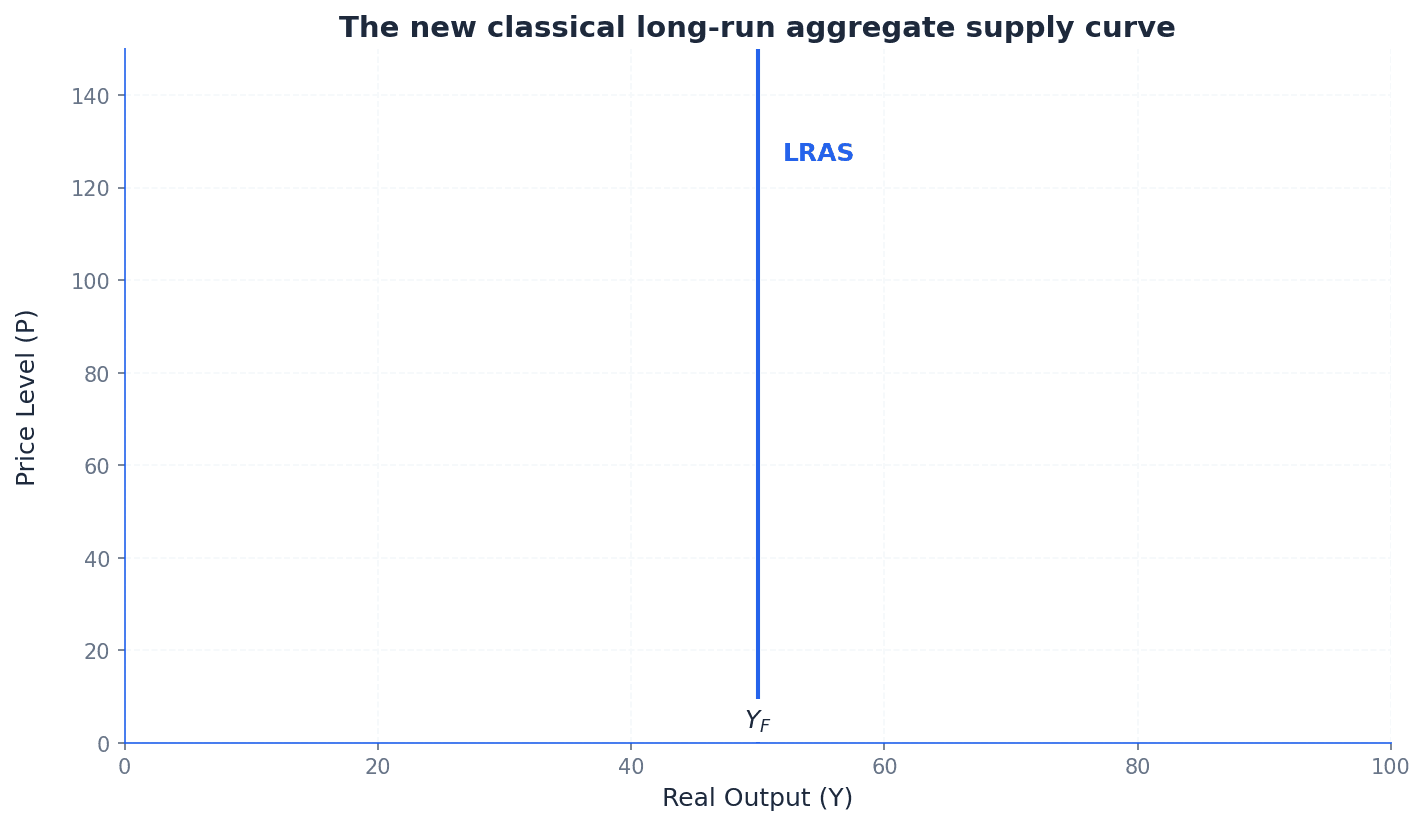
The New Classical LRAS curve is vertical at the full employment level of output. This implies that in the long run, the economy's output is determined solely by the quantity and quality of its factors of production (labour, capital, land, technology), and is independent of the price level. Any increase in aggregate demand in the long run, according to this view, will only lead to inflation, not an increase in real output.
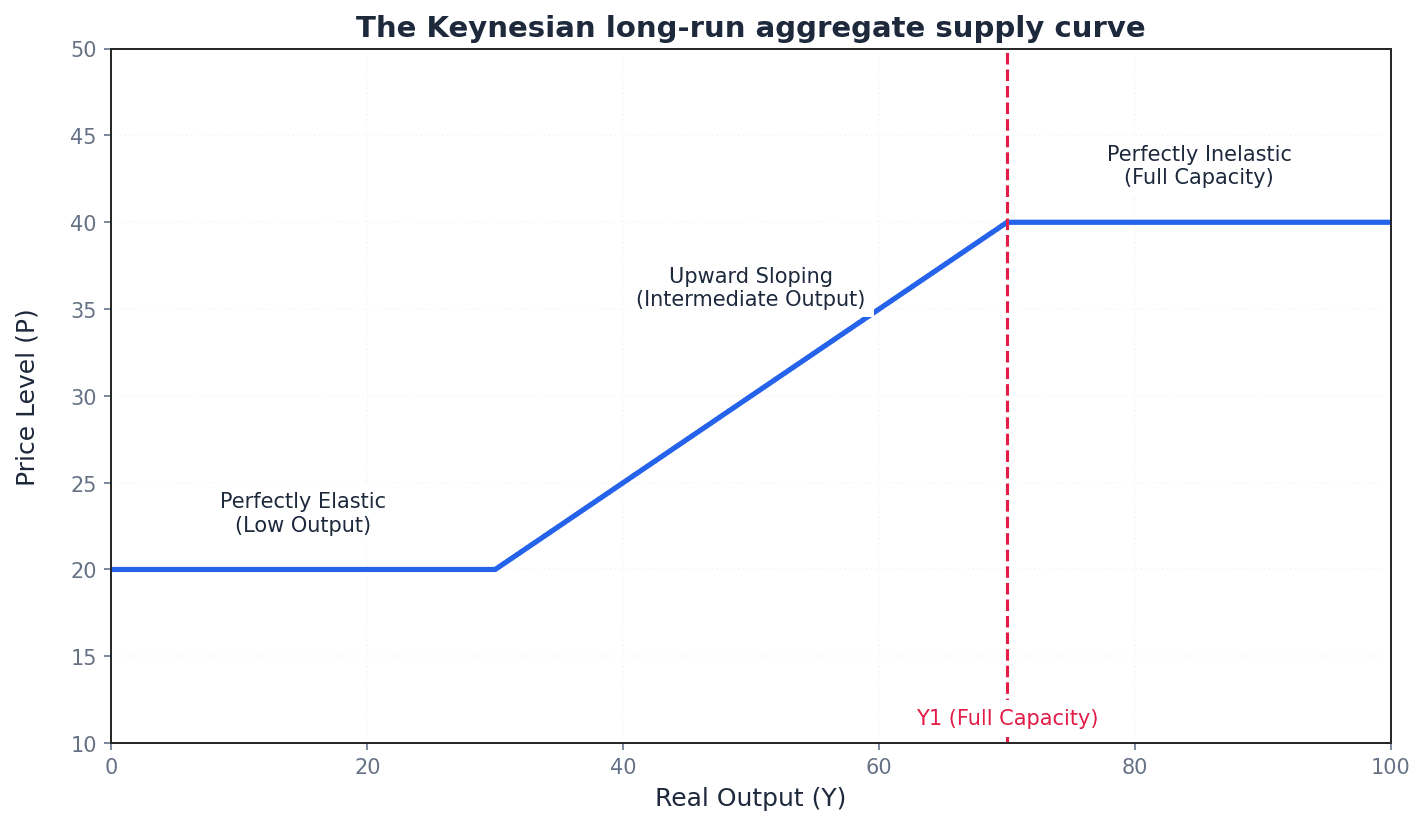
The Keynesian LRAS curve has three distinct sections. At very low levels of output, it is perfectly elastic (horizontal), indicating significant spare capacity where output can increase without price level changes. As the economy approaches full capacity, it becomes upward sloping, reflecting rising costs. Finally, at full capacity, it becomes perfectly inelastic (vertical), as no more output can be produced, regardless of price level changes.
Shifts in the LRAS curve represent changes in the economy's productive potential. These shifts are caused by changes in the quantity or quality of factors of production. Examples include technological advancements, improvements in education and training (increasing labour quality), discovery of new natural resources, or an increase in the capital stock through investment. A rightward shift indicates an increase in potential output.
Macroeconomic equilibrium — The equilibrium level of output and the price level are determined where aggregate demand is equal to aggregate supply.
This is the point where the AD and AS curves intersect, representing a stable state where the total quantity of goods and services demanded equals the total quantity supplied. Any deviation from this point will lead to market forces pushing the economy back to equilibrium. Imagine a tug-of-war between all the buyers (AD) and all the sellers (AS) in an economy; macroeconomic equilibrium is when the forces are balanced.
Students often think equilibrium means full employment, but actually macroeconomic equilibrium can occur at any level of output, including below full employment, especially in the Keynesian model.
Always label the equilibrium point clearly on AD/AS diagrams with the equilibrium price level (P) and real output (Y). When analysing shifts, show the movement from the initial to the new equilibrium.
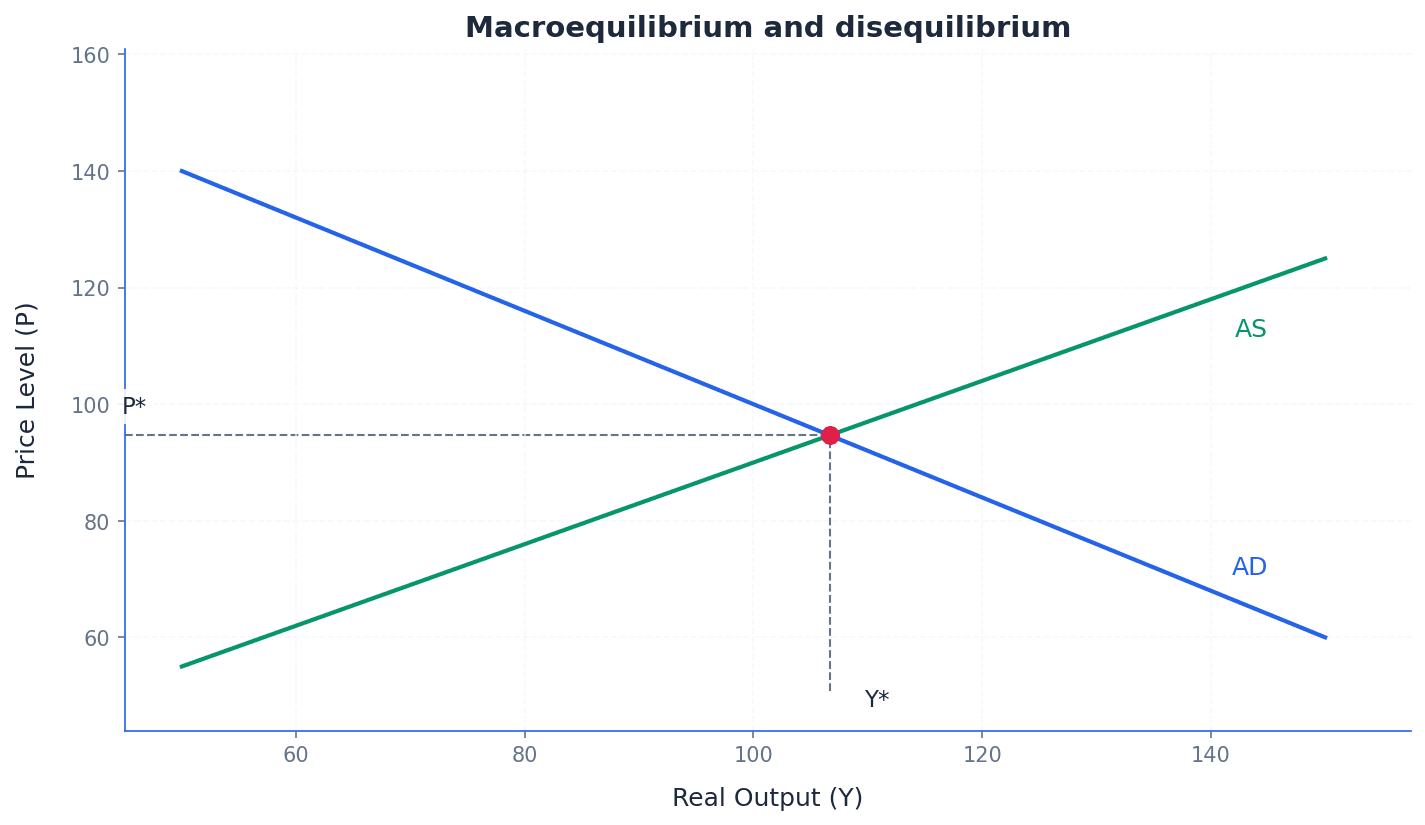
Shifts in either the AD or AS curves will alter the macroeconomic equilibrium, leading to changes in the price level, real output, and employment. For instance, an increase in AD will typically lead to a higher price level and higher real output in the short run, potentially increasing employment. A decrease in SRAS, perhaps due to rising input costs, would lead to a higher price level and lower real output, potentially increasing unemployment.
Real output — Real output refers to the level of goods and services produced in an economy, adjusted for inflation.
It is a measure of the actual volume of production, reflecting the economy's productive capacity and resource utilization, rather than just the monetary value of output. It is often represented by real GDP. If you produce 10 apples this year and 12 apples next year, your real output of apples has increased, regardless of whether the price of apples changed.
Students often confuse real output with nominal output, but actually real output removes the effect of price changes, giving a true picture of production volume.
Always label the x-axis of AD/AS diagrams as 'Real Output' or 'Real GDP' to indicate that you are measuring the actual quantity of goods and services produced.
Price level — The price level refers to the average of current prices across the entire spectrum of goods and services produced in an economy.
It is a measure of the overall level of prices, often represented by a price index like the Consumer Price Index (CPI) or GDP deflator. Changes in the price level indicate inflation or deflation. Think of the price level as the average cost of a typical shopping basket for everyone in the country; if that average cost goes up, the price level has risen.
Students often confuse the price level with the price of a single good, but actually it's an aggregate measure of all prices in the economy.
Always label the y-axis of AD/AS diagrams as 'Price Level' or 'General Price Level' to distinguish it from the price of an individual product.
Always use a diagram to support your explanation. Draw it large, label all axes and curves, and clearly show the initial and new equilibrium points after a shift.
When explaining a shift, use a clear chain of reasoning. State the initial cause, which curve shifts and why, and the final impact on the price level and real GDP.
Be precise about the difference between a short-run and a long-run change. A change in oil prices shifts SRAS; a change in technology shifts LRAS.
Advantages & Disadvantages
Using expansionary fiscal policy (e.g., increased government spending) to boost aggregate demand
Using monetary policy (e.g., lower interest rates) to boost aggregate demand
Evaluation Starters
Essay Structure Guide
Introduction
Begin by defining Aggregate Demand (AD) and Aggregate Supply (AS) and briefly stating their components. Introduce the concept of macroeconomic equilibrium as the interaction of these two forces. State the main arguments you will present regarding the effects of shifts in AD and AS.
Conclusion
Summarise the main findings regarding how AD and AS interact to determine macroeconomic equilibrium. Reiterate the key differences between short-run and long-run effects and between different schools of thought (Keynesian vs. New Classical). Conclude with a final evaluative statement on the complexity of macroeconomic analysis and policy implementation.
This chapter defines economic growth as an increase in an economy's output, measured by changes in real GDP. It explains how to adjust for inflation to distinguish between nominal and real GDP, and analyses the causes of economic growth, including increases in aggregate demand and improvements in the quantity and quality of resources. The chapter also discusses the associated costs and benefits of economic growth.
Economic growth — Economic growth is an increase in an economy’s output.
It is a key indicator of macroeconomic performance, measured as the annual percentage change in output. For people to enjoy more goods and services, output must increase by more than population growth, leading to an increase in GDP per head. Imagine a baker who makes more loaves of bread this year than last year; the increase in the number of loaves represents economic growth for their bakery.
Students often confuse economic growth with economic development, but actually economic growth is an increase in output, while economic development is a broader process of improving people's economic well-being and quality of life.
When asked to 'define' economic growth, state clearly that it is an increase in an economy's output. For 'explain' questions, elaborate on how it is measured and its distinction from economic development.
Nominal (or money) GDP — Nominal (or money) GDP is GDP measured in terms of the prices operating in the year in which output is produced.
It is also referred to as GDP at current prices and is a measure that has not been adjusted for changes in the price level. A rise in nominal GDP can be misleading as it may reflect only price increases, not actual output increases. If you earn 110 next year, your nominal income has increased. But if prices also rose by 10%, your real purchasing power hasn't changed.
Students often think a rise in nominal GDP always means more goods and services are being produced, but actually it could simply mean prices have risen.
When comparing GDP over time, always specify if you are referring to nominal or real GDP. Examiners look for the understanding that nominal GDP is unadjusted for inflation.
Real GDP — To calculate real GDP, economists measure GDP at constant prices (the prices operating in a selected year).
This ensures the effect of inflation, which distorts nominal GDP, is removed, providing a truer picture of changes in actual output. It is calculated by adjusting nominal GDP using a price index. If a baker sells 100 loaves for 500 total) and next year sells 100 loaves for 600 total), their nominal revenue increased. But if we use last year's prices, their real revenue (output) remained $500, showing no real growth.
Students often think real GDP is simply a higher value than nominal GDP, but actually real GDP is adjusted for inflation to reflect actual changes in output, which can be lower than nominal GDP if prices have risen.
GDP deflator — The price index used to convert nominal into real GDP is called the GDP deflator, which measures the prices of products produced, rather than consumed, in a country.
It includes the prices of capital goods as well as consumer products and includes the price of exports but excludes the price of imports. This makes it a comprehensive measure of price changes for domestically produced goods and services. Think of the GDP deflator as a special magnifying glass that shows you how much of the change in GDP is due to actual growth in production versus just rising prices for everything made in the country.
Students often think the GDP deflator is the same as the Consumer Price Index (CPI), but actually the GDP deflator measures prices of all domestically produced goods and services (including capital goods and exports), while CPI measures prices of goods and services consumed by households (including imports).
When discussing price indices, differentiate the GDP deflator from other measures like CPI by specifying what it includes (capital goods, exports) and excludes (imports).
Real GDP calculation
Used to remove the effect of inflation from nominal GDP to get a true measure of output changes.
When asked to 'calculate' real GDP, ensure you use the correct formula and clearly show the adjustment for the price index. For 'explain' questions, highlight its importance in reflecting actual output changes.
Economic growth is measured as the annual percentage change in an economy's output, specifically real GDP. To accurately reflect changes in the actual volume of goods and services produced, nominal GDP must be adjusted for inflation using a price index like the GDP deflator. This adjustment provides a truer picture of whether the economy is producing more, rather than just experiencing higher prices.
Recession — A decline in real GDP over two consecutive quarters (six months) or more is called a recession.
A country's output may decline as a result of a decrease in aggregate demand or a decrease in aggregate supply. It signifies a significant contraction in economic activity. Imagine a car that usually travels at 60 mph, but for two months in a row, its speed drops to 40 mph or less; that sustained slowdown is like a recession for the car's journey.
Students often think any fall in GDP is a recession, but actually a recession is specifically defined as a decline in real GDP for two or more consecutive quarters.
When defining a recession, ensure you include both 'decline in real GDP' and 'two consecutive quarters or more' for full marks. For 'analyse' questions, link it to decreases in aggregate demand or supply.
Economic growth can stem from two main sources: increases in aggregate demand (short-run growth) or improvements in the quantity and quality of resources, leading to an increase in productive capacity (long-run growth). Short-run growth occurs when an economy utilizes its existing spare capacity more fully, while long-run growth expands the economy's potential output.
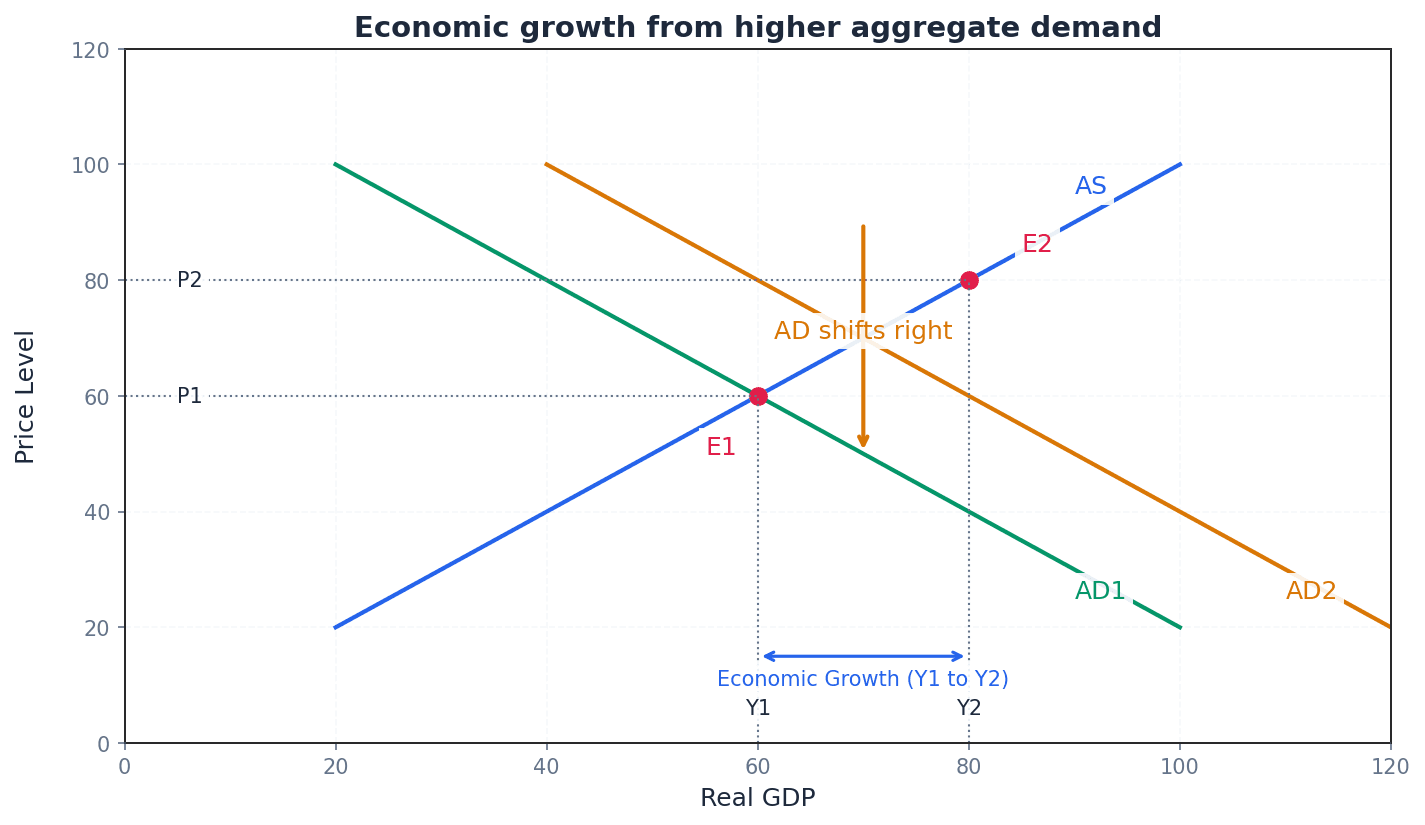
Short-run economic growth is primarily driven by an increase in aggregate demand (AD). This occurs when there is an increase in consumption, investment, government spending, or net exports, leading to a movement along the aggregate supply curve and a rise in real GDP, assuming there is spare capacity in the economy.
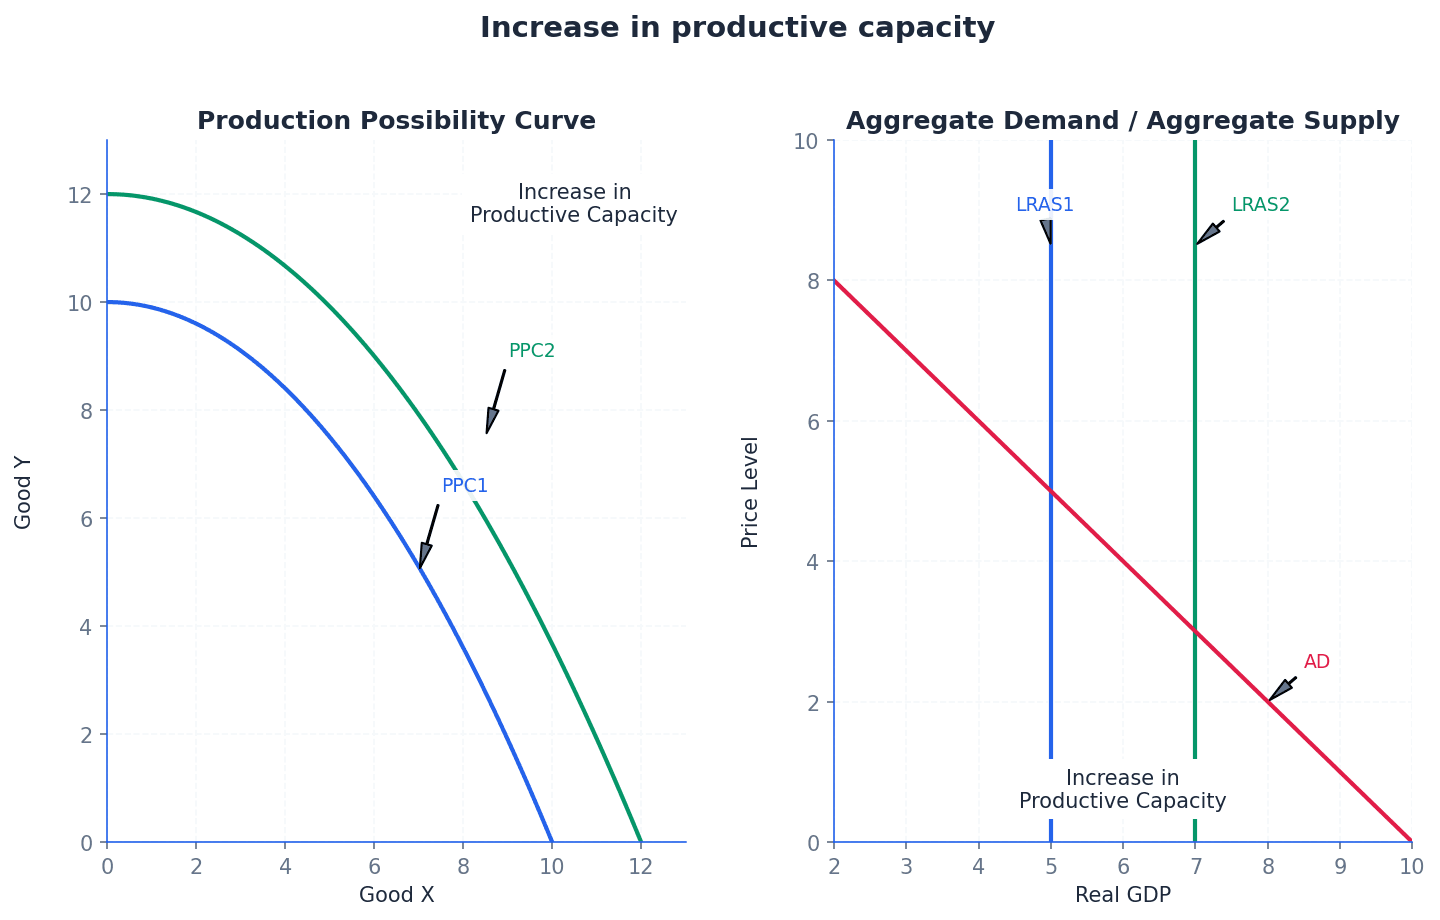
Long-run economic growth is achieved through an increase in the economy's productive capacity, represented by a rightward shift of the Long-Run Aggregate Supply (LRAS) curve or the Production Possibility Curve (PPC). This can result from an increase in the quantity of resources, such as a larger labour force or more capital, or an improvement in the quality of resources, such as better education and technology.
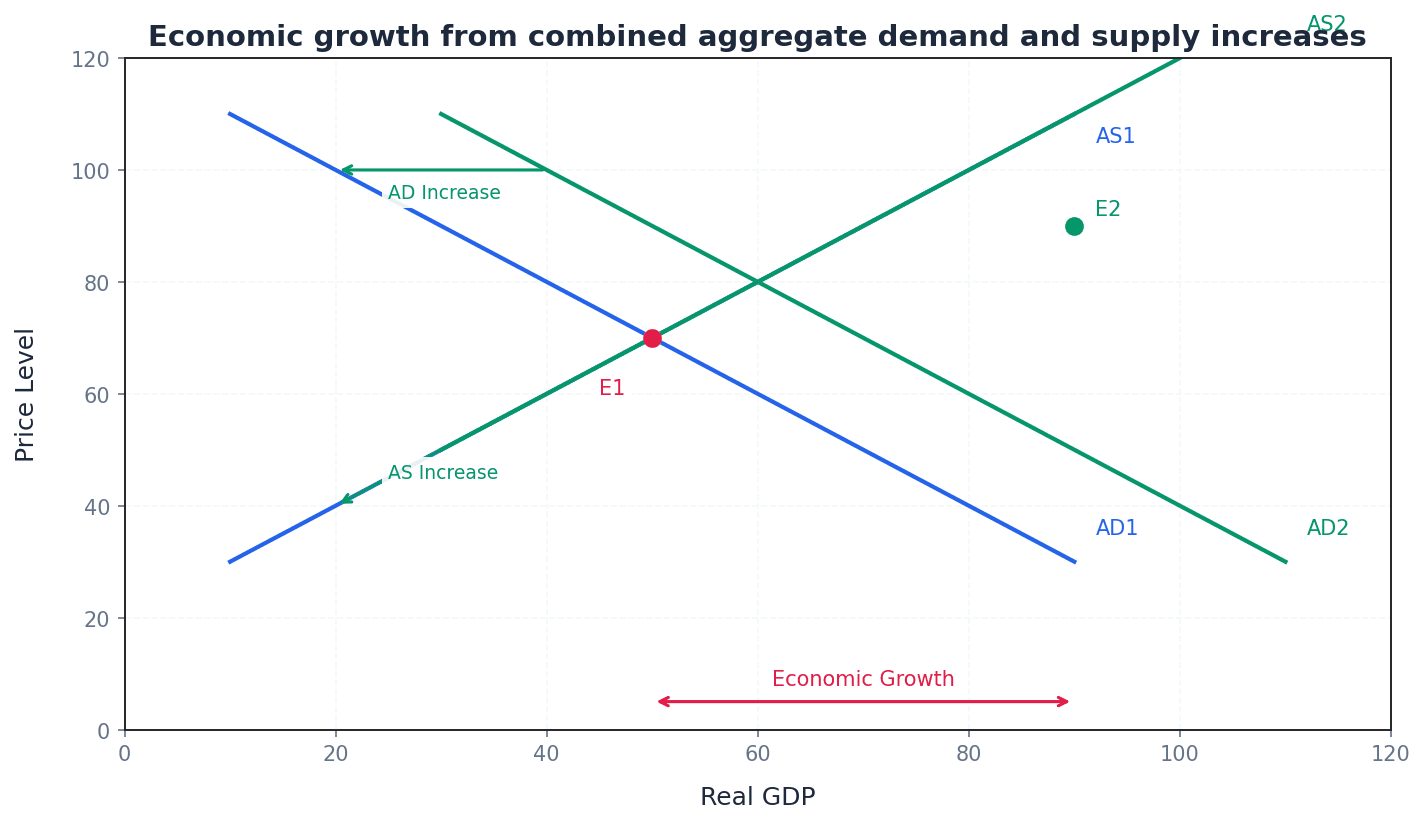
Sustainable long-term economic growth often involves both increases in aggregate demand and improvements in productive capacity. An increase in AD can utilize new capacity, while investments that boost productive capacity can also stimulate AD. This combined effect leads to both higher output and potentially stable prices.
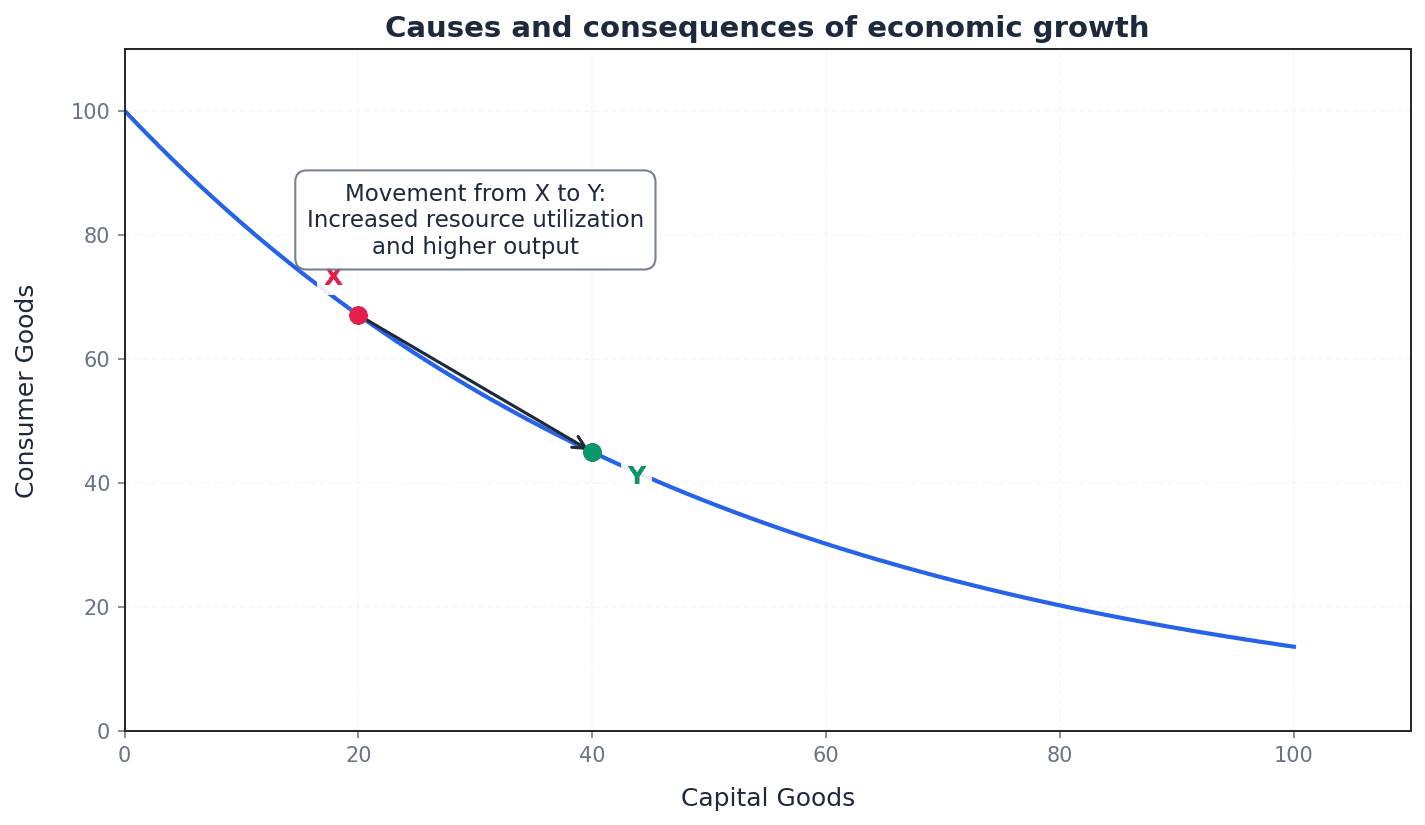
Students often fail to distinguish between economic growth caused by increased aggregate demand and that caused by increased productive capacity.
Always use diagrams. Illustrate short-run growth with a rightward AD shift and long-run growth with a rightward LRAS or PPC shift.
For 'evaluate' or 'discuss' questions, always present a balanced argument covering both the costs and benefits of economic growth.
When analysing causes, clearly separate short-run factors (affecting AD) from long-run factors (affecting productive capacity/AS).
Advantages & Disadvantages
Economic Growth
Evaluation Starters
Essay Structure Guide
Introduction
Begin by defining economic growth as an increase in an economy's real output over time, measured by real GDP. Briefly state the main causes (AD and AS factors) and acknowledge the existence of both benefits and costs, setting the stage for a balanced discussion.
Conclusion
Summarise the main arguments, reiterating that while economic growth is generally desirable for improving living standards, it comes with trade-offs. Conclude by stressing the importance of sustainable and inclusive growth policies to maximise benefits and minimise costs.
This chapter defines unemployment as individuals willing and able to work but unable to find a job, distinguishing them from the economically inactive. It explores various measurement methods, including the claimant count and labour force survey, and analyses the different types of unemployment such as frictional, structural, and cyclical. Finally, the chapter discusses the significant consequences of unemployment for individuals, firms, and the economy as a whole.
Unemployment — Unemployment occurs when people who are willing and able to work cannot find a job.
This definition specifically excludes individuals not seeking employment, such as children, retirees, students, or homemakers. The unemployed are considered part of the labour force, representing an unused economic resource, much like idle machines in a factory ready to produce but lacking orders.
Economically inactive — People who are not working and trying to find employment are said to be economically inactive.
This group includes individuals of working age who are not part of the labour force, such as full-time students, early retirees, homemakers, or those too unwell to work. They are distinct from the unemployed because they are not actively seeking employment, similar to spectators in a sports stadium who are present but not participating in the game.
Students often confuse the economically inactive with the unemployed. Remember that the unemployed are actively seeking work, while the economically inactive are not part of the labour force.
When asked to define unemployment, ensure you include both 'willing and able to work' and 'cannot find a job' to achieve full marks. Distinguish it from being economically inactive.
Economically active — Anyone in the labour force is said to be economically active.
This group comprises all people who can contribute to the production of goods and services, including both those currently employed and those who are unemployed but actively seeking work. They represent the available human resources in an economy, much like all the students and teachers actively participating in learning and teaching in a school.
Labour force — The labour force in an economy is defined as the total number of workers who are available for work.
It includes all people who are employed and those who are unemployed but actively seeking employment. The size of a country's labour force is influenced by demographic, economic, social, and cultural factors, similar to a football team's squad which includes players on the field and those on the bench ready to play.
Labour force participation rate — The labour force participation rate refers to the percentage of the total population of working age who are actually classified as being part of the labour force.
This rate indicates the proportion of the potential workforce that is either employed or actively seeking employment. Factors like higher education participation or early retirement can influence this rate. For example, if 60 out of 100 working-age students are working or looking for a job, the rate is 60%.
Students often think 'economically active' only refers to those with jobs, but actually it includes both employed and unemployed individuals who are part of the labour force.
Level of unemployment — The level of unemployment refers to the total number of workers who are unemployed.
This is an absolute figure, representing the raw count of individuals without jobs but willing and able to work. It provides a snapshot of the total number of people affected at a specific point in time, like counting the exact number of empty seats in a cinema.
Unemployment rate — The unemployment rate is the number of unemployed people as a percentage of the labour force.
This is a key indicator of the health of an economy, showing the proportion of the available workforce that is not employed. It allows for easier comparison between different economies or over time, similar to how an absence rate of 10% means 10 out of 100 students are absent.
Unemployment rate
Used to calculate the percentage of the labour force that is unemployed. The denominator, 'Number of people in the labour force', is crucial for accurate calculation.
Students often confuse the 'level' with the 'rate' of unemployment. The level is the absolute number of unemployed people, while the rate is a percentage.
Always remember the denominator for the unemployment rate is the 'labour force', not the total population or working-age population, to avoid calculation errors.
Unemployment is measured using different methods, each with its own advantages and disadvantages. The two primary measures are the claimant count and the labour force survey. Understanding these methods is crucial for interpreting unemployment data accurately.
Claimant count measure — The claimant count measure counts as unemployed those who register as unemployed in order to claim unemployment benefits.
This method is relatively cheap and quick to calculate as it uses existing administrative data. However, it may not accurately reflect the true extent of unemployment, potentially overstating or understating the figure, much like counting people who sign up for a free meal, which might miss some in need or include some not truly in need.
Labour force survey measure — The labour force survey measure involves conducting a survey asking people if they are employed, unemployed or economically inactive.
This method typically uses the International Labour Organisation (ILO) definition of unemployment, which includes people of working age without work, available for work, and seeking paid employment. It is generally considered more comprehensive and suitable for international comparisons, similar to conducting a thorough door-to-door census.
When evaluating the claimant count, discuss both its advantages (cost, speed) and disadvantages (accuracy issues like understating due to non-claimants or overstating due to benefit fraud).
Discouraged workers — Discouraged workers are people who leave the labour force because they give up on the chances of finding a job.
These individuals were previously unemployed and actively seeking work but have become so disheartened by their lack of success that they stop looking. They are then classified as economically inactive, which can artificially lower the official unemployment rate, much like someone giving up on catching a bus that never comes.
Students often think discouraged workers are still counted as unemployed, but actually once they stop actively seeking work, they are classified as economically inactive and are no longer part of the labour force.
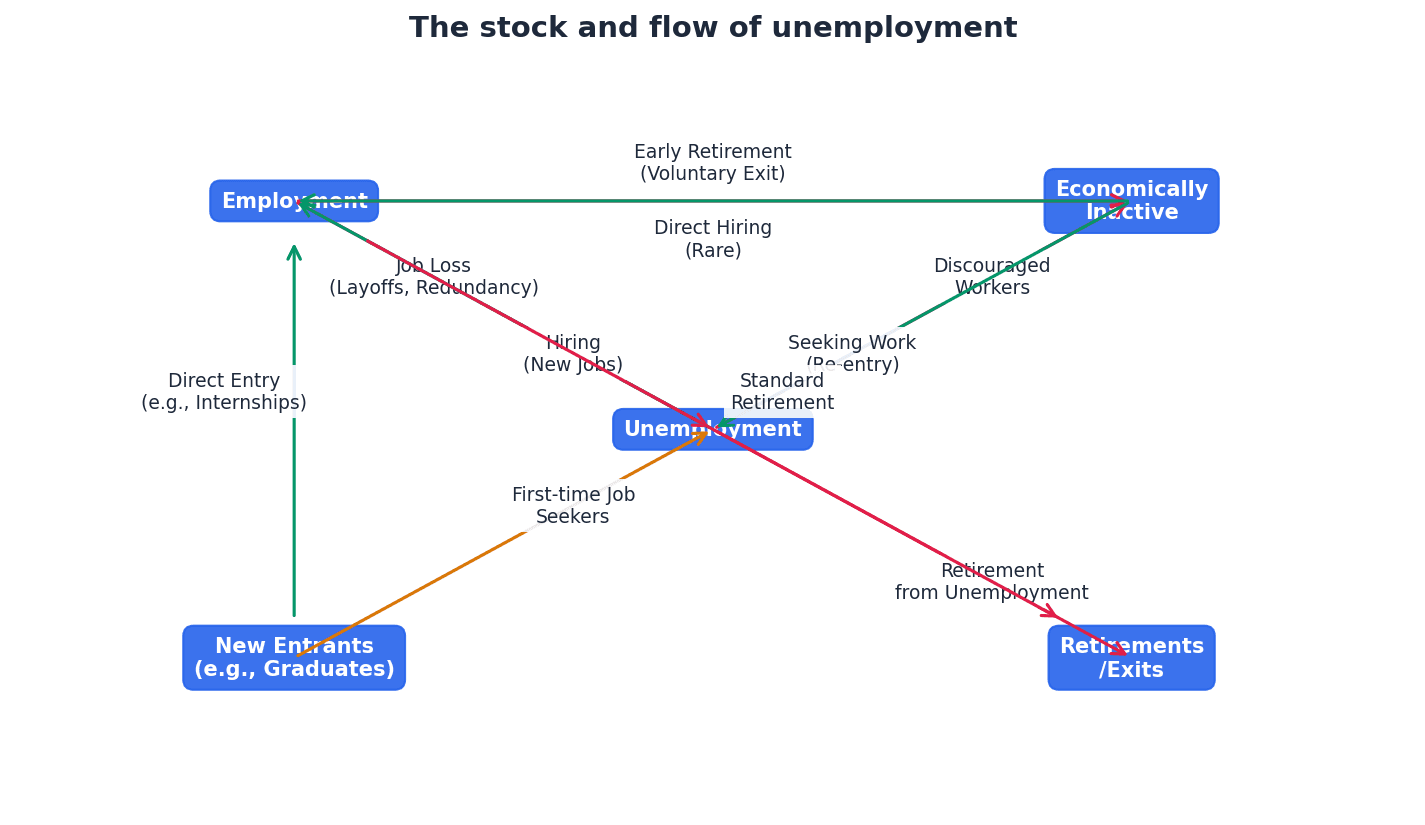
Unemployment is not a monolithic phenomenon; it arises from various causes, leading to different types. These include frictional, structural, and cyclical unemployment, each requiring distinct policy responses. Understanding these distinctions is key to effective economic management.
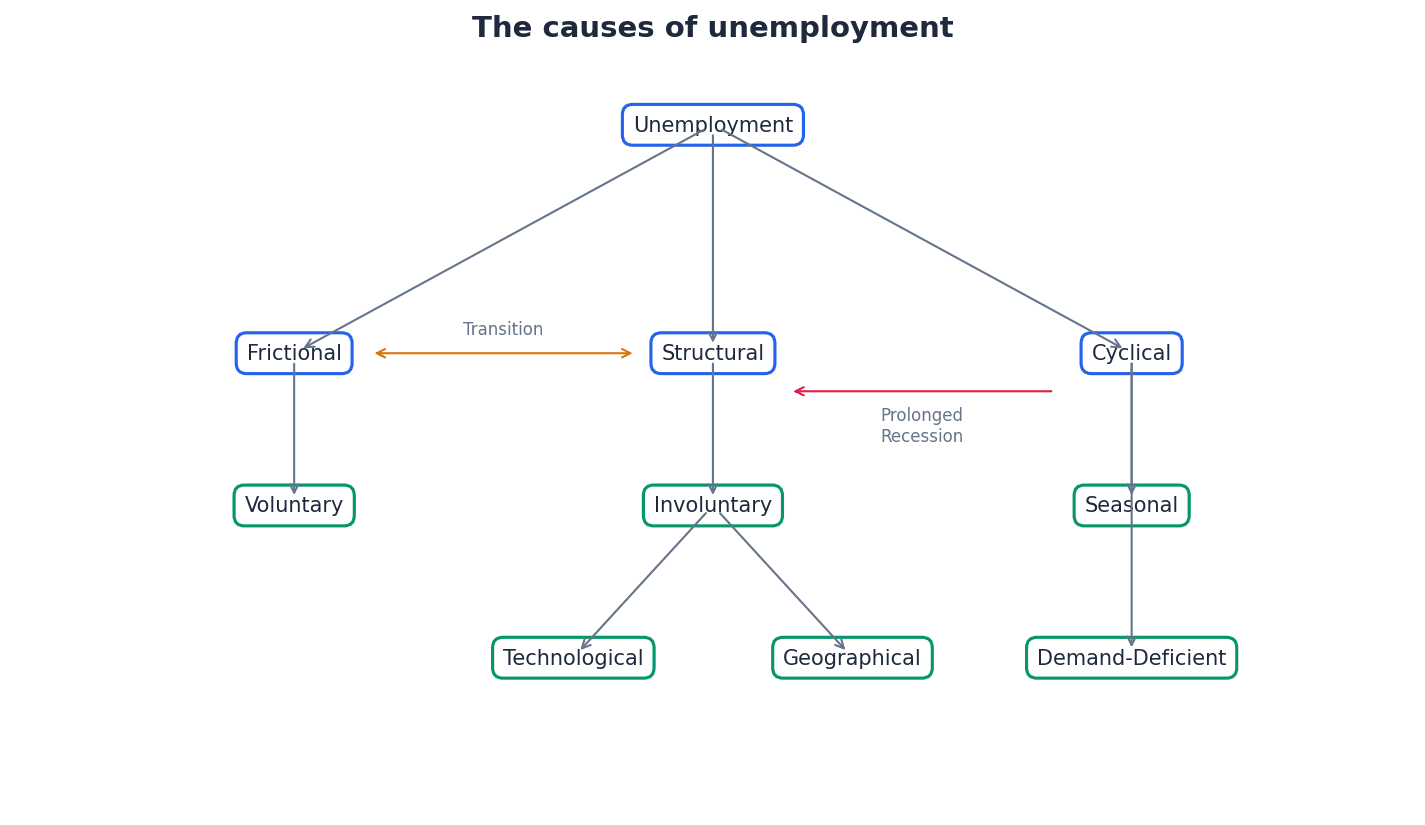
Frictional unemployment — Frictional unemployment is unemployment that arises when workers are between jobs.
This type of unemployment is short-term and unavoidable in a dynamic economy, as people naturally take time to search for new jobs after leaving or losing old ones. It includes voluntary, search, casual, and seasonal unemployment, much like the brief pause between two songs on a playlist.
Students often think all unemployment is bad, but actually a certain level of frictional unemployment is considered healthy and unavoidable in a changing economy, allowing for better job matching.
Voluntary unemployment — Voluntary unemployment occurs when workers are not willing to accept jobs at the current wage rate and working conditions.
This is a form of frictional unemployment where individuals choose to remain unemployed, often because they are holding out for better pay or conditions, or because unemployment benefits are sufficiently high to disincentivise taking low-wage jobs. An example is refusing a cashier job because one believes they can find a better-paying manager role.
Search unemployment — Search unemployment arises when workers do not accept the first job or jobs on offer, but spend some time looking for a better-paid job.
This is another form of frictional unemployment, where individuals invest time and effort in searching for a job that best matches their skills and preferences, rather than taking the first available position. Improved labour market information can reduce this, similar to shopping for a new phone by comparing models and prices.
Casual unemployment — Casual unemployment refers to workers who are out of work between periods of employment including, for example, actors, supply teachers and construction workers.
This is a type of frictional unemployment common in industries with irregular or project-based work. Workers in these sectors frequently move between short-term contracts, leading to intermittent periods of unemployment, much like a freelance photographer between gigs.
Seasonal unemployment — Seasonal unemployment occurs when demand for workers fluctuates according to the time of the year.
This type of frictional unemployment affects industries like tourism, agriculture, and construction, where activity levels vary significantly with the seasons. Workers are employed during peak seasons and laid off during off-peak times, similar to staff at a ski resort being laid off in summer.
Structural unemployment — Structural unemployment arises due to changes in the structure of the economy.
This occurs when there is a mismatch between the skills, qualifications, experience, or geographical location of unemployed workers and the requirements of available job vacancies. It is often long-term and can result from technological advancements, shifts in consumer demand, or international competition, like miners becoming unemployed when a coal mine closes and new jobs are for software engineers.
Students often think structural unemployment is easily solved, but actually it requires significant retraining or relocation, making it a more persistent and serious problem than frictional unemployment.
Regional unemployment — Regional unemployment occurs when declining industries are concentrated in a particular area or areas of the country.
This is a form of structural unemployment where a specific region experiences high unemployment due to the decline of its dominant industry, leading to a lack of suitable job opportunities for the local workforce. An example is a town experiencing high unemployment after a major car manufacturing plant closes.
Technological unemployment — Technological unemployment occurs when people are out of work due to the introduction of labour-saving techniques.
This is a type of structural unemployment where automation, robotics, or other technological advancements replace human labour, leading to job losses in affected industries. Workers may need to acquire new skills to find employment, such as cashiers losing jobs due to self-checkout machines.
International unemployment — International unemployment occurs when workers lose their jobs because demand switches from domestic industries to more competitive foreign industries.
This is a form of structural unemployment resulting from globalisation and international trade. Domestic industries may decline due to cheaper imports or foreign competition, leading to job losses in the home country, for instance, steel workers losing jobs because consumers buy cheaper foreign steel.
Cyclical unemployment — Cyclical unemployment or demand-deficient unemployment, arises due to a lack of aggregate demand.
This type of unemployment affects the whole economy during economic downturns or recessions, as firms reduce output and lay off workers due to insufficient consumer spending and investment. It is often widespread across various industries, similar to a restaurant cutting staff hours during a slow season due to fewer customers.
Demand-deficient unemployment — Demand-deficient unemployment arises due to a lack of aggregate demand.
This is another term for cyclical unemployment, emphasising that the root cause is insufficient overall spending in the economy. When aggregate demand falls, firms reduce production and consequently require less labour, leading to job losses, such as car manufacturers laying off workers if everyone stops buying new cars.
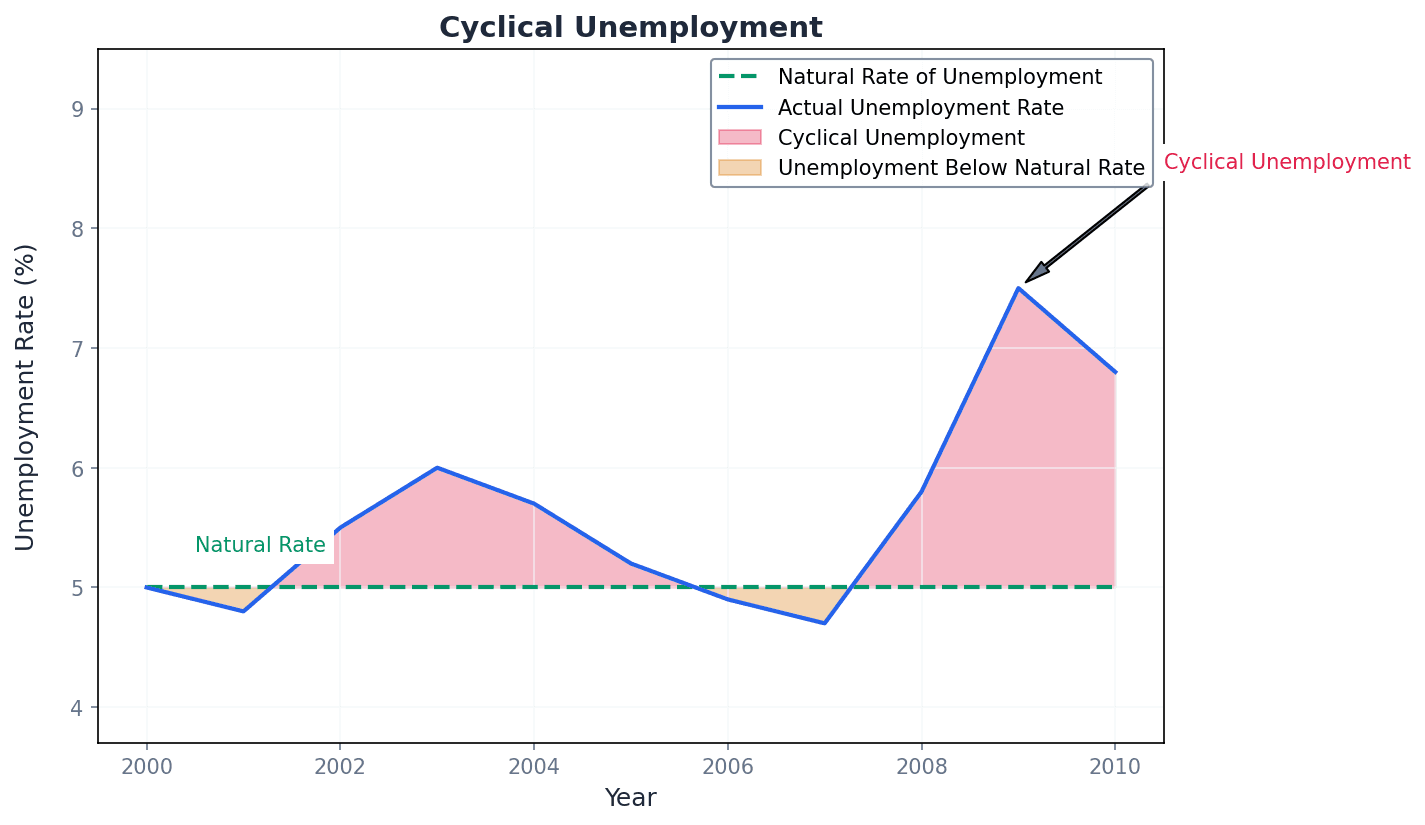
Students often confuse cyclical unemployment with structural unemployment. Cyclical is caused by a temporary lack of overall demand, while structural is due to a mismatch of skills or location.
When explaining cyclical unemployment, link it directly to the business cycle and aggregate demand, and use a labour market diagram to illustrate how a fall in aggregate demand for labour leads to job losses.
Unemployment has significant and far-reaching consequences, impacting individuals, firms, and the economy as a whole. These effects range from personal financial hardship and skill erosion to reduced national output and increased government expenditure on benefits.
When discussing the consequences of unemployment, analyse the impact on multiple stakeholders: individuals, firms, and the government.
For policy questions, link the specific type of unemployment to the appropriate policy (e.g., supply-side policies for structural unemployment, demand-side for cyclical).
Advantages & Disadvantages
Claimant Count Measure of Unemployment
Labour Force Survey Measure of Unemployment
Evaluation Starters
Essay Structure Guide
Introduction
Begin by defining unemployment clearly, distinguishing it from economic inactivity. Briefly state the main types of unemployment and outline the scope of your essay, for example, by mentioning the causes and consequences you will discuss.
Conclusion
Summarise your main arguments regarding the causes, measurement, and consequences of unemployment. Reiterate the importance of understanding the different types of unemployment for effective policy-making. Offer a final evaluative statement on the overall significance of unemployment as a macroeconomic problem.
This chapter explores price stability, defining inflation, deflation, and disinflation, and detailing how inflation is measured using the Consumer Price Index. It differentiates between money values and real data, analyses the causes and consequences of both demand-pull and cost-push inflation, and discusses the distinct implications of good and bad deflation.
Price stability — Price stability occurs when prices rise by only a small percentage and there is an avoidance of fluctuations in the price level.
Governments aim for price stability because a low and stable inflation rate can encourage firms to expand, leading to higher national output, employment, and increased availability of goods and services for public spending. Imagine driving a car at a steady, comfortable speed on a smooth road, rather than constantly speeding up and slowing down or hitting potholes. Price stability is like that smooth ride for an economy.
Students often think price stability means zero inflation, but actually it means a low and stable positive inflation rate, typically around 2%.
Inflation — Inflation means that, on average, prices are rising at a particular rate.
When the price level increases, the value of money falls, and its purchasing power declines, meaning each unit of currency buys less than before. It does not mean every price is rising or at the same rate. Think of your pocket money: if prices for your favourite snacks go up, your pocket money buys fewer snacks than it used to, even if the amount of money hasn't changed.
Hyperinflation — Hyperinflation is generally considered to be an inflation rate that exceeds 50% a month, but the rate of inflation can go much higher.
This occurs when inflation gets out of control, often leading people to resort to barter as money loses its value rapidly, and usually necessitates the replacement of the currency. Imagine trying to buy a cup of coffee, and by the time you reach the counter, the price has doubled from what it was an hour ago. That's the extreme speed of price changes in hyperinflation.
Deflation — Deflation generally refers to a sustained fall in the price level.
This results in a rise in the value of money, with each currency unit having greater purchasing power, and involves a negative inflation rate. If you save up for a new gadget and then its price drops significantly, your savings can now buy more than you initially expected. That's like deflation for your money's purchasing power.
Disinflation — Disinflation occurs when the inflation rate falls but is still positive.
In this case, the price level is still rising, but at a slower rate than before, meaning the rate of increase in prices is slowing down. Imagine a car that was accelerating very quickly, but then starts to accelerate less quickly, even though it's still gaining speed. It's still moving faster, just not as rapidly as before.
Students often confuse disinflation with deflation, but actually disinflation means prices are still rising, just at a slower pace, while deflation means prices are actually falling.
Be precise with terminology: disinflation is a reduction in the *rate* of inflation, not a fall in the price level itself. Use examples like 'from 8% to 6%' to illustrate.
Changes in the price level are typically measured using the Consumer Price Index (CPI). This involves tracking the prices of a representative 'basket of goods and services' over time. The inflation rate is then calculated by comparing the price level in the current period to a previous period, often the same month of the previous year.
Inflation rate (year-on-year method)
Compares the price level of a given month with the same month of the previous year.
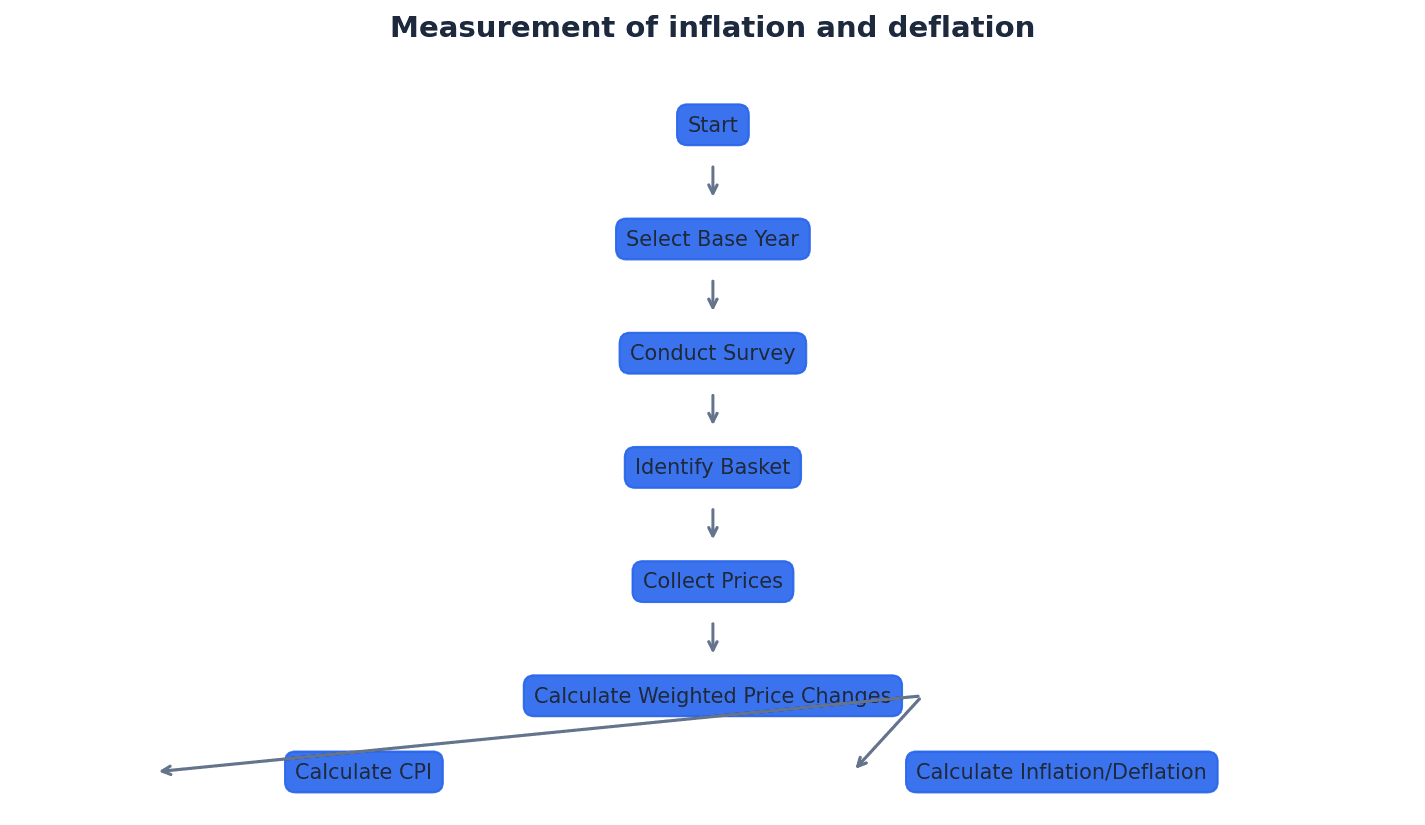
Measuring changes in the price level accurately presents several difficulties. These include the choice of a base year, ensuring the 'basket of goods and services' remains representative of typical household spending, and accounting for changes in product quality or the introduction of new goods. These factors can distort the true rate of inflation or deflation.
Money values — Money values, or nominal values, are the values of the prices operating at the time.
These values are not adjusted for inflation, representing the raw monetary figures without considering changes in purchasing power. If you earned 110 this year, 110 are your money values. They don't tell you if you can buy more or less.
Nominal values — Nominal values, or money values, are the values of the prices operating at the time.
These values are not adjusted for inflation, representing the raw monetary figures without considering changes in purchasing power. If you earned 110 this year, 110 are your nominal values. They don't tell you if you can buy more or less.
Real data — Real data is data in real terms, which has been adjusted for inflation.
This adjustment allows for a true comparison of purchasing power over time by removing the effect of price level changes. If your wages rose by 20% but inflation was 25%, your real wages actually fell. Real data tells you what you can *actually* buy, not just the number on your paycheck.
Students often think money values reflect actual purchasing power, but actually they only show the numerical amount, not what that amount can buy after accounting for inflation.
Always convert money values to real data when analysing changes in purchasing power or living standards over time, especially in essay questions involving inflation.
Real wages (conversion from money wages)
Used to adjust money wages for inflation to find their real purchasing power.
Change in real data (approximation)
Estimates the change in real terms by deducting the inflation rate from the change in the money value.
Inflation can arise from two primary sources: demand-pull and cost-push factors. Demand-pull inflation occurs when aggregate demand outstrips aggregate supply, while cost-push inflation results from increases in the costs of production. These two types can also be linked, as rising demand can lead to higher wages, which then become a cost-push factor.
Demand-pull inflation — Demand-pull inflation occurs when prices are 'pulled up' by increases in aggregate demand that are not matched by equivalent increases in aggregate supply.
This can result from a rise in consumer expenditure, government spending, investment, or net exports, especially when the economy is close to full capacity. Imagine a very popular new toy that everyone wants. If there aren't enough toys to go around, the store can raise the price because demand is so high.
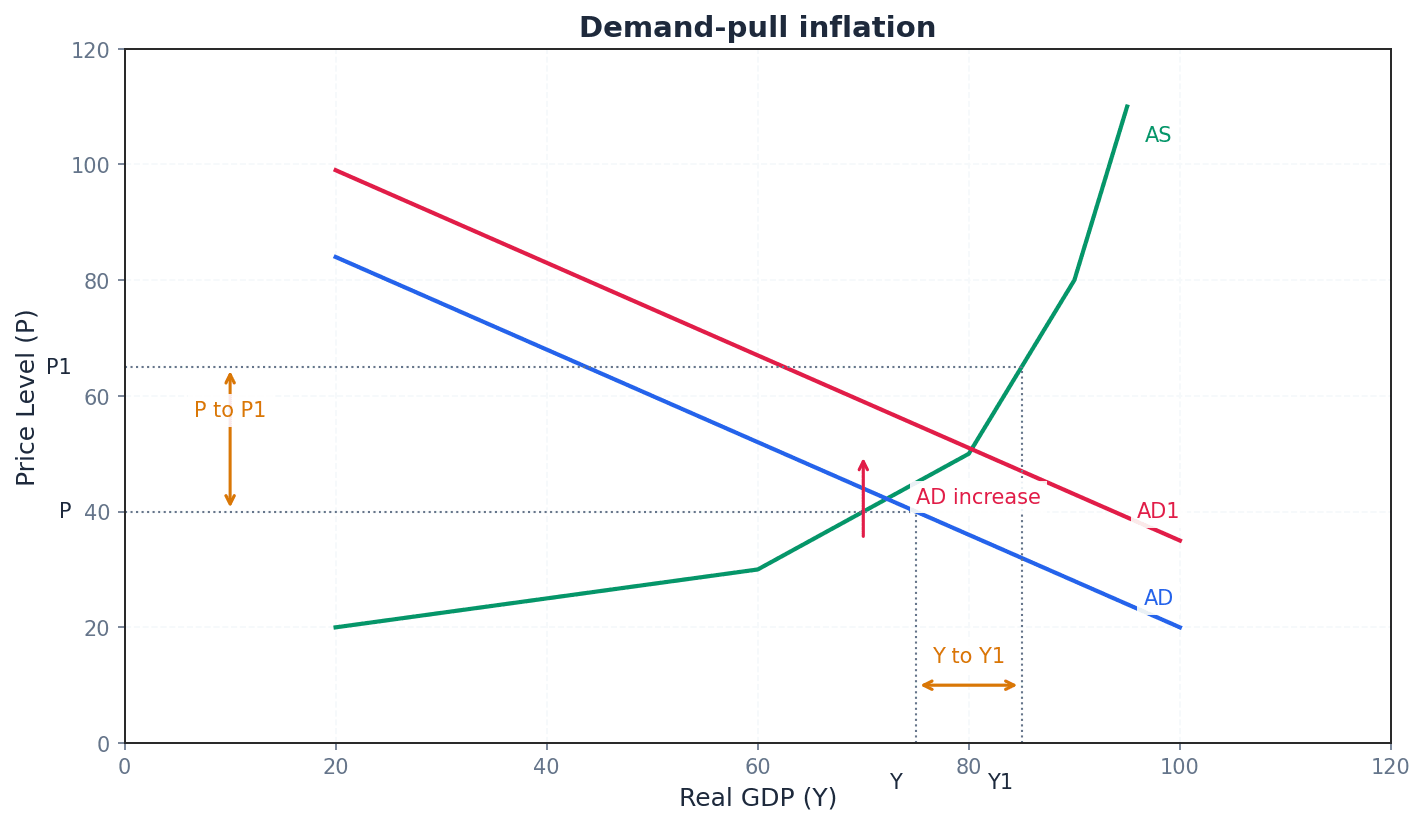
When explaining demand-pull inflation, use an AD/AS diagram to show a rightward shift of the AD curve, leading to a higher price level and higher real GDP. Mention the role of the economy's capacity.
Cost-push inflation — Cost-push inflation occurs when prices are pushed up by increases in the cost of production.
This type of inflation is typically caused by factors like rising wages (more than productivity), increased raw material or fuel costs, a fall in the exchange rate making imports more expensive, or increased profit margins. Imagine a baker whose flour and sugar costs suddenly double. To maintain profit, they have to raise the price of their bread, even if demand hasn't changed.
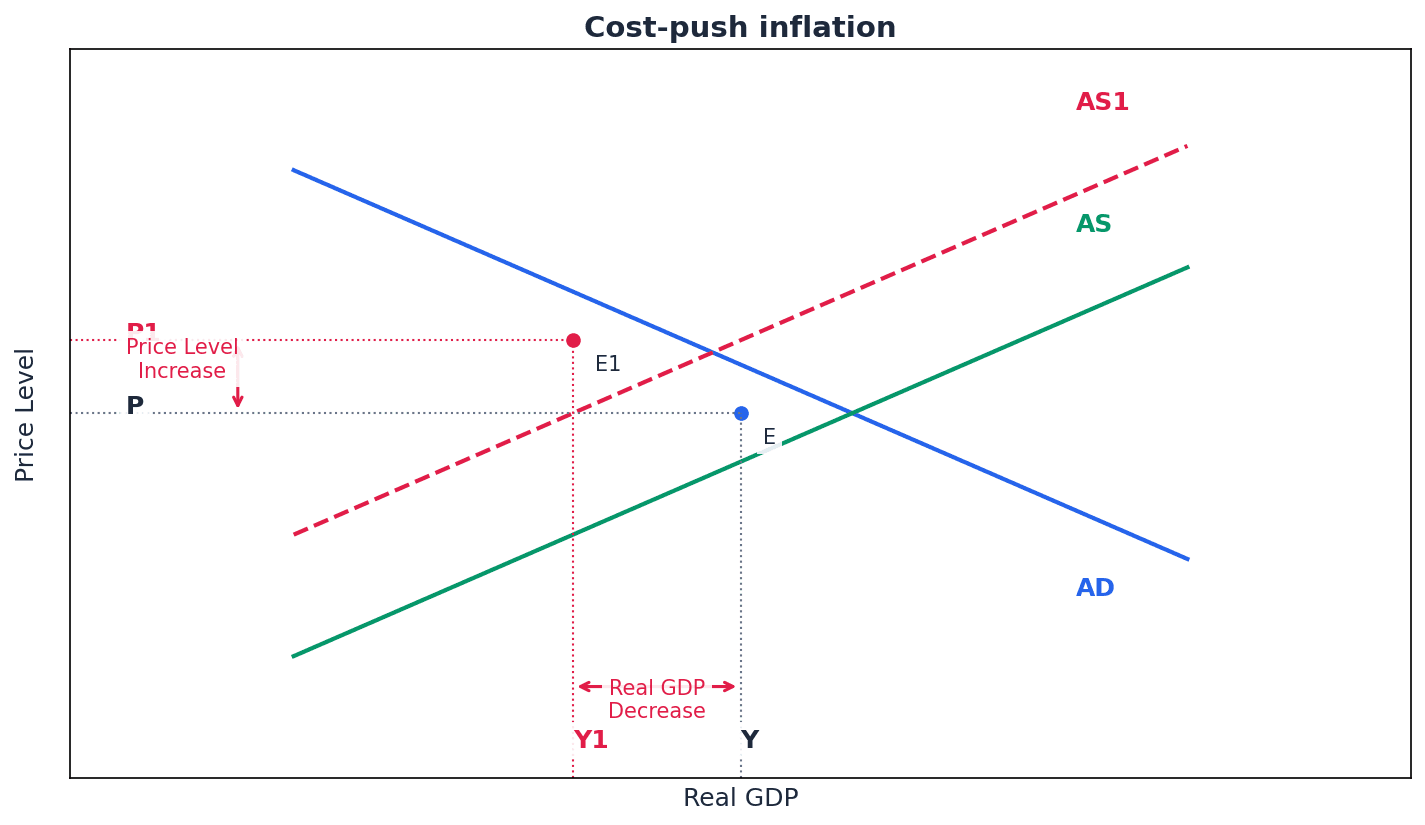
Students may assume all inflation is demand-pull, overlooking cost-push factors like rising input costs or exchange rate depreciation.
When explaining cost-push inflation, use an AD/AS diagram to show a leftward shift of the AS curve, leading to a higher price level and lower real GDP. Provide specific examples of rising costs.
Inflation has various consequences, both costs and potential benefits, which can affect different groups within an economy. The severity of these consequences often depends on the rate of inflation and whether it is anticipated or unanticipated. High and volatile inflation generally leads to greater economic disruption.
Menu costs — Menu costs are the costs involved in changing prices.
These costs affect firms, requiring changes to catalogues, price tags, bar codes, and advertisements, and also involve staff time and can be unpopular with customers. Think of a restaurant having to print new menus every week because food prices keep changing. That's a direct cost of inflation.
Shoe leather costs — Shoe leather costs are the costs involved in moving money from one financial institution to another in search of the highest rate of interest.
These costs arise as individuals and firms spend more time and effort managing their money to minimise the erosion of its value by inflation, leading to less efficient use of resources. Imagine literally wearing out your shoes walking from bank to bank to find the best interest rate to protect your savings from losing value. It's the effort and time spent on financial management.
Fiscal drag — Fiscal drag (also known as 'bracket creep') occurs when the income levels corresponding to different tax rates are not adjusted in line with inflation.
As a result, people and firms are 'dragged' into higher tax brackets even if their real income has not increased, leading to a higher proportion of their income being paid in tax. Imagine a ladder where the rungs (tax brackets) stay in the same place, but the ground (your income) keeps rising due to inflation. You'll climb to a higher rung and pay more tax, even if you can't buy more.
Bracket creep — Bracket creep (also known as 'fiscal drag') occurs when the income levels corresponding to different tax rates are not adjusted in line with inflation.
As a result, people and firms are 'dragged' into higher tax brackets even if their real income has not increased, leading to a higher proportion of their income being paid in tax. Imagine a ladder where the rungs (tax brackets) stay in the same place, but the ground (your income) keeps rising due to inflation. You'll climb to a higher rung and pay more tax, even if you can't buy more.
Inflationary noise — Inflationary noise (also called 'money illusion') arises when inflation causes consumers and firms to confuse price signals.
It makes it difficult to assess what is happening to relative prices, potentially leading consumers and firms to make incorrect decisions, such as increasing output when a price rise is due to inflation rather than increased demand. Imagine trying to hear a specific conversation in a very noisy room. Inflation is the 'noise' that makes it hard to distinguish real changes in demand or supply (the conversation) from general price increases.
Money illusion — Money illusion (also called 'inflationary noise') arises when inflation causes consumers and firms to confuse price signals.
It makes it difficult to assess what is happening to relative prices, potentially leading consumers and firms to make incorrect decisions, such as increasing output when a price rise is due to inflation rather than increased demand. Imagine trying to hear a specific conversation in a very noisy room. Inflation is the 'noise' that makes it hard to distinguish real changes in demand or supply (the conversation) from general price increases.
Students sometimes overlook the non-monetary costs of inflation, such as menu costs, shoe leather costs, and inflationary noise.
Deflation, a sustained fall in the price level, can be categorised into 'good' and 'bad' types, each with distinct causes and consequences. Understanding this distinction is crucial as their impacts on the economy differ significantly. Good deflation is generally beneficial, while bad deflation poses serious risks.
Good deflation — Good deflation occurs as a result of an increase in aggregate supply.
This type of deflation leads to a fall in the price level and a rise in real GDP, often driven by advances in technology or lower production costs, which can also increase employment and international competitiveness. Imagine a new invention makes producing smartphones much cheaper and more efficient. Prices fall, but more people can afford them, so more are sold, and the economy grows.
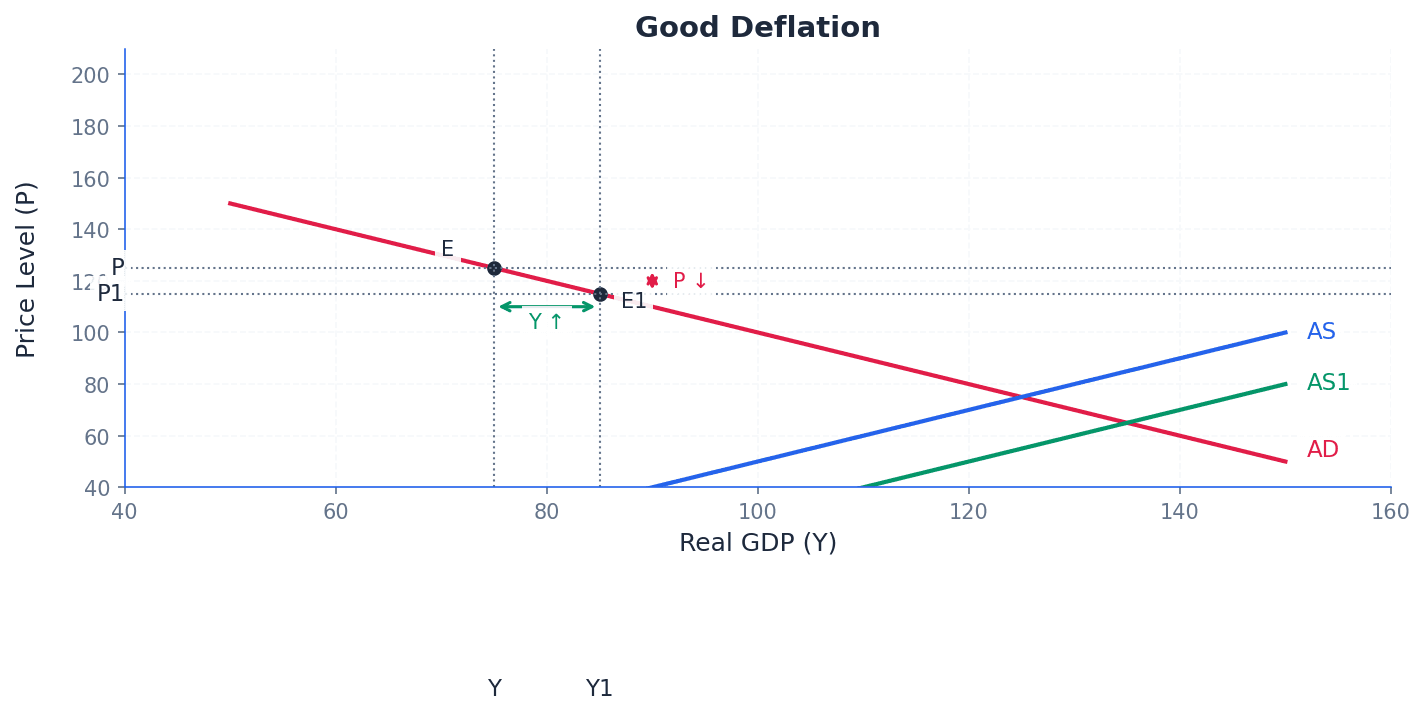
Bad deflation — Bad deflation takes place when the price level is driven down by a fall in aggregate demand.
This type of deflation results in falling output, potentially higher unemployment, and runs the risk of developing into a deflationary spiral where consumers delay purchases, firms reduce investment and employment, and debt burdens increase. Imagine a town where everyone suddenly loses their jobs and stops buying things. Shops lower prices to attract customers, but no one has money, so demand keeps falling, and more businesses close.
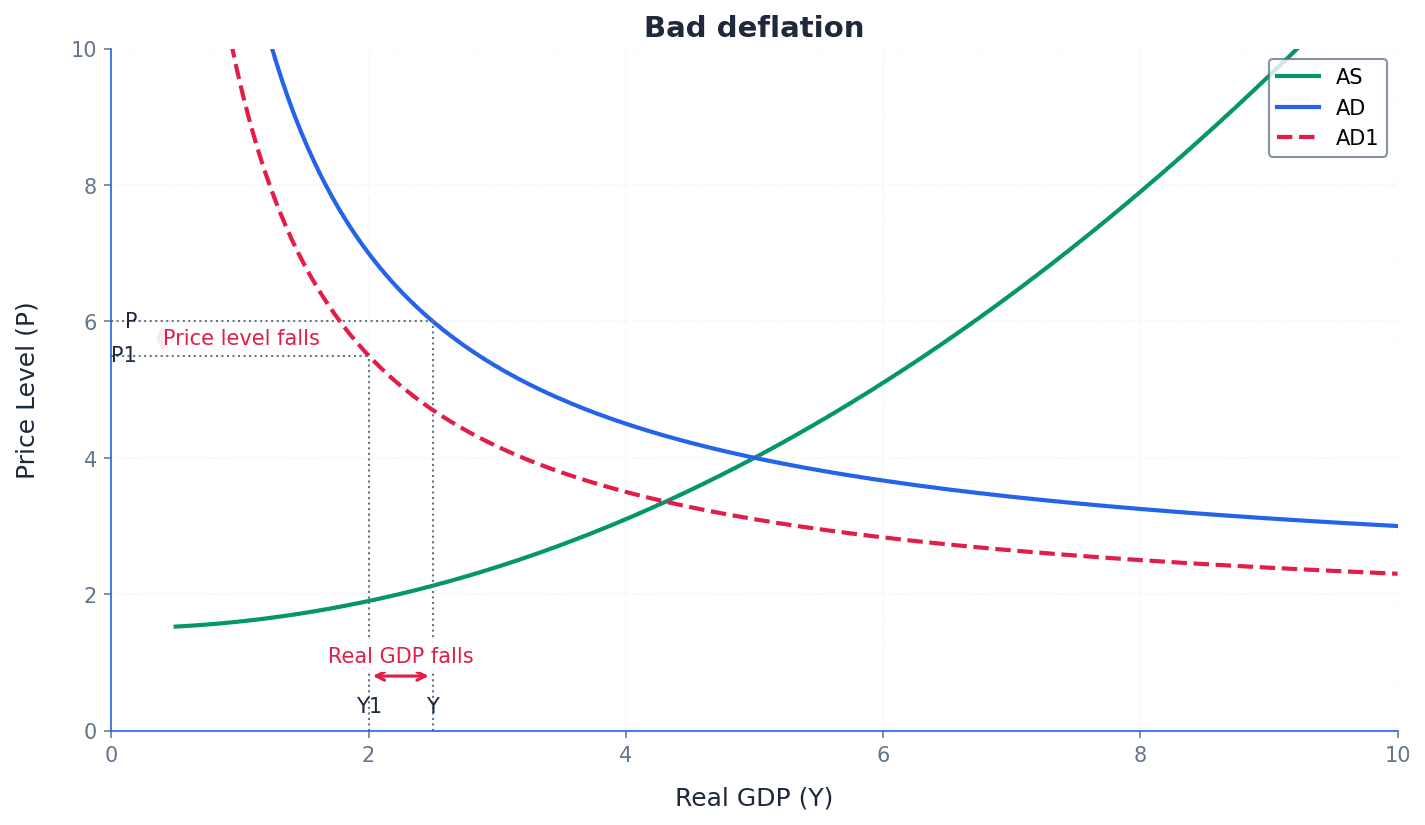
Students often assume all deflation is harmful, but actually good deflation is beneficial as it stems from increased productivity and efficiency, leading to higher output and lower prices.
When discussing deflation, always specify whether it is 'good' (AS-driven) or 'bad' (AD-driven) and use an AD/AS diagram to illustrate the rightward shift of the AS curve for good deflation.
When asked to discuss the objectives of government, remember to link price stability to its benefits for economic growth and investment, using terms like 'low and stable inflation'.
For evaluation questions on the consequences of inflation, consider the impact on different groups (e.g., borrowers vs. savers, fixed-income earners) and the severity of the inflation.
Advantages & Disadvantages
Inflation
Deflation
Evaluation Starters
Essay Structure Guide
Introduction
Begin by defining the key terms relevant to the question (e.g., inflation, deflation, price stability) and briefly outline the scope of your essay, stating the main arguments you will present.
Conclusion
Summarise your main arguments, reiterating the complexities and trade-offs associated with price stability, inflation, and deflation. Offer a final, balanced judgement on the overall desirability of price stability as a macroeconomic objective.
This chapter outlines the primary macroeconomic policy objectives of governments: achieving price stability, maintaining low unemployment, and fostering sustainable economic growth. It explains why governments aim for a low and stable inflation rate rather than zero inflation, the benefits of low unemployment, and the importance of avoiding both excessively slow and excessively rapid economic growth.
Price Stability — A low and stable inflation rate.
Governments aim for price stability, meaning a low and stable positive inflation rate, rather than zero inflation. This is because inflation measures tend to overstate price rises, aiming for zero could lead to deflation, and a small, stable price increase encourages firms to boost output. Achieving price stability is like maintaining a steady speed on a motorway; a constant, low speed is safe and allows for progress.
Students often think price stability means zero inflation (0%), but actually governments aim for a low and stable positive rate, such as 2% or a range like 3-6%.
When explaining price stability as an objective, remember to state why zero inflation is not the target. Mentioning the risk of deflation and the incentive for firms to increase output will demonstrate a deeper understanding.
Inflation Target — A target for the inflation rate, set by a government for its central bank to achieve.
An inflation target makes a central bank more accountable for maintaining price stability and can reduce inflationary expectations. If firms and workers have confidence in the target, they may act in ways that do not push up prices, such as demanding lower wage rises. An inflation target is like a thermostat for the economy, with the central bank adjusting policy to keep the economy from getting too hot or too cold.
Students often think an inflation target is a single, rigid number that must be hit exactly, but actually it is often a target range (e.g., 3%-6%) or a central target with an allowable margin on either side (e.g., 2% +/- 1%).
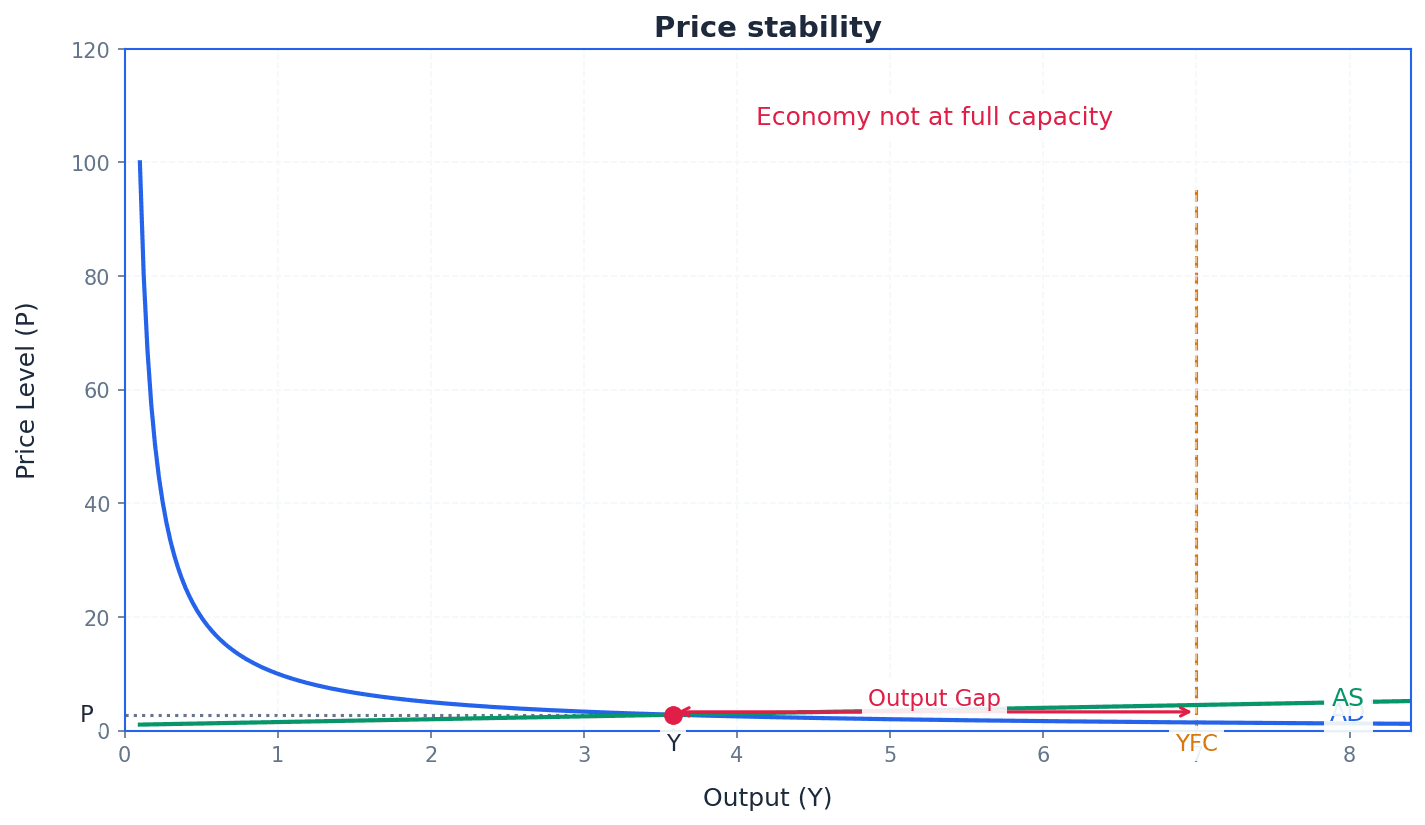
Low Unemployment — A state of having a low proportion of the labour force unemployed.
Low unemployment is a key objective because it leads to high output, high tax revenue for the government, and low government expenditure on unemployment benefits. Governments are also concerned with the quality of employment, ensuring jobs are skilled, secure, and well-paid, and that any unemployment is short-term to prevent workers from losing skills. A football team manager aims for low unemployment by wanting all their best players on the pitch contributing.
Students often think that a low unemployment rate is always a sign of a perfectly healthy economy, but actually if the jobs are unskilled, insecure, and low-paid, the benefits to workers and the economy may be limited.
In an exam, distinguish between the quantity and quality of employment. Arguing that a low unemployment rate might mask issues like underemployment or insecure work is a strong evaluation point.
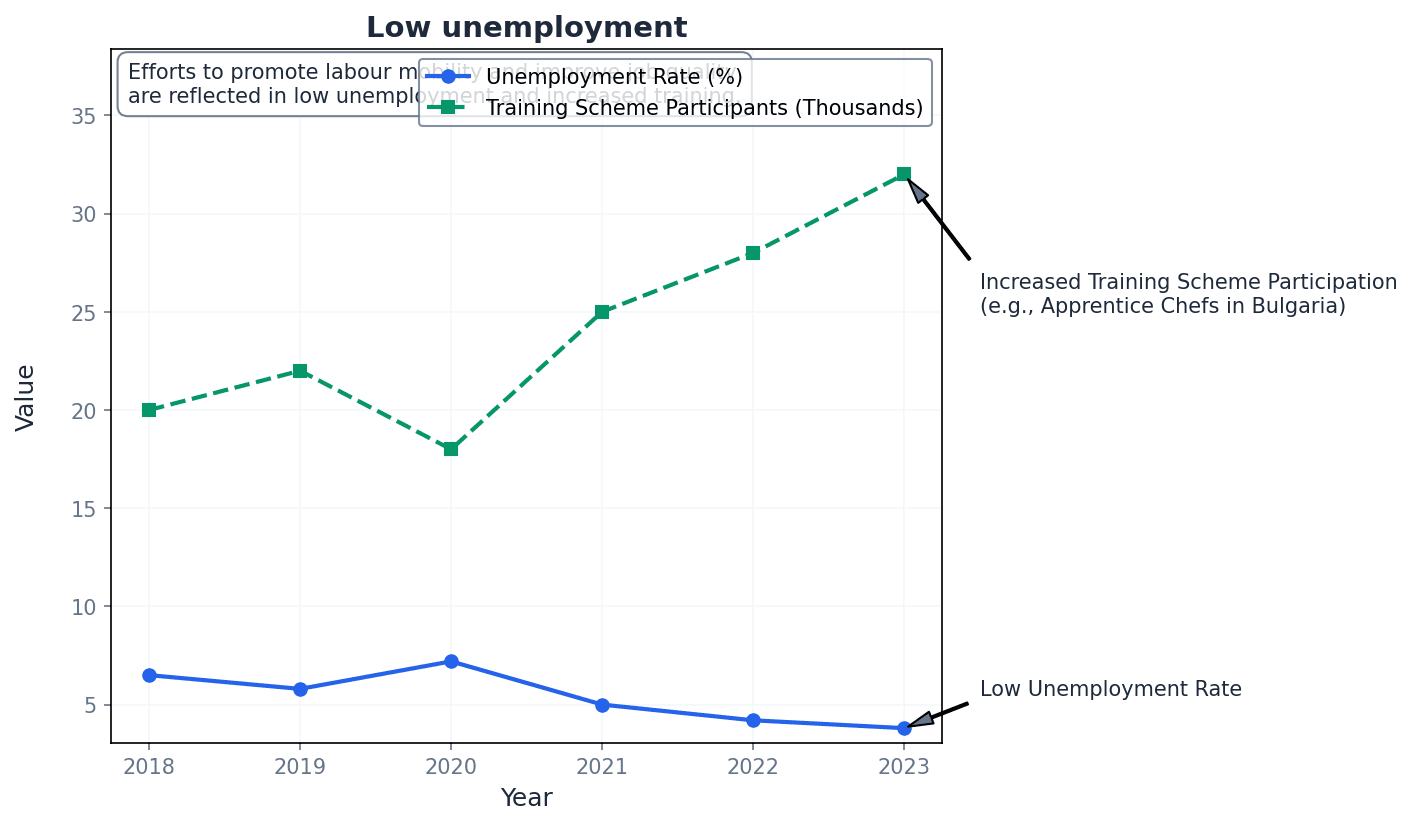
Economic Growth — An increase in a country’s output.
Governments pursue economic growth to prevent rising unemployment and to allow living standards to rise. However, they aim for a sustainable rate, as too high a rate can cause the economy to overheat, leading to inflation and risky investments. Pursuing economic growth is like tending a plant; you want it to grow steadily, not wither or scorch.
Overheating — A situation where an economy's aggregate demand increases faster than its aggregate supply.
Overheating can happen when there is too high a rate of economic growth, putting pressure on resources and causing inflationary pressure to build up. It can also encourage over-optimistic entrepreneurs and households to take on loans they may struggle to repay. An overheating economy is like a car engine running in the red zone, putting immense strain on its parts.
Students often think that the highest possible rate of economic growth is always the best objective, but actually an excessively high rate can be damaging, leading to inflation, resource pressure, and unsustainable debt.
When discussing economic growth as an objective, always present a balanced view. Explain the benefits (e.g., higher living standards) but also the potential costs of growth that is too rapid (e.g., inflation, environmental damage).
Governments aim to achieve these objectives simultaneously, though trade-offs can exist. For instance, policies designed to significantly reduce unemployment might lead to increased aggregate demand, potentially conflicting with the objective of price stability by causing inflation. Therefore, governments must carefully balance their policy choices to achieve sustainable outcomes across all objectives.
To show deeper analysis, link the objectives. Explain how achieving low unemployment might conflict with the price stability objective (a potential trade-off).
Use precise terminology. Refer to 'sustainable' economic growth and 'low and stable' inflation to demonstrate clear understanding of the objectives.
Advantages & Disadvantages
Achieving Price Stability (low and stable inflation)
Maintaining Low Unemployment
Evaluation Starters
Essay Structure Guide
Introduction
Begin by defining the three primary macroeconomic objectives: price stability, low unemployment, and sustainable economic growth. Briefly state why governments pursue these goals and acknowledge potential conflicts.
Conclusion
Summarise the importance of each objective for overall economic welfare. Reiterate that governments aim for a balance, acknowledging that achieving all objectives perfectly is challenging due to inherent trade-offs and external influences.
This chapter defines fiscal policy as the government's use of taxation and spending to manage aggregate demand and achieve macroeconomic goals. It explores government budgets, distinguishing between deficits and surpluses, and the significance of national debt. The chapter also details different tax types and spending categories, concluding with an analysis of how expansionary and contractionary fiscal policies impact national income, output, price level, and employment using AD/AS analysis.
Fiscal policy — Fiscal policy is the use of taxation and government spending to manage aggregate demand in order to achieve the government’s macroeconomic aims.
It is the government's primary tool for influencing the economy, aiming to achieve objectives like economic growth, low inflation, and full employment. Think of fiscal policy as a car's accelerator and brake pedals: government spending is the accelerator to boost demand, and taxation is the brake to slow it down, both used to steer the economy towards its goals.
budget deficit — A budget deficit occurs when government spending exceeds tax revenue.
This means the government is spending more than it collects in taxes, requiring it to borrow money, which adds to the national debt. It typically has an expansionary effect on aggregate demand. If you spend more than you earn in a month, you have a deficit and need to borrow money or use savings to cover the difference.
budget surplus — A budget surplus arises when tax revenue exceeds government spending.
This indicates that the government is taking in more money than it is spending, which can be used to pay off national debt or save for future needs. It typically has a contractionary effect on aggregate demand. Imagine your personal budget: if you earn more than you spend in a month, you have a surplus, which you can save or use to pay off loans.
balanced budget — A balanced budget is when government spending matches tax revenue.
Most governments aim to achieve a balanced budget over time, as it implies fiscal sustainability without adding to or reducing the national debt. It suggests a neutral impact on aggregate demand. It's like breaking even on your monthly finances – your income exactly covers your expenses.
Students often confuse a budget deficit (one year) with national debt (cumulative total over time). Remember that a budget deficit is for a single year, while national debt is the cumulative total of all past deficits and surpluses.
Distinguish clearly between a budget deficit (one year) and national debt (cumulative). A common error is to confuse the two.
Government budget deficits can be categorised into cyclical and structural deficits. A cyclical deficit occurs due to a fall in economic activity, where tax revenues automatically decrease and government spending on benefits automatically rises during a recession. In contrast, a structural deficit arises when a government is committed to too much spending relative to its tax revenue, and this imbalance will not disappear even when GDP increases to its full employment level.
cyclical deficit — A budget deficit that occurs due to a fall in economic activity is known as a cyclical deficit.
During a recession, tax revenues automatically fall (due to lower incomes and profits) and government spending on benefits automatically rises (due to higher unemployment), leading to a deficit without deliberate policy changes. It is expected to disappear as economic activity increases. Think of it like your income dropping when you're temporarily out of work – your spending might exceed your reduced income, but it's expected to balance out once you're employed again.
structural deficit — A structural deficit arises when a government is committed to too much spending relative to its tax revenue.
This type of deficit will not disappear even when GDP increases to its full employment level, indicating a fundamental imbalance between government spending commitments and its revenue-raising capacity. It requires deliberate policy changes to address. This is like having a fixed monthly expense (e.g., a high rent) that consistently exceeds your regular income, regardless of any temporary bonuses you might get. You need to fundamentally change your spending or income.
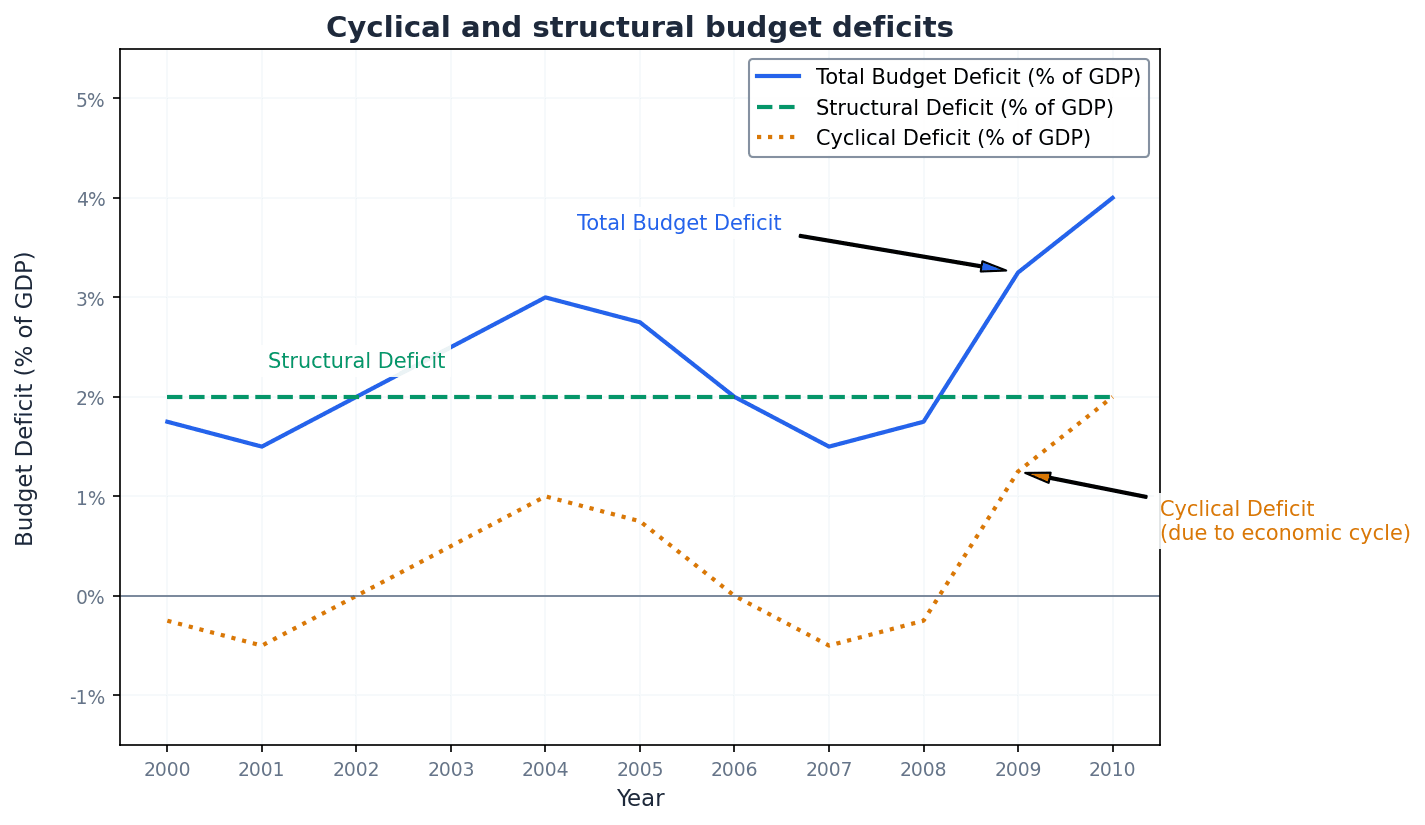
When analysing deficits, always consider if it's cyclical or structural. Examiners look for this distinction, especially when discussing government responses to recessions.
national debt — Government or public sector debt is the total debt a central government, or the whole public sector, has built up over time.
It is the accumulation of past budget deficits minus any budget surpluses. A large national debt can lead to significant interest payments, opportunity costs, and may make future borrowing more difficult or expensive. If a budget deficit is like your credit card bill for one month, the national debt is the total outstanding balance on all your credit cards and loans combined over many years.
Students often confuse national debt with a budget deficit. Remember that the national debt is the cumulative total of all past deficits and surpluses, while a budget deficit is for a single year.
Governments levy taxes primarily to raise revenue for public spending, such as on healthcare, education, and infrastructure. Taxation also serves as a tool for income redistribution, aiming to reduce inequality through progressive tax systems. Furthermore, taxes can be used to correct market failures by discouraging the consumption of demerit goods or activities that generate negative externalities.
Direct taxes — Direct taxes are taxes on income and wealth.
These are paid directly by individuals or firms to the government. Examples include income tax and corporate tax. They are typically progressive and can be used to redistribute income. The tax taken directly from your paycheck or a company's profits before they are distributed is a direct tax.
income tax — Income tax is a tax on the income of individuals.
It is a primary source of government revenue and is often progressive, meaning higher earners pay a larger percentage of their income in tax. It can influence labour supply and disposable income. The portion of your salary that is automatically deducted and sent to the government is income tax.
corporate tax — Corporate tax is a tax on the profits of firms.
It is a direct tax that affects firms' retained earnings and their incentive to invest. Changes in corporate tax rates can influence business investment and location decisions. It's like a portion of a company's annual earnings being paid to the government before any dividends are distributed to shareholders.
Indirect taxes — Indirect taxes are taxes on the sale of goods and services.
They are called 'indirect' because they are largely paid by consumers through higher prices, but collected by firms who then pay the government. Examples include VAT and GST. They are often regressive. When you buy a soft drink with a sales tax, you pay the tax indirectly through the price, and the shop collects it for the government.
Students often think indirect taxes are paid by firms. Remember that firms collect them and pass the burden onto consumers, though the extent depends on price elasticity of demand.
ad valorem taxes — Ad valorem taxes are taxes based on the percentage of the price of a product.
This means the tax amount increases as the price of the product increases. VAT and GST are common examples of ad valorem taxes. They are a percentage of the value. If a tax is 10% of the price, a 1 tax, and a 10 tax – the tax amount changes with the value.
excise duties — Indirect taxes on particular products are sometimes known as excise duties.
These are specific taxes often levied on goods like tobacco, alcohol, or fuel. They can be used to raise revenue or to discourage consumption of certain products (sin taxes). The extra tax you pay on a pack of cigarettes or a litre of petrol is an excise duty.
sin taxes — Sin taxes are imposed to discourage people from buying products that are not good for their health.
These are a type of excise duty specifically targeting demerit goods like high-sugar drinks, tobacco, or high-fat foods. They aim to internalise negative externalities and improve public health. The tax on sugary drinks in Mexico is a sin tax, aiming to make people buy fewer unhealthy beverages.
Tax systems can be categorised by how the tax burden changes with income. A progressive tax takes a higher percentage of income as income rises, aiming for redistribution. A regressive tax takes a smaller percentage of income as income rises, meaning it takes a higher percentage from low-income earners. A proportional tax, also known as a flat rate tax, takes a fixed percentage of income regardless of the income level.
progressive tax — A progressive tax is one that takes a higher percentage of a person or firm’s income as that income rises.
This type of tax aims to redistribute income more evenly, as those with higher incomes contribute a proportionally larger share. Income tax systems are often designed to be progressive. Imagine a ladder where each rung you climb (higher income) means a larger slice of that rung is taken as tax.
Students often think 'progressive' means paying more tax. Remember that it means paying a higher *percentage* of income as tax as income rises.
regressive tax — In the case of a regressive tax, a smaller percentage of income is taken as income rises.
This means that such a tax takes a higher percentage of the income of people on low incomes. Indirect taxes are typically regressive because the tax amount is fixed regardless of income, representing a larger proportion of a lower income. If everyone pays a 1 is a much larger portion of a poor person's income than a rich person's income.
proportional tax — A proportional tax is a fixed percentage tax, for example a 20% income tax.
The tax rate does not change as income changes, meaning everyone pays the same percentage of their income in tax, regardless of their income level. This is also known as a flat rate tax. No matter how much you earn, if the tax is 15%, you always pay 15% of your income.
Understanding tax rates involves distinguishing between the marginal and average rates. The marginal rate of taxation (MRT) is the proportion of extra income taken in tax, which is crucial for assessing work incentives. The average rate of taxation (ART) is the proportion of a person’s total income that is taken in tax, providing an overall picture of the tax burden.
marginal rate of taxation (mrt) — The marginal rate of taxation (mrt) is the proportion of extra income taken in tax.
It indicates how much of an additional unit of income (e.g., an extra £100) is paid in tax. This rate is crucial for understanding work incentives, as it shows the tax burden on additional earnings. If you work an extra hour and earn £10, and £3 of that goes to tax, your marginal tax rate for that extra hour is 30%.
average rate of taxation (art) — The average rate of taxation (art) is the proportion of a person’s total income that is taken in tax.
It is calculated by dividing total tax paid by total income. This rate provides an overall picture of the tax burden on an individual's entire income. If you earn £50,000 in a year and pay £10,000 in tax, your average tax rate is 20% for that year.
Students often confuse marginal tax rate with average tax rate. Remember that the marginal rate applies to *additional* income, while the average rate applies to *total* income.
Be precise with definitions. Clearly distinguish between marginal and average tax rates, and direct vs. indirect taxes, to secure easy marks.
Government spending is undertaken for various reasons, including providing public goods and services like defence and street lighting, and merit goods such as education and healthcare. It also aims to redistribute income through transfer payments and to stabilise the economy by influencing aggregate demand. Investment in infrastructure through capital spending can also boost long-term economic growth.
Current government spending — Current government spending is spending on goods and services used to provide state-financed services.
This covers the operating costs of government, such as wages for public sector workers (teachers, doctors) and the purchase of consumables (medicines, office supplies). It is exhaustive spending and contributes to aggregate demand. This is like your household's monthly expenses for groceries, utilities, and salaries for any staff you employ.
Capital government spending — Capital government spending is spending on capital goods used in the public sector.
This includes investment in long-term assets like building state schools, hospitals, roads, and infrastructure. It is exhaustive spending, contributes to aggregate demand, and can increase an economy's productive potential (aggregate supply). This is like your household buying a new house or a car – a large, long-term investment.
transfer payments — Government spending on transfer payments (welfare payments to certain groups of people) includes spending on unemployment benefits, state pensions and interest payments on the national debt.
These payments do not involve the government directly purchasing goods or services or using resources; instead, they redistribute income. They are not counted in measures of national income (GDP) as they don't represent production. It's like your parents giving you pocket money – they're transferring money to you, but not buying a specific good or service from you.
Students often think all government spending is included in GDP. Remember that transfer payments are not, as they are a redistribution of income, not a payment for goods or services produced.
Exhaustive government spending — Exhaustive government spending covers current and capital spending.
It is spending which uses resources and is counted in aggregate demand and GDP. This type of spending directly consumes goods and services produced in the economy. When the government buys new fighter jets or pays teachers' salaries, it's 'exhausting' resources from the economy.
Non-exhaustive government spending — Non-exhaustive government spending is spending on transfer payments.
This spending does not involve the government deciding how resources are used; instead, the people who receive the payments make the decision about how to use the resources. It is not counted in GDP. When the government sends out unemployment benefits, it's not buying anything itself; it's giving money to individuals who then decide how to spend it.
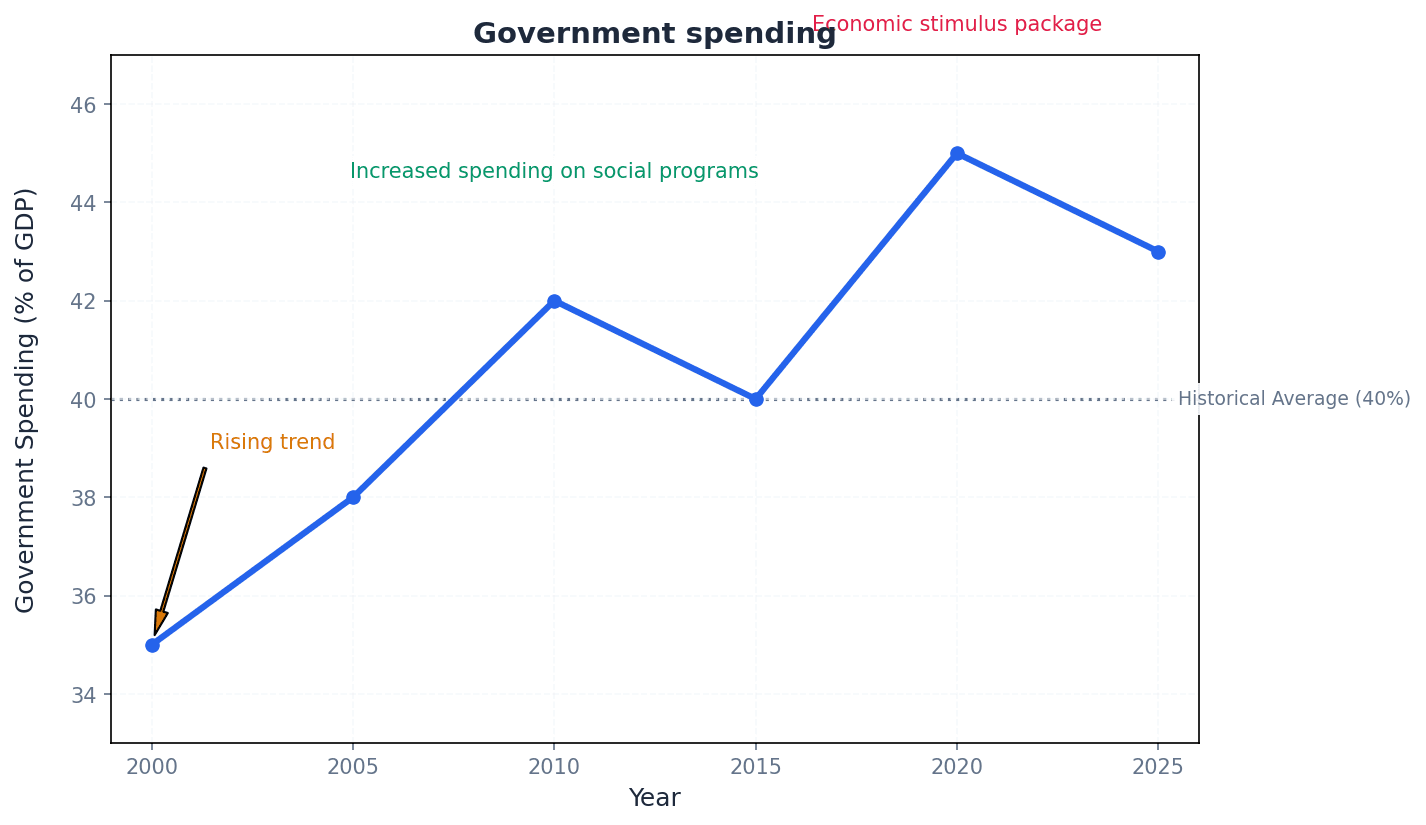
When analysing government spending, differentiate between current (day-to-day), capital (investment), and transfer payments, as they have different economic impacts.
Fiscal policy can be either expansionary or contractionary, depending on the government's macroeconomic aims. Expansionary fiscal policy is designed to increase aggregate demand, typically through increased government spending or tax cuts, to stimulate growth and reduce unemployment. Conversely, contractionary fiscal policy aims to lower the growth of aggregate demand, usually by reducing spending or increasing taxes, to combat inflation or reduce national debt.
Expansionary fiscal policy — Expansionary fiscal policy is designed to increase aggregate demand.
This can be achieved by a government increasing its spending and/or cutting tax rates or the tax base. It is typically used to stimulate economic growth, reduce unemployment, and combat recessions, often leading to a larger budget deficit. It's like pressing the accelerator in a car to speed up the economy, by either giving people more money to spend (tax cuts) or the government spending more directly.
Contractionary fiscal policy — Contractionary fiscal policy is intended to lower the growth of aggregate demand.
This is achieved by the government reducing its spending and/or increasing taxes, often aiming for a budget surplus. It is typically used to reduce demand-pull inflation or to reduce a large national debt. It's like pressing the brake pedal in a car to slow down an overheating economy, by either taking money out of people's hands (tax increases) or the government spending less.
Students often think expansionary policy always leads to inflation. Remember that if the economy has significant spare capacity, it can increase output and employment without much inflation.
When asked to 'analyse' fiscal policy, remember to link specific tax or spending changes to their impact on aggregate demand (AD) and then to macroeconomic objectives like output, price level, and employment, often using AD/AS diagrams.
Fiscal policy can be implemented through deliberate government action, known as discretionary fiscal policy, where specific changes are made to spending or taxation laws. Alternatively, automatic stabilisers are built-in features of the economy, such as progressive income tax and unemployment benefits, that automatically adjust to offset fluctuations in GDP without requiring new legislation, helping to smooth out the business cycle.
discretionary fiscal policy — Deliberate changes in government spending and taxation can be referred to as discretionary fiscal policy.
These are active policy decisions made by the government, such as passing new laws to change tax rates or approving new spending programs, in contrast to automatic stabilisers. This is like you consciously deciding to spend more on a holiday or save more for a house, rather than your spending changing automatically due to a pay rise.
Automatic stabilisers — Automatic stabilisers are forms of government spending and taxation that change, without any deliberate government action, to offset fluctuations (changes) in GDP.
During a recession, unemployment benefits automatically rise and tax revenues automatically fall, providing a fiscal stimulus. During a boom, the reverse happens, dampening demand. They help to smooth out the business cycle. Think of them as the cruise control in a car: they automatically adjust the engine (economy) to maintain a steady speed (GDP) without you having to constantly press the accelerator or brake.
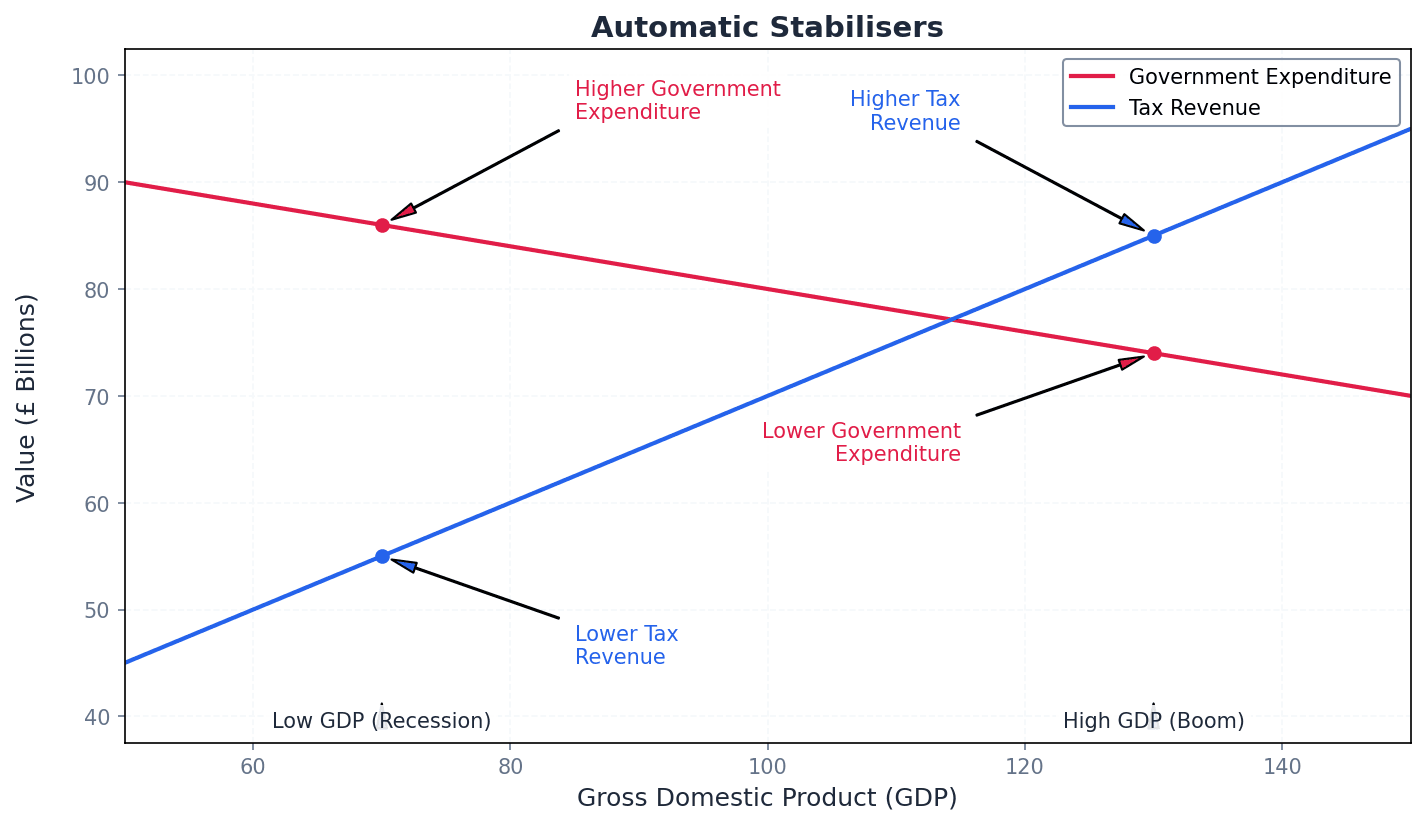
Always use an AD/AS diagram to illustrate the impact of expansionary or contractionary fiscal policy on price level and real GDP.
For evaluation, always consider the limitations of fiscal policy: time lags, political factors, and the potential for 'crowding out' private investment.
Advantages & Disadvantages
Expansionary Fiscal Policy
Contractionary Fiscal Policy
Evaluation Starters
Essay Structure Guide
Introduction
Start by defining fiscal policy and briefly outlining its main tools (government spending and taxation) and objectives (e.g., economic growth, low inflation, full employment). State the main argument or stance you will take in your essay.
Conclusion
Summarise your main arguments and evaluation points. Reiterate your overall stance on the effectiveness or appropriateness of fiscal policy in achieving macroeconomic aims, perhaps suggesting conditions under which it is most effective or highlighting its role alongside other policies.
This chapter defines monetary policy as the tools used by central banks to influence the price or quantity of money, thereby affecting aggregate demand. It details key tools like interest rates, money supply, and credit regulations, explaining their use in expansionary or contractionary policies. The chapter also discusses the impact of these policies on national income, output, price level, and employment using AD/AS analysis, alongside their effectiveness and limitations.
Monetary policy — Monetary policy refers to any policy tools that affect the price or quantity of money.
It is a demand-side policy, similar to fiscal policy, aiming to influence aggregate demand. These tools are typically implemented by a country's central bank to achieve macroeconomic objectives like price stability or economic growth, much like adjusting a thermostat to control the temperature of a room.
Students often think monetary policy only involves printing money, but it primarily involves managing interest rates and influencing commercial bank lending.
Interest rates — The interest rate is, in effect, the price of money.
It is the cost households and firms pay to borrow money and the return they receive for lending or saving money. Central banks manipulate this rate to influence borrowing, saving, investment, and ultimately aggregate demand, similar to how 'rent' for money affects demand for borrowing.
Students often think a central bank directly sets all interest rates, but it sets a base rate that commercial banks then use as a guide for their own lending and saving rates.
When discussing interest rates, clearly distinguish between their impact on borrowing (investment and consumer expenditure) and saving, and how these affect aggregate demand.
Money supply — The money supply refers to the total quantity of money in the economy.
A central bank can influence the money supply, primarily by affecting commercial bank lending, which is the main cause of changes in the quantity of money. Changes in the money supply can directly influence aggregate demand, much like the amount of fuel available in an engine affects its speed.
Students often think increasing the money supply always means printing more physical cash, but it largely involves electronic creation of money through bank lending.
When analysing the money supply, link changes in its quantity directly to changes in aggregate demand and potential impacts on inflation or economic growth.
Credit regulations — Credit regulations are rules imposed by central banks on commercial banks to help maintain financial stability and influence bank lending.
These regulations often require commercial banks to hold a certain proportion of their assets in liquid forms, ensuring they can meet customer demand for cash and influencing their capacity to lend. This affects the money supply and aggregate demand, acting like safety rules or speed limits for banks.
Students often think credit regulations are only about protecting consumers, but they also serve as a tool for central banks to manage the overall money supply and economic activity.
When discussing credit regulations, explain how they affect commercial banks' ability to lend, and consequently, how this impacts the money supply and aggregate demand.
Aggregate demand — Aggregate demand refers to the total demand for goods and services in an economy at a given price level and in a given time period.
Monetary policy directly influences aggregate demand by affecting components like consumer expenditure and investment through changes in interest rates, money supply, and credit availability. It's like trying to make a country's total shopping list longer or shorter.
Always link monetary policy tools to their specific impact on components of aggregate demand (C, I, G, X-M) when explaining their effects.
Monetary policy involves tools that affect the price or quantity of money, used by central banks to influence aggregate demand. The main tools include manipulating interest rates, influencing the money supply, and imposing credit regulations on commercial banks. These tools are used to achieve macroeconomic objectives such as price stability or economic growth.
Expansionary monetary policy — Expansionary monetary policy may be used to increase aggregate demand.
This typically involves a cut in interest rates, an increase in the money supply, or a reduction in restrictions on bank lending. The goal is to stimulate consumer expenditure and investment, leading to higher national income, output, and employment, much like giving a sluggish economy a 'shot of espresso'.
Students often think expansionary policy always guarantees economic growth, but its effectiveness can be limited if firms and households are pessimistic or if interest rates are already very low.
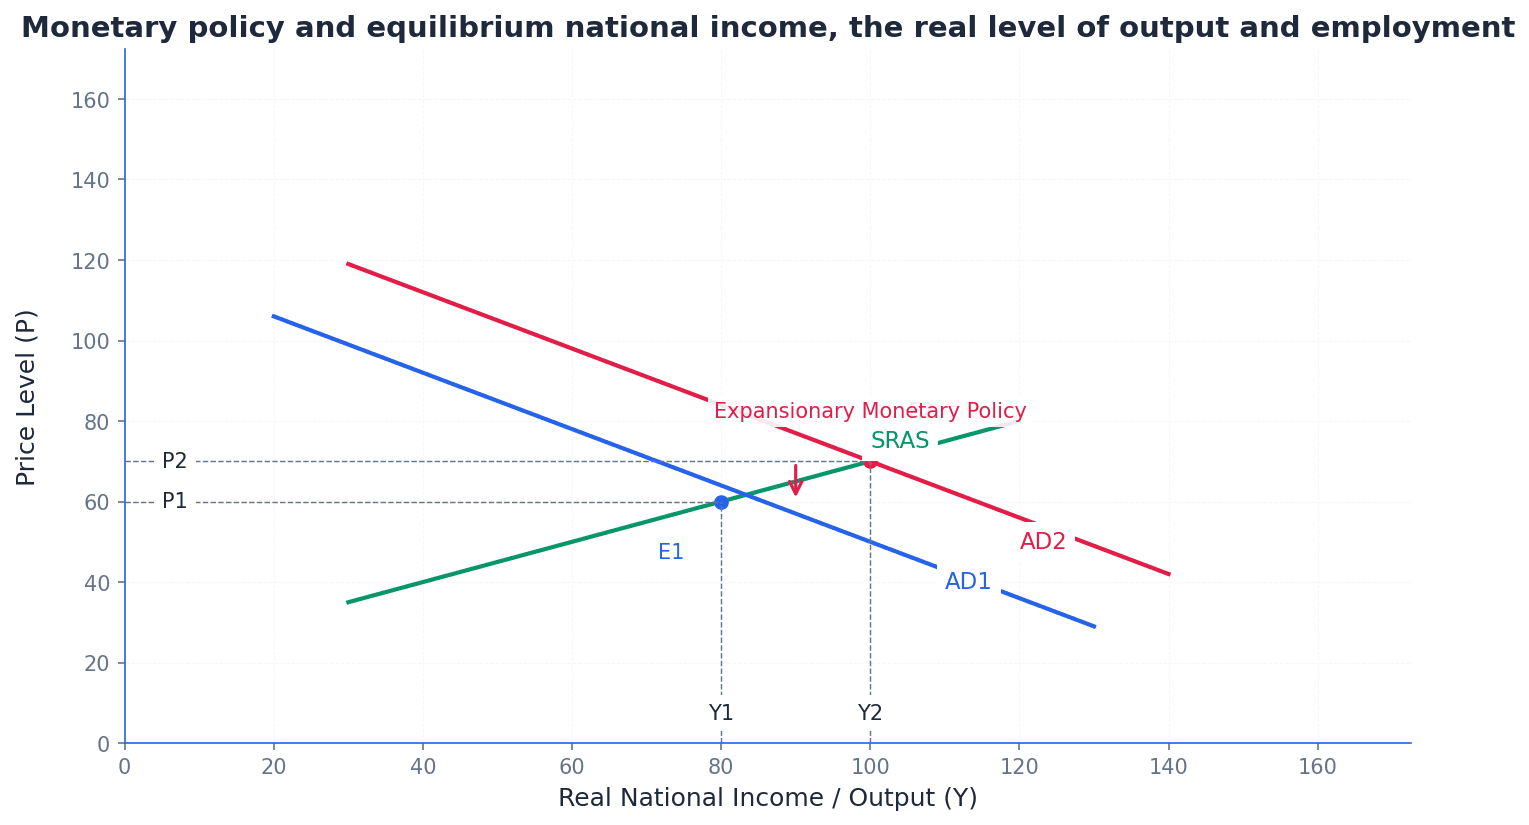
Contractionary monetary policy — To reduce aggregate demand or the growth of AD, contractionary monetary policy may be used.
This might include a rise in interest rates, a decrease in the money supply, and restrictions on bank lending. It is often used to combat demand-pull inflation by discouraging borrowing and spending, akin to applying the 'brakes' to an overheating economy.
Students often think contractionary policy only reduces inflation, but it carries a risk of reducing national income, output, and employment if not carefully managed.
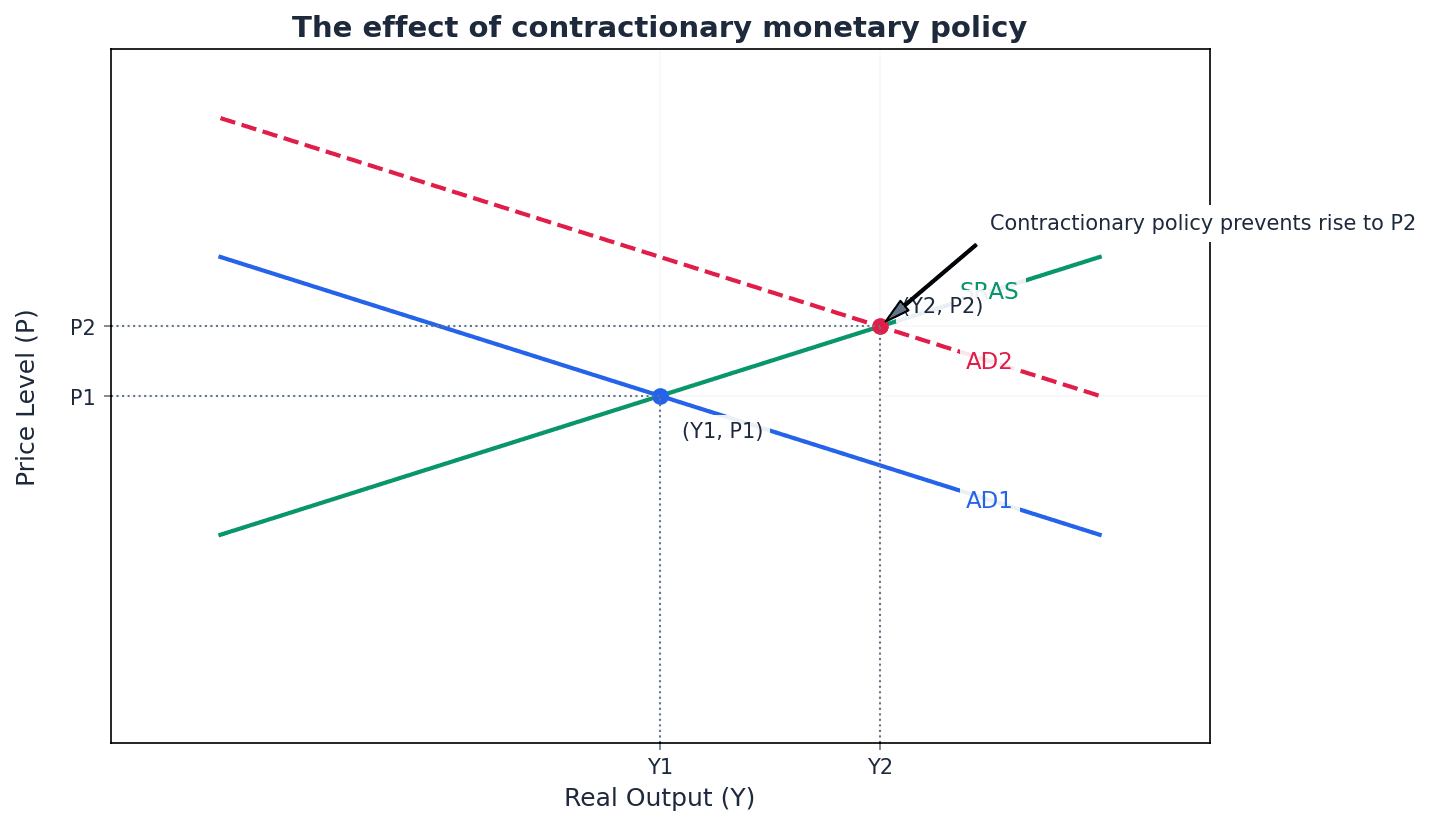
Expansionary monetary policy aims to increase aggregate demand, typically through lower interest rates, increased money supply, or relaxed credit regulations, to stimulate economic activity. Conversely, contractionary monetary policy seeks to reduce aggregate demand or its growth, usually by raising interest rates, decreasing the money supply, or tightening credit regulations, often to combat inflation.
Price level — The price level refers to the average of current prices across the entire spectrum of goods and services produced in an economy.
Monetary policy is often primarily used to influence the price level, particularly to control inflation. Contractionary policy aims to reduce demand-pull inflation, while expansionary policy can lead to a higher price level if there is little spare capacity, much like trying to keep the overall 'cost of living' stable.
When discussing the impact on the price level, differentiate between demand-pull inflation (influenced by AD) and cost-push inflation (less directly influenced by monetary policy).
Real output — Real output refers to the total value of goods and services produced in an economy, adjusted for inflation.
Expansionary monetary policy aims to increase real output by stimulating aggregate demand, especially when there is spare capacity. Contractionary policy, while reducing inflation, may risk reducing real output if not carefully implemented, similar to getting a factory to produce more when it's underperforming.
Students often think output always increases with expansionary policy, but if the economy is already at full capacity, increased demand will primarily lead to higher prices rather than more real output.
When using AD/AS diagrams, clearly label the x-axis as 'Real Output' or 'National Income' and explain how shifts in AD affect this, distinguishing between movements along the SRAS curve.
Employment — Employment refers to the state of having paid work.
Expansionary monetary policy, by increasing aggregate demand and real output, is likely to lead to an in-crease in employment as firms hire more workers to produce additional goods and services. Contractionary policy, conversely, may have an adverse effect on employment, much like more roles opening up in a growing company.
When discussing employment, link it directly to changes in real output and the demand for labour, rather than just stating 'unemployment will fall'.
Using AD/AS analysis, expansionary monetary policy shifts the AD curve to the right, leading to an increase in equilibrium national income, real output, and employment, though it may also raise the price level. Conversely, contractionary monetary policy shifts the AD curve to the left, reducing national income, real output, and employment, but helping to control inflation by lowering the price level.
Always use an AD/AS diagram to illustrate the effects of monetary policy on the price level and real output. Label your axes and shifts clearly.
When explaining a policy change, clearly trace the transmission mechanism. E.g., 'A lower interest rate reduces the cost of borrowing, which increases consumption (C) and investment (I), causing AD to shift to the right.'
For evaluation marks, always discuss the limitations and effectiveness of the policy. Consider time lags, the initial state of the economy, and consumer/business confidence.
Advantages & Disadvantages
Expansionary Monetary Policy
Contractionary Monetary Policy
Evaluation Starters
Essay Structure Guide
Introduction
Start by defining monetary policy and stating its primary objectives (e.g., price stability, economic growth). Briefly outline the main tools available to central banks.
Conclusion
Summarise the main arguments, reiterating how monetary policy influences aggregate demand and its macroeconomic objectives. Conclude by weighing the potential benefits against the drawbacks and limitations, perhaps suggesting that its effectiveness depends on specific economic conditions and coordination with other policies.
This chapter defines supply-side policy as government measures designed to increase aggregate supply by improving product and factor markets, thereby shifting the LRAS curve to the right. It explores various tools like education, infrastructure, and deregulation, analysing their impact on national income, real output, price level, and employment using AD/AS analysis, while also discussing their effectiveness and limitations.
Supply-side policy — Governments use supply-side policies to increase aggregate supply by improving the workings of product and factor markets.
These policies aim to increase the economy's productive capacity, shifting the long-run aggregate supply (LRAS) curve to the right. They can involve either increased government intervention, such as spending on education, or reduced intervention, such as deregulation, much like upgrading a restaurant kitchen to produce more meals.
Students often think supply-side policy always involves reducing government intervention, but actually it can result in increased government intervention, for example through spending on infrastructure and education.
When deciding if a change in tax is a fiscal or supply-side policy tool, consider the government's objective. If the aim is to influence aggregate demand, it is a fiscal tool; if the aim is to increase aggregate supply (e.g., by incentivising work or investment), it is a supply-side tool.
Productivity — Productivity is the measure of output generated from inputs, where an increase means more goods and services can be produced with the same sized labour force.
Increasing productivity is the main way supply-side tools try to increase productive capacity. For example, improved training can raise workers' skills and thus their productivity, similar to a student learning to write a longer essay in the same time.
Students often think productivity and total production are the same thing, but actually productivity is a measure of efficiency (output per worker or per hour), whereas production is the total amount of output.
When analysing a supply-side policy, clearly link the specific tool (e.g., training) to an increase in labour or capital productivity, and then explain how this increased efficiency shifts the LRAS curve to the right.
Productive capacity — Productive capacity is the potential output of an economy, which supply-side policies seek to increase, thereby shifting the long-run aggregate supply (LRAS) curve to the right.
An increase in a country's productive capacity is a key objective of supply-side policy, achieved by increasing the quality and quantity of resources, such as a better-educated labour force or more advanced capital equipment. This is like a factory adding a new production line to increase its maximum daily output.
Students often think an increase in productive capacity automatically leads to an increase in real output, but actually if there is not enough aggregate demand, the new potential will not be used and the economy will operate with spare capacity.
The primary objective of supply-side policy is to increase the economy's productive capacity and productivity. By improving the efficiency of product and factor markets, these policies aim to shift the Long-Run Aggregate Supply (LRAS) curve to the right, leading to higher potential real output, lower price levels, and reduced unemployment.
Interventionist supply-side policies involve government spending and direct action. Key tools include investment in education and training to enhance human capital, promoting infrastructure development to improve efficiency, and providing support for technological improvement to boost productivity and innovation. These measures aim to improve the quality and quantity of factors of production.
Infrastructure — Infrastructure includes efficient transport, power, energy and telecommunication networks that are essential for the economy.
Good quality infrastructure keeps the costs of firms low and enables them to get their products to market quickly, much like a good operating system allows computer software to run smoothly. For example, an improved rail network reduces transport costs and makes workers more punctual.
Students often think infrastructure development is always beneficial, but actually it can be expensive, take a long time to build, and may have harmful effects on the environment.
When discussing infrastructure development, explain the specific mechanism through which it lowers firms' costs of production (e.g., reduced transport time, fewer production interruptions from power outages) and thus increases aggregate supply.
Market-based supply-side policies focus on reducing government intervention to enhance market efficiency. These include cuts in corporate tax to incentivise investment, cuts in income tax to encourage work and saving, trade union reform to increase labour market flexibility, privatisation, deregulation, and encouraging immigration to expand the labour force.
Privatisation — Privatisation is the process of transferring firms from public sector ownership to the private sector, which many countries have adopted in the belief that firms operate more efficiently in the private sector.
As a supply-side tool, privatisation is intended to increase efficiency, which in turn can increase aggregate supply, similar to a city council selling its bus service to a private company expecting more efficient operation. It is often paired with deregulation to promote competition.
Students often think privatisation is a guaranteed way to improve performance, but actually its success depends on whether the private firm faces competition. A privatised monopoly may not be more efficient than a public one.
When evaluating privatisation, use the concept of efficiency. Discuss whether the policy has actually led to increased productive, allocative, or dynamic efficiency in the affected industry.
Deregulation — Deregulation involves removing barriers to entry and laws and regulations that increase firms’ costs of production.
This supply-side tool is used to make markets more competitive and efficient by reducing legal and administrative burdens on businesses, aiming to lower production costs and encourage new firms to enter the market, thereby increasing aggregate supply. This is like removing rules in a board game to make it faster and easier for new players to join.
Students often think all regulations are bad for the economy, but actually deregulation can have negative consequences if it removes protections for consumers, workers, or the environment.
When analysing deregulation, you should balance the potential supply-side benefits (lower costs, increased competition) against the potential for market failure if essential regulations are removed.
Successful supply-side policies shift the Long-Run Aggregate Supply (LRAS) curve to the right. This leads to an increase in the equilibrium national income and real output, as the economy's productive potential expands. With a greater capacity to produce, the economy can achieve higher levels of output without inflationary pressures.
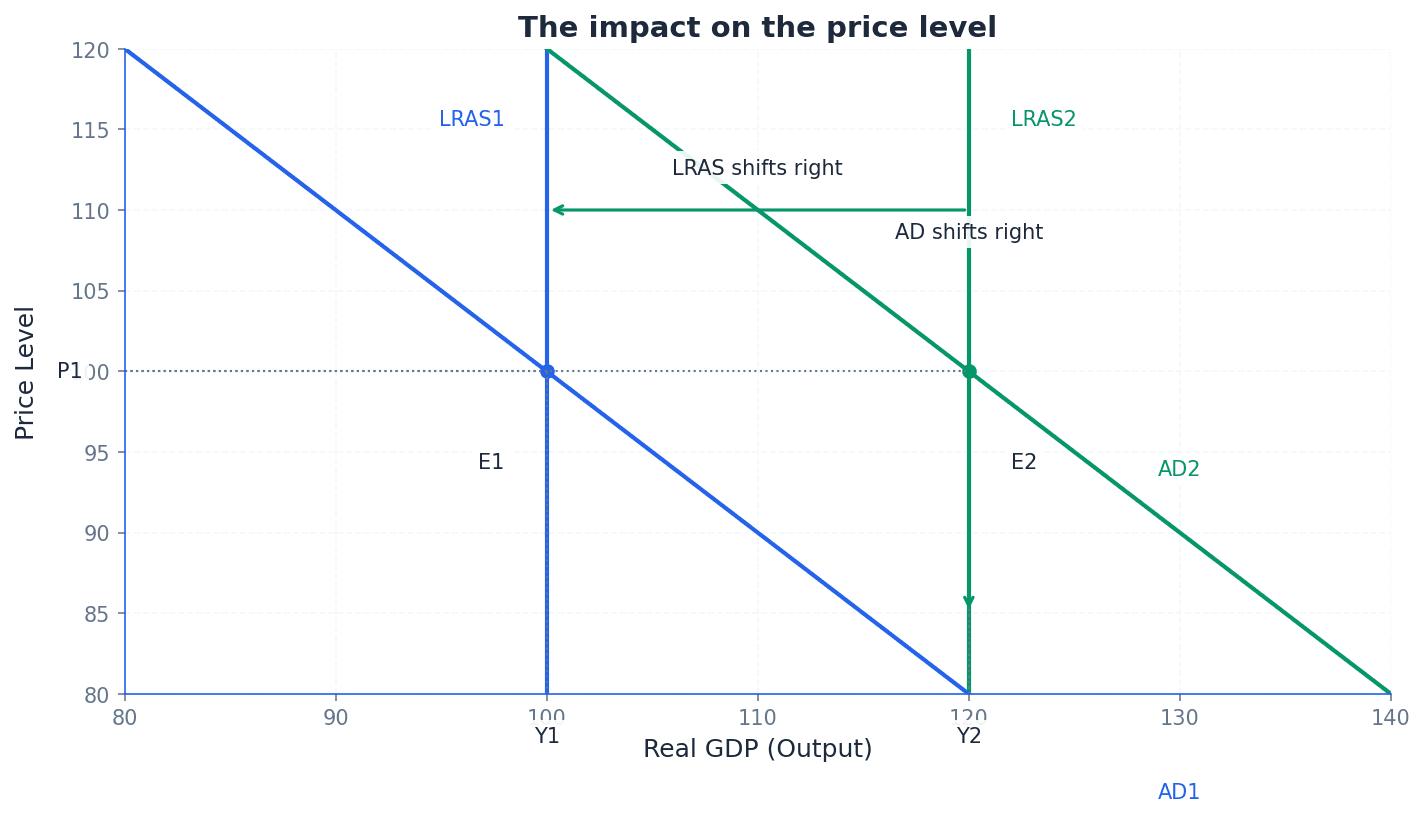
By increasing aggregate supply, supply-side policies can lead to a lower general price level, as more goods and services are available relative to demand, reducing inflationary pressure. Furthermore, by improving labour market efficiency and productivity, these policies can reduce the natural rate of unemployment, leading to higher employment levels in the long run.
Students often think supply-side policies always have immediate effects, but actually they can take a long time to have an effect, especially education and training.
Students often think increased spending on training automatically leads to lower costs, but actually if pay rises by more than productivity, costs of production will still rise.
Students often think supply-side policies will always raise output, but actually if the economy is initially operating with spare capacity, increased productive potential may not be used if there is not enough aggregate demand.
Students often think technological improvement is always beneficial for everyone, but actually its benefits are not always evenly spread and can be harmful to some, leading to job losses and the need for relocation.
Always use an AD/AS diagram. Clearly label the axes (Price Level, Real GDP) and show the LRAS curve shifting to the right (LRAS1 to LRAS2).
For evaluation, always discuss limitations. The most common are: significant time lags, high costs to the government, and the fact that their success depends on a sufficient level of Aggregate Demand.
Link policies to specific macroeconomic objectives. For example, explain how education spending can reduce structural unemployment or how deregulation can lower costs and reduce inflationary pressure.
Advantages & Disadvantages
Education and Training
Infrastructure Development
Evaluation Starters
Essay Structure Guide
Introduction
Start by defining supply-side policy and its primary objective (shifting LRAS to the right). Briefly state the macroeconomic goals it aims to achieve (e.g., higher output, lower inflation, lower unemployment).
Conclusion
Summarise the main arguments, reiterating the potential benefits and limitations of supply-side policies. Offer a final judgment on their overall effectiveness, perhaps noting that a combination of policies or specific conditions are necessary for success.
This chapter explores the fundamental theories of international trade, absolute and comparative advantage, explaining how specialisation based on these principles enhances global output and consumption possibilities. It also defines and analyses the measurement, causes, and impact of changes in the terms of trade, while acknowledging the practical limitations of these economic theories.
Absolute advantage — A country has an absolute advantage in producing a product if it can produce more of the product with the same quantity of resources than another country.
This theory suggests that countries should specialise in producing goods where they are simply more efficient, meaning they can produce more with the same resources than other countries. For example, if one friend can bake 10 cakes in an hour while another bakes 5, the first friend has an absolute advantage in baking. Specialisation and trade based on absolute advantage can increase total output and allow both countries to consume more.
When asked to explain absolute advantage, ensure you clearly state 'more output with the same resources' or 'same output with fewer resources' and provide a simple numerical example.
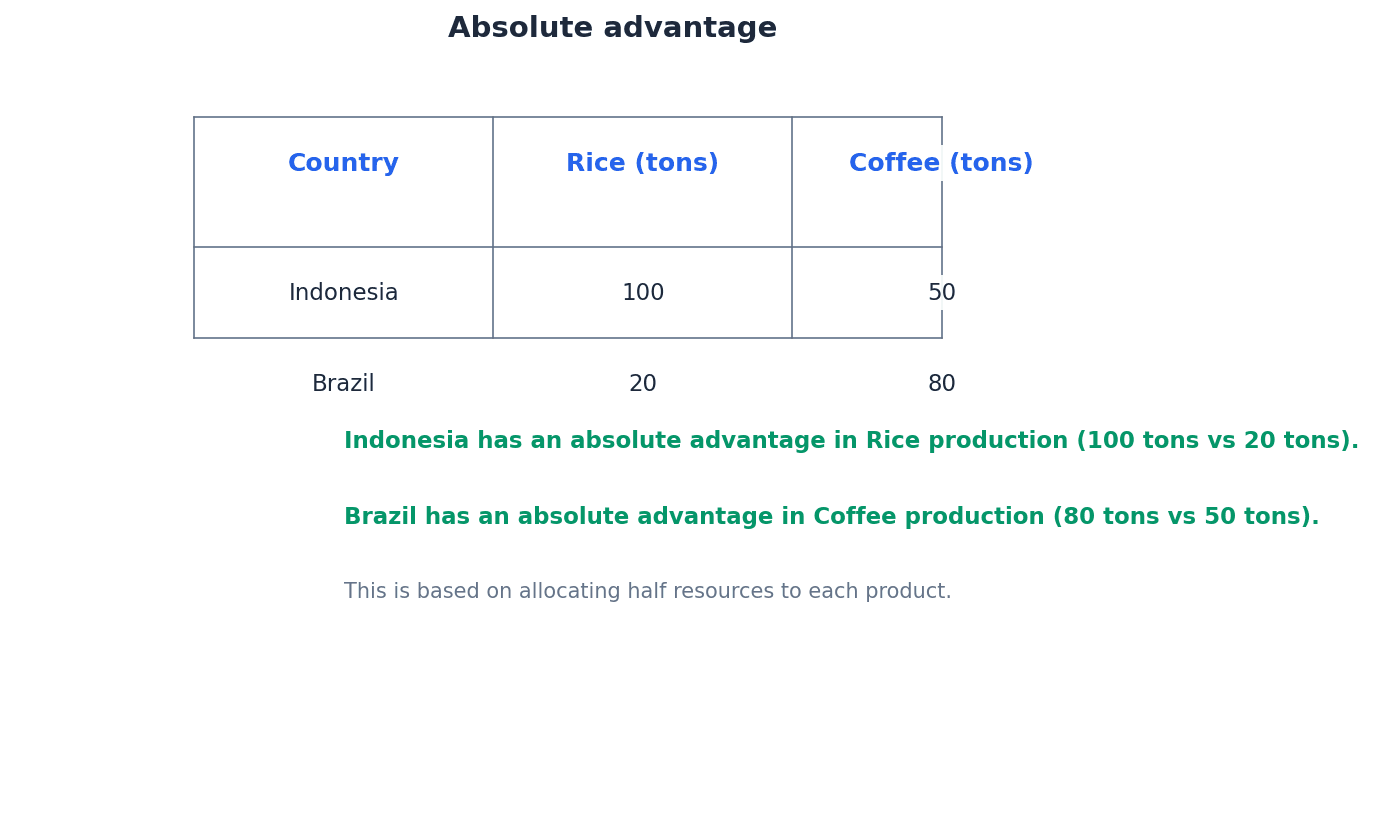
Comparative advantage — A country has a comparative advantage in producing a product if it can produce that product at a lower opportunity cost than another country.
This theory explains why countries still benefit from trade even if one country has an absolute advantage in all products. It focuses on the relative efficiency and the trade-offs involved in production, leading to specialisation in the product with the lowest opportunity cost. For instance, a lawyer might be better at both law and typing than their assistant, but the assistant has a comparative advantage in typing because the opportunity cost of the lawyer typing (lost billable hours) is much higher.
Students often confuse absolute advantage with comparative advantage; comparative advantage is about opportunity cost, not just being better. Also, students often think comparative advantage means being better at everything, but it actually means being relatively better or 'less bad' at something compared to other products.
When illustrating comparative advantage, always calculate and state the opportunity costs for both countries for both products. A clear numerical example is crucial, but don't rely solely on it; provide a written explanation too.
Specialisation based on absolute and comparative advantage allows countries to focus on producing goods where they are most efficient, leading to increased total world output. Free international trade, defined as the exchange of goods and services across national borders without government restrictions like tariffs or quotas, facilitates this specialisation. This absence of barriers allows for efficient resource allocation, potentially leading to economies of scale, increased choice, and lower prices and higher quality for consumers due to competition.
When discussing the benefits of free trade, link them directly to concepts like efficient resource allocation, economies of scale, increased choice, and competition, rather than just listing them.
Students often think free trade means no rules at all, but it actually refers specifically to the absence of government-imposed barriers to trade.
Trading possibility curve — A trading possibility curve shows how an economy can benefit from specialising and trading, enabling it to consume a greater quantity of products than it could produce domestically.
This curve illustrates that while a country cannot produce outside its Production Possibility Curve (PPC), international trade allows it to consume beyond its PPC. By specialising in its comparative advantage and trading, a country can achieve a higher level of consumption. For example, a gardener specialising in tomatoes can trade some for a neighbour's cucumbers, enjoying more of both than if they tried to grow both themselves.
Students often confuse the trading possibility curve with the PPC, but the trading possibility curve shows consumption possibilities after trade, which can lie outside the PPC.
When using a trading possibility curve, clearly label the PPC and the trading possibility curve, and show the shift from a point on the PPC to a point outside it due to trade.
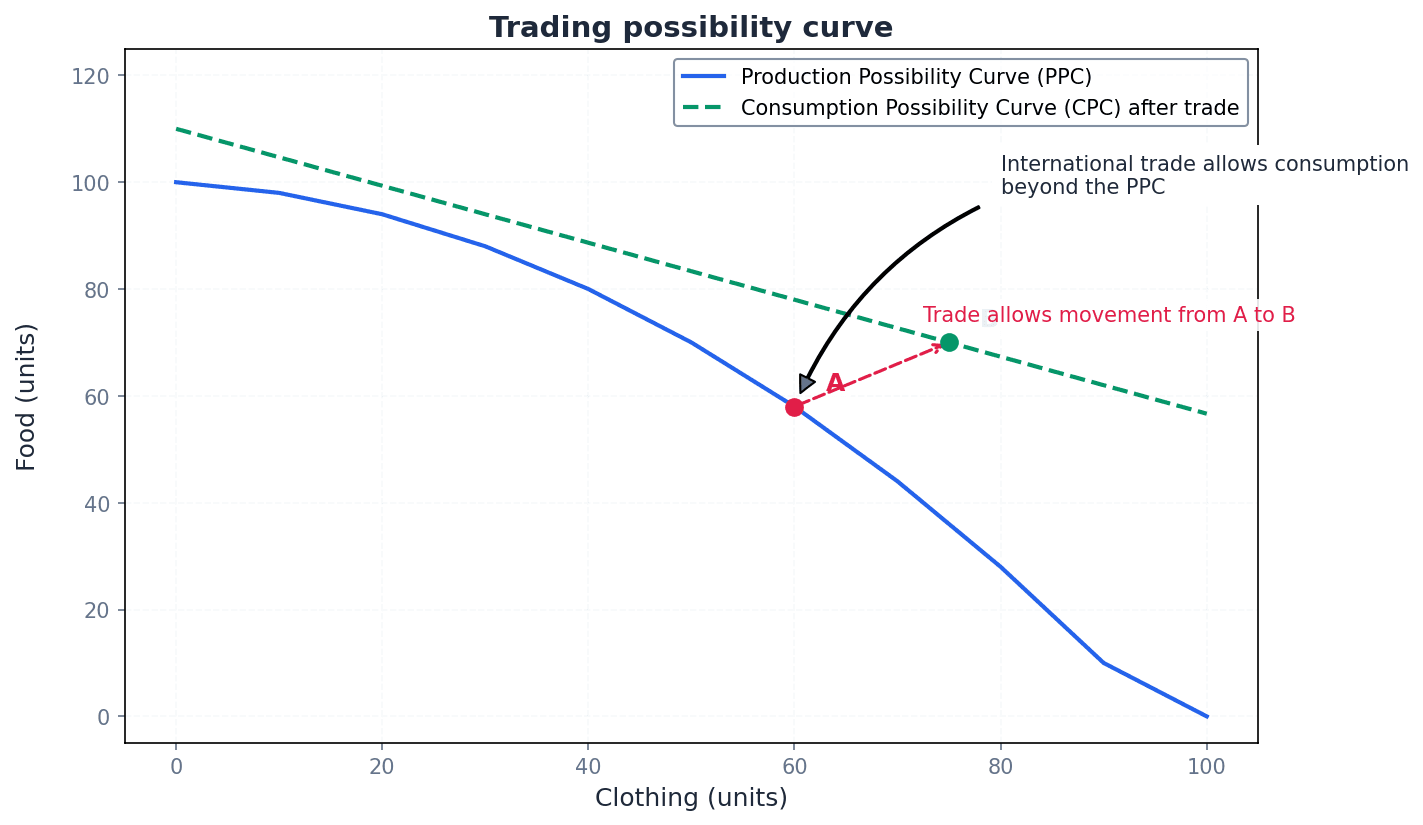
Terms of trade — The terms of trade is a measure of the ratio of a country's index of export prices to its index of import prices, multiplied by 100.
It indicates how many imports a country can purchase with a given quantity of exports. An improvement (favourable movement) means fewer exports are needed to buy the same imports, while a deterioration (unfavourable movement) means more exports are needed. Imagine selling apples and buying oranges; if the price of your apples goes up relative to oranges, you can buy more oranges for the same number of apples, indicating improved terms of trade.
Terms of trade index
Used to measure the ratio of export prices to import prices; a rise indicates a favourable movement, a fall indicates an unfavourable movement.
Always remember that the terms of trade is about prices, not volumes or values. Clearly state the formula and explain what a 'favourable' or 'unfavourable' movement means in terms of purchasing power.
Students often confuse the terms of trade with the balance of trade, but the terms of trade measures price ratios, while the balance of trade measures the value of exports minus imports.
Changes in the terms of trade can be caused by shifts in global demand or supply for a country's exports or imports, changes in exchange rates, or domestic inflation rates. An improvement in the terms of trade means a country can acquire more imports for a given volume of exports, potentially leading to higher real incomes and an improved current account balance. Conversely, a deterioration means a country must export more to maintain its import levels, which can worsen living standards and the current account.
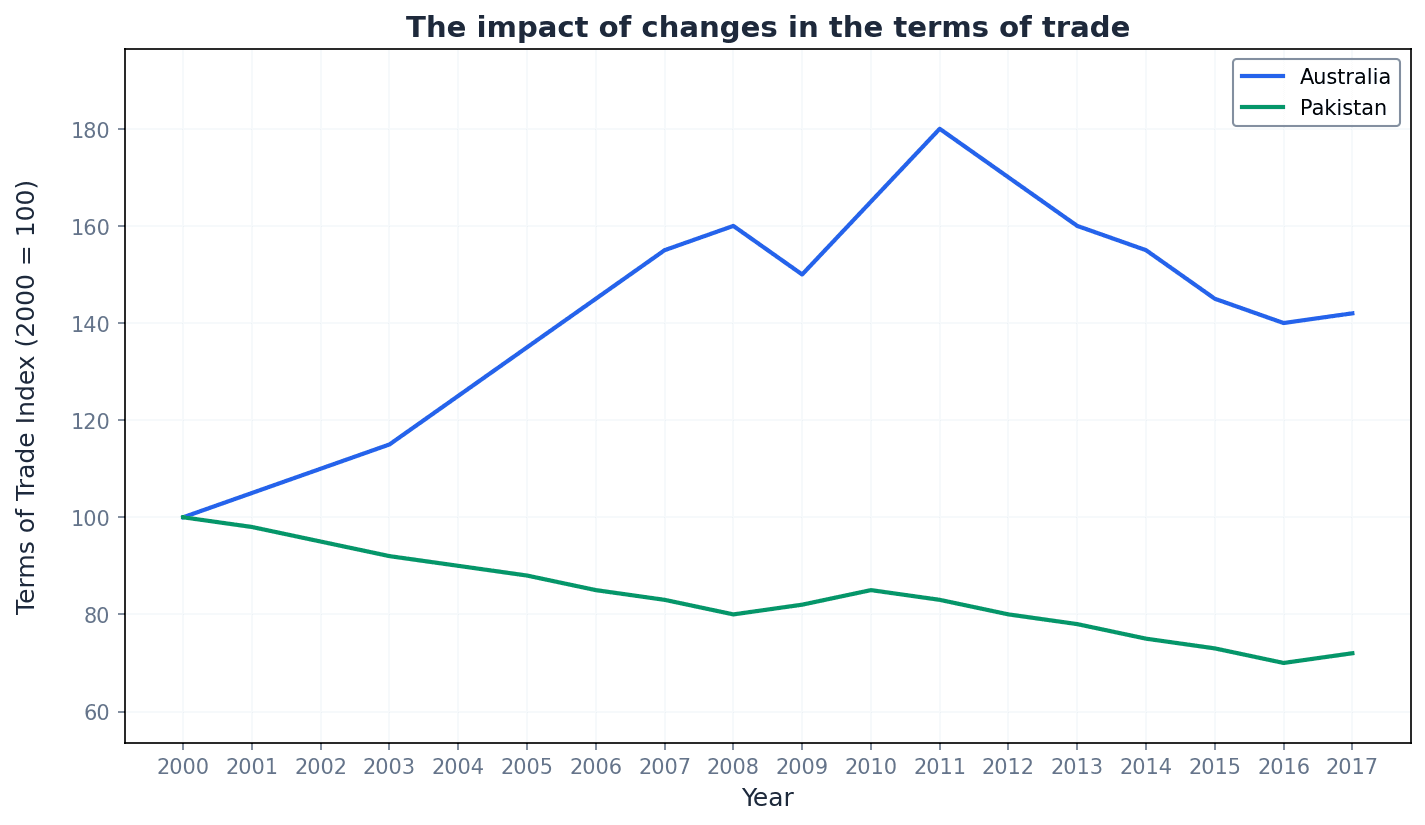
Prebisch-Singer hypothesis — The Prebisch-Singer hypothesis suggests that the terms of trade tend to move against countries that produce primary products.
This hypothesis is based on the view that as global incomes rise, the demand for manufactured goods and services increases proportionally more than the demand for primary products. This can lead to a long-term decline in the relative prices of primary products compared to manufactured goods. For example, a farmer selling raw ingredients might see their prices rise slower than a chef selling gourmet meals as people get richer.
When discussing this hypothesis, ensure you explain the underlying reason related to income elasticity of demand for primary vs. manufactured goods, and acknowledge recent volatility in commodity prices.
Students often think this hypothesis applies to all primary products at all times, but it's a long-term trend and commodity prices can experience short-term volatility, sometimes rising significantly.
While powerful, the theories of absolute and comparative advantage have limitations in real-world scenarios. They often assume perfect resource mobility, constant returns to scale, no transport costs, and the absence of trade barriers. In reality, resources are not perfectly mobile, returns to scale can vary, transport costs exist, and governments often impose tariffs or quotas, all of which can reduce or negate the theoretical gains from specialisation and free trade.
For evaluation marks, critique the theory of comparative advantage by mentioning its limitations (e.g., transport costs, assumed constant returns to scale, trade barriers).
When analysing a change in the Terms of Trade, always discuss both the CAUSE (e.g., change in global demand/supply) and the IMPACT on the current account.
Advantages & Disadvantages
Specialisation and Free Trade
Improvement in Terms of Trade
Evaluation Starters
Essay Structure Guide
Introduction
Begin by defining international trade and briefly introducing the core concepts of absolute and comparative advantage as the fundamental reasons for trade. State the main arguments you will explore, such as the benefits of specialisation and the role of the terms of trade.
Conclusion
Summarise the main arguments, reiterating that while the theories of trade provide a strong rationale for specialisation, real-world complexities and limitations mean that the benefits are not always fully realised or evenly distributed. Offer a final nuanced judgment on the overall importance of these theories in understanding international trade.
This chapter explores protectionism, defining it as government actions to shield domestic industries from foreign competition. It details various tools like tariffs and quotas, analyses their impact on economic agents, and discusses the key arguments for and against such measures.
Protectionism — Protectionism is when governments seek to protect domestic industries from foreign competition.
It involves the restriction of free trade, often aiming to increase the price competitiveness of domestic industries. This can be achieved through various tools that make imported goods more expensive or less available, much like a parent limiting a child's exposure to competitive sports until they are confident.
Students often think protectionism always benefits the domestic economy, but actually it can lead to inefficiencies, higher prices for consumers, and retaliation from other countries.
Tariffs — Tariffs are taxes, usually on imports but they may also be imposed on exports.
Also known as customs duties, tariffs can be specific (a fixed sum per unit) or ad valorem (a percentage of the price). They increase the cost of imported goods, making domestic products more competitive or raising government revenue, similar to an extra toll on foreign goods entering a country.
When analysing the impact of tariffs, remember to discuss effects on domestic producers, domestic consumers, government revenue, and the possibility of retaliation.
Students often think tariffs always make domestic products more price competitive, but actually if the import price plus tariff is still below the domestic price, or if foreign firms absorb the tariff, domestic competitiveness may not improve.
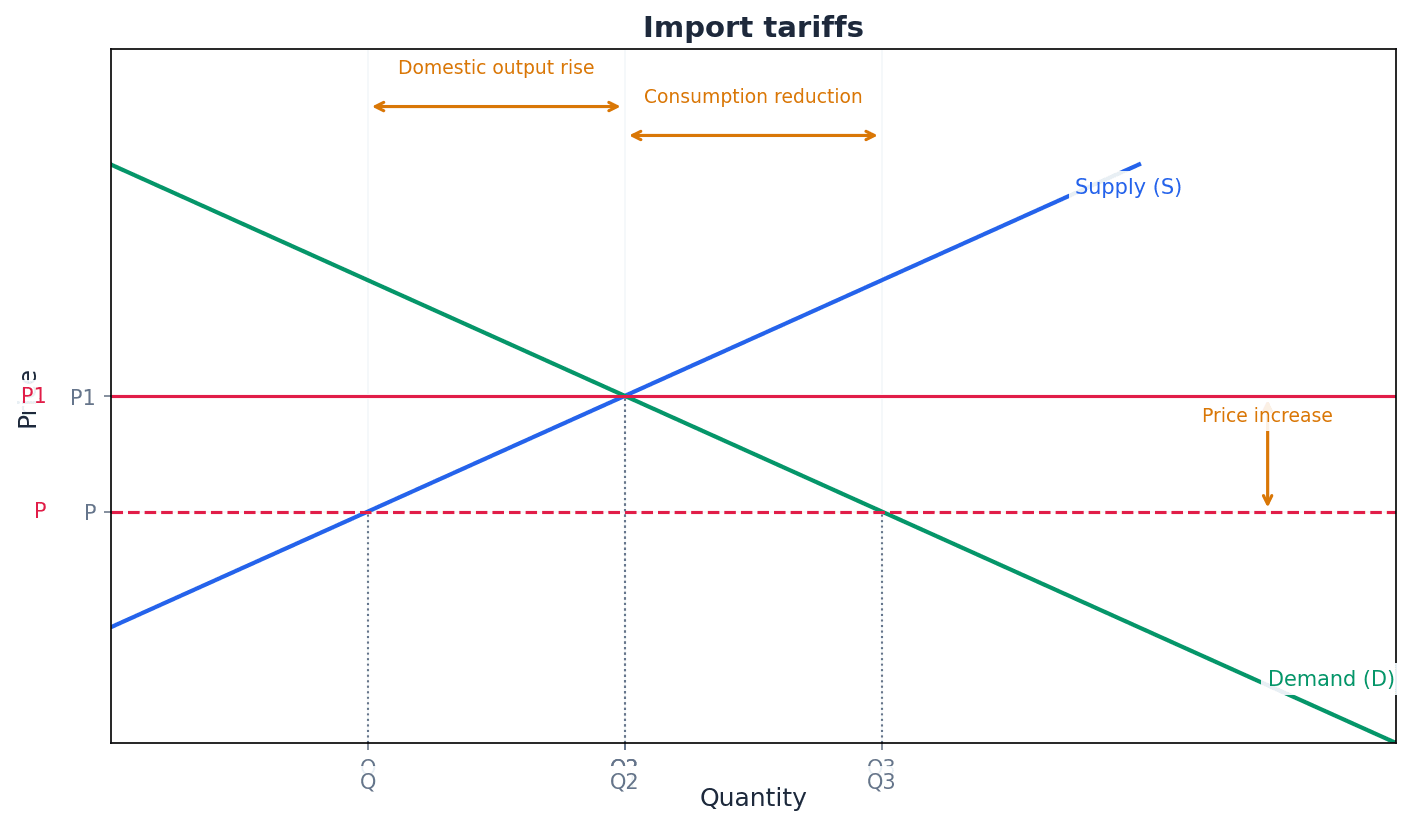
Quotas — Quotas are limits on imports, usually imposed on the quantity of imports.
By restricting the supply of imports, quotas tend to drive up their price, disadvantaging consumers through higher prices and reduced product availability. Unlike tariffs, quotas typically do not generate revenue for the government, unless licences are sold, much like a bouncer limiting the number of people entering a club.
Distinguish clearly between tariffs and quotas: tariffs raise revenue for the government, while quotas typically do not, with the extra amount per unit often going to the sellers of imports.
Students often think a reduction in a quota means less trade protection, but actually reducing the size of a quota means allowing fewer units of the good into the country, thus increasing trade protection.
Subsidies — Subsidies may be given to both exporters and to those domestic firms that compete with imports.
These payments effectively reduce the costs for domestic firms, encouraging them to increase output and lower prices. This can help them gain market share at home and abroad, but at the expense of foreign firms and domestic taxpayers, similar to a coach giving extra training and equipment to a specific player.
When discussing subsidies, remember to identify both the short-run benefits for consumers and the potential long-run drawbacks, such as inefficiency and higher prices if competition is eliminated.
Students often think subsidies always benefit consumers in the long run, but actually while consumers may benefit in the short run from lower prices, in the long run, they may lose if more efficient foreign firms are driven out and subsidised domestic firms raise prices.
Embargo — An embargo is a complete ban either on the imports of a particular product or on trade with a particular country.
Governments may impose embargoes on products deemed harmful (e.g., non-prescription drugs, weapons) or on trade with specific countries due to political disputes. It is the most extreme form of trade restriction, akin to a complete lockdown of a city.
When explaining an embargo, ensure you specify it is a 'complete ban' and provide examples of reasons, such as product harm or political disputes.
Students often think embargoes are only used for economic reasons, but actually they are frequently imposed due to political disputes or concerns over product safety.
Voluntary export restraints — Voluntary export restraints are an agreement by an exporting country to restrict the amount of a product that it sells to the importing country.
Also called voluntary export restrictions, these agreements are often a result of pressure from the importing country or a reciprocal agreement to limit other exports. They function similarly to quotas but are initiated by the exporting country, like friends agreeing to limit items brought to a party.
Highlight that while 'voluntary' is in the name, these restraints are often a result of political or economic pressure, making them a tool of protectionism for the importing country.
Students often think these are truly 'voluntary', but actually the exporting country may be pressured into signing such an agreement.
Excessive administrative burdens — Excessive administrative burdens, or 'red tape', involve requiring importers to fill out lengthy forms that are time-consuming to complete.
Governments may also set artificially high product standards to restrict foreign competition. These measures discourage imports by increasing the non-price costs and complexities for foreign firms, thereby restricting consumer choice, much like complex permit processes for a simple home renovation.
When discussing non-tariff barriers, remember to include both lengthy forms and artificially high product standards as examples of excessive administrative burdens.
Students often think protectionism only involves taxes or quantity limits, but actually non-tariff barriers like 'red tape' can be equally effective in restricting trade.
Exchange control — Exchange control is when a government places limits on the amount of foreign exchange that can be purchased in order to buy imports, travel abroad or invest abroad.
Instead of directly limiting imports, this tool restricts the financial means available to purchase them. By controlling access to foreign currency, a government can indirectly reduce import demand, similar to a parent giving a child a limited allowance specifically for toys.
Explain that exchange control is an indirect method of limiting imports by restricting the availability of foreign currency, rather than directly banning or taxing goods.
Students often think exchange control directly limits goods, but actually it limits the currency needed to buy those goods, which has an indirect effect on imports.
The various tools of protectionism, such as tariffs, quotas, and subsidies, have distinct impacts on different economic agents. Tariffs increase the cost of imported goods, benefiting domestic producers and generating revenue for the government, but at the expense of domestic consumers who face higher prices. Quotas limit the quantity of imports, driving up prices and benefiting domestic producers, but typically without generating government revenue. Subsidies reduce costs for domestic firms, boosting their competitiveness but burdening taxpayers.
Dumping — Dumping involves selling products at below their cost price.
This practice is often regarded as unfair competition. While home consumers may benefit in the short run from lower prices, in the long run, foreign firms engaging in dumping may drive out domestic firms, gain a monopoly, and then raise prices, much like a supermarket selling below cost to eliminate competition.
When discussing dumping, ensure you explain both the short-run benefit to consumers and the long-run potential harm to domestic industries and consumers due to monopoly power.
Students often think any low price from a foreign firm is dumping, but actually it's only dumping if the price is below cost, and it can be hard to distinguish from genuine comparative advantage.
Infant industries — Infant industries are firms in a new industry that may find it difficult to survive when faced with competition from more established, larger foreign firms.
Protection is given to these 'sunrise' industries to allow them time to grow, benefit from economies of scale, and gain an international reputation. The justification is that they have the potential to develop into efficient industries with a comparative advantage, much like a newborn baby needing protection to grow strong.
When arguing for infant industry protection, remember to include the potential for economies of scale and gaining an international reputation, but also the risks of dependency and difficulty in identifying truly viable industries.
Students often think protecting infant industries always leads to success, but actually there's a risk they become dependent on protection and fail to become efficient.
Declining industries — Declining industries, also called sunset industries, are those that have lost their comparative advantage.
Protection may be given to these industries to prevent a sudden and large rise in unemployment if they go out of business quickly. Gradual removal of protection allows workers to retire or move to other industries, easing the transition, similar to a person gradually reducing work hours before retirement.
When discussing declining industries, balance the argument of avoiding sudden unemployment with the risk of creating inefficiency and disadvantaging other competitive domestic industries.
Students often think protecting declining industries is always beneficial, but actually it can lead to considerable inefficiency and disadvantage other domestic industries that rely on their output.
Strategic industries — Strategic industries are those that produce products regarded as essential, such as weapons, fuel, and food.
Governments may protect these industries to avoid dependence on foreign supplies, especially in times of trade disputes or military conflict. This ensures national security and stability, even if the domestic industries are relatively inefficient, much like a country ensuring it has its own military.
When arguing for strategic industry protection, focus on national security and avoiding dependence on foreign supplies, even if it means accepting some domestic inefficiency.
Students often think 'strategic' only refers to military goods, but actually it includes any product vital for national security or well-being, like food and fuel.
Governments employ protectionist measures for several reasons. These include shielding nascent 'infant industries' to allow them to mature and achieve economies of scale, protecting 'declining industries' to manage unemployment and facilitate economic transition, and safeguarding 'strategic industries' vital for national security like food and fuel. Protectionism is also used to prevent 'dumping' by foreign firms and to potentially improve a country's terms of trade or balance of payments.
Despite the perceived benefits, protectionism carries significant drawbacks. It often leads to reduced competition within domestic markets, which can result in inefficiencies and higher prices for consumers. Consumers also face reduced choice and potentially lower quality goods. Furthermore, protectionist measures risk retaliation from trading partners, potentially escalating into 'trade wars' that harm all countries involved and disrupt global trade flows.
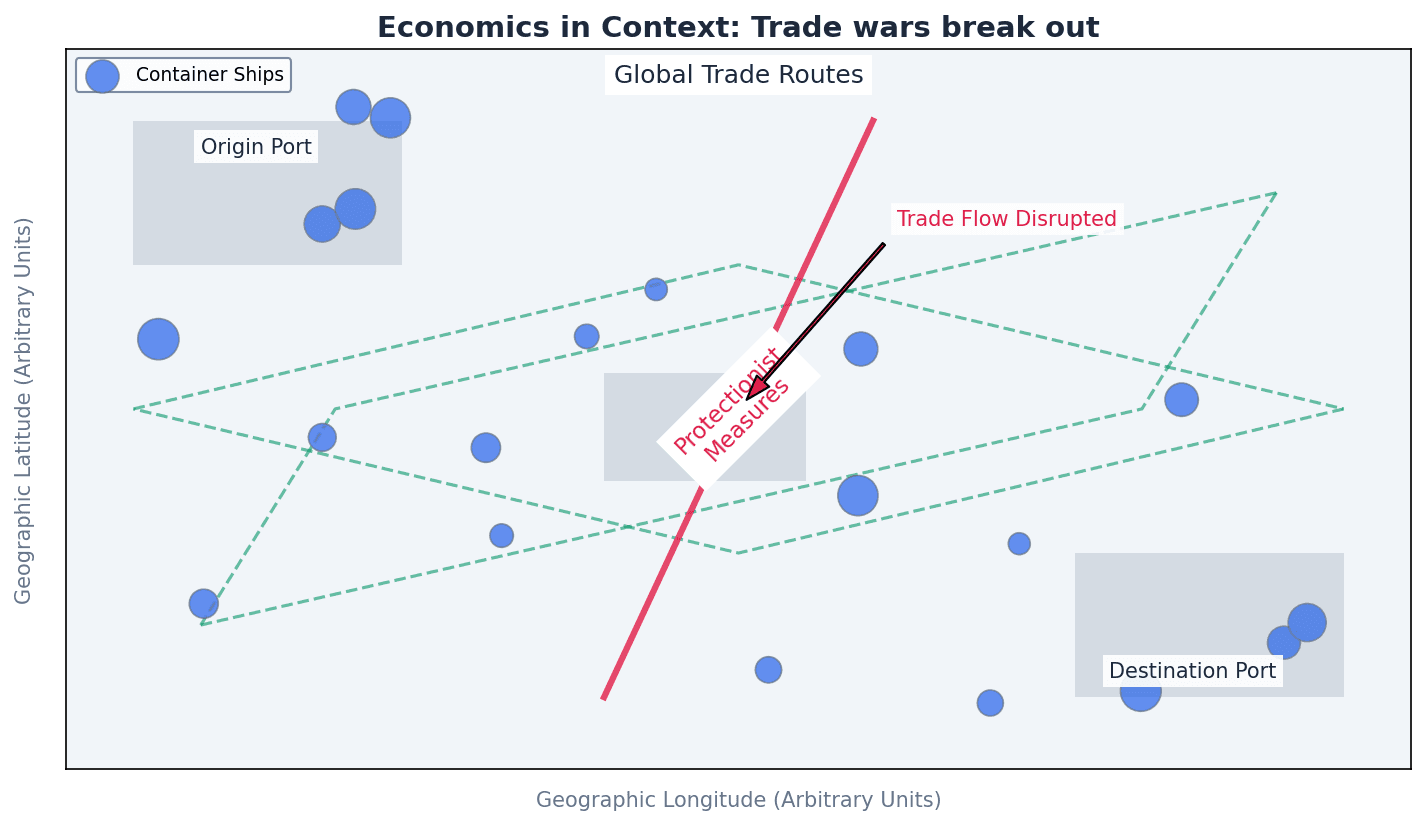
For evaluation, always consider the likelihood and impact of retaliation from trading partners, which can escalate into a 'trade war' and harm all countries involved.
In your conclusion, weigh the arguments. Acknowledge that while protectionism may have short-term benefits for specific industries, it generally leads to a net welfare loss for the economy.
Advantages & Disadvantages
Protectionism (General)
Tariffs
Evaluation Starters
Essay Structure Guide
Introduction
Begin by defining protectionism and briefly outlining the main tools and the core debate (benefits vs. costs). State your overall argument or stance on whether protectionism is generally beneficial.
Conclusion
Summarise your main arguments for and against protectionism. Reiterate your overall judgment, acknowledging that while specific industries might benefit in the short term, protectionism generally leads to a net welfare loss for the economy and can harm international relations.
This chapter explores the current account of the balance of payments, detailing its four components: trade in goods, trade in services, primary income, and secondary income. It explains how to calculate the overall balance and analyses the causes and consequences of current account deficits and surpluses for both the domestic and external economy.
balance of payments — A country’s balance of payments is a record of all the economic transactions between residents of that country and residents in other countries.
This comprehensive record tracks all money flowing into and out of a country from international activities, much like a household's bank statement. It encompasses the current account, capital account, and financial account, with money flowing in creating credit items and money flowing out creating debit items.
Students often think the balance of payments only refers to trade, but it includes all international economic transactions, encompassing goods, services, income, and transfers.
Trade in goods — Trade in goods refers to the exports and imports of goods such as cars, TVs and clothing.
This component, also known as the 'visible balance' or 'merchandise balance', tracks the buying and selling of physical products internationally. Exports generate credit items (money coming in), while imports generate debit items (money going out), with the balance calculated as export revenue minus import expenditure.
Trade in services — Trade in services refers to the trade in exports and imports of services, which may be referred to as ‘invisibles’.
This includes services like shipping, tourism, banking, and insurance. A country earns money from foreign tourists (exporting services) but spends money on foreign travel agencies for its own citizens' holidays (importing services). A deficit occurs when revenue from service exports is less than expenditure on service imports.
Students often think 'trade' only refers to goods, but actually it also includes services.
Primary income — Primary income includes income in the form of profits, interest and dividends earned on direct investment abroad and foreign earnings on investment in the country.
This is like a country's investment portfolio, tracking the income generated from existing investments and labour across borders. It includes profits, interest, and dividends from investments, as well as wages earned by a country's residents working abroad (employees’ compensation).
Students often confuse primary income (investment income, employees' compensation) with secondary income (transfers without direct exchange of goods/services).
Secondary income — Secondary income includes payments made and receipts received for which there is no corresponding exchange of an actual good or service.
This category covers unilateral transfers, like sending a gift or charity donation internationally, where money moves without a direct quid pro quo. Examples include government transfers such as foreign aid and payments to international organisations, as well as private transfers like workers’ remittances sent home by people working abroad.
When asked to define 'balance of payments', ensure you mention 'all economic transactions' and 'between residents of that country and residents in other countries' for full marks.
Be specific with examples of services (e.g., tourism, financial services, transport) rather than just stating 'services' when explaining this component.
Distinguish clearly between investment income (profits, interest, dividends) and employees' compensation when discussing primary income.
Balance of trade in goods
Also known as visible balance or merchandise balance. This calculates the net value of physical goods traded.
Balance of trade in services
Also known as invisibles balance. This calculates the net value of services traded.
Balance of trade in goods and services
Sometimes called the total trade balance. This combines the balances for both goods and services.
Current account balance
This formula calculates the overall balance of the four components of the current account.
The overall current account balance is determined by summing the balances of its four main components: trade in goods, trade in services, primary income, and secondary income. Credit items, representing money flowing into the country, are added, while debit items, representing money flowing out, are subtracted. A positive result indicates a surplus, while a negative result indicates a deficit.
When calculating, always show the breakdown of the four components before stating the final current account balance.
current account deficit — A current account deficit means that the combined debit items on the four parts of the current account balance are greater than the combined credit items on the four parts.
This implies a country is spending more on international transactions (imports, income outflows, transfers) than it is earning (exports, income inflows, transfers). Like a person spending more than they earn, it must be financed by attracting investment or borrowing from abroad.
current account surplus — A current account surplus occurs when the credit items on the four parts are greater than the combined debit items.
This means a country is earning more from international transactions than it is spending. While it allows for the accumulation of foreign assets, it can also indicate that residents are not enjoying as high a standard of living as possible or lead to inflationary pressure domestically.
Students often think a current account deficit is always a problem, but a cyclical deficit due to a growing domestic economy can be short-term and self-correcting.
Students often think a current account surplus is always beneficial, but it can indicate under-consumption domestically or lead to inflationary pressure.
Current account imbalances, whether deficits or surpluses, can stem from various factors. These causes are broadly categorised into cyclical factors, which are often temporary and linked to the business cycle, and structural problems, which are more fundamental and long-lasting. Understanding the underlying cause is crucial for assessing the significance of an imbalance.
cyclical deficit — A current account deficit that arises from either change in the economic cycle of the domestic economy or the economies of trading partners is sometimes referred to as a cyclical deficit.
This type of deficit is usually not considered a major problem as it is likely to be relatively short-term and self-correcting. For instance, a rapidly growing domestic economy might temporarily increase imports of raw materials and consumer goods, leading to a deficit that corrects as the growth rate stabilises.
structural deficit — A current account deficit that lasts over the long run is more of a concern.
This indicates that domestic firms are not internationally competitive, possibly due to an overvalued exchange rate, high inflation, low labour/capital productivity, poor education, or insufficient investment and innovation. Unlike cyclical deficits, structural deficits are not self-correcting and require policy intervention.
In essays on the causes of a deficit, always distinguish between cyclical factors (e.g., a domestic boom) and structural factors (e.g., low productivity).
A current account deficit can be caused by a growing domestic economy, which increases demand for imports, or by declining economic activity in a country’s trading partners, reducing demand for exports. More concerning are structural problems, such as a lack of international competitiveness due to factors like high inflation or low productivity, which lead to persistent deficits.
Conversely, a current account surplus can arise from a declining domestic economy, which reduces import demand, or from increasing economic activity in trading partners, boosting export demand. Structural advantages, such as high productivity or a competitive exchange rate, can also lead to a sustained surplus by making a country's exports highly desirable.
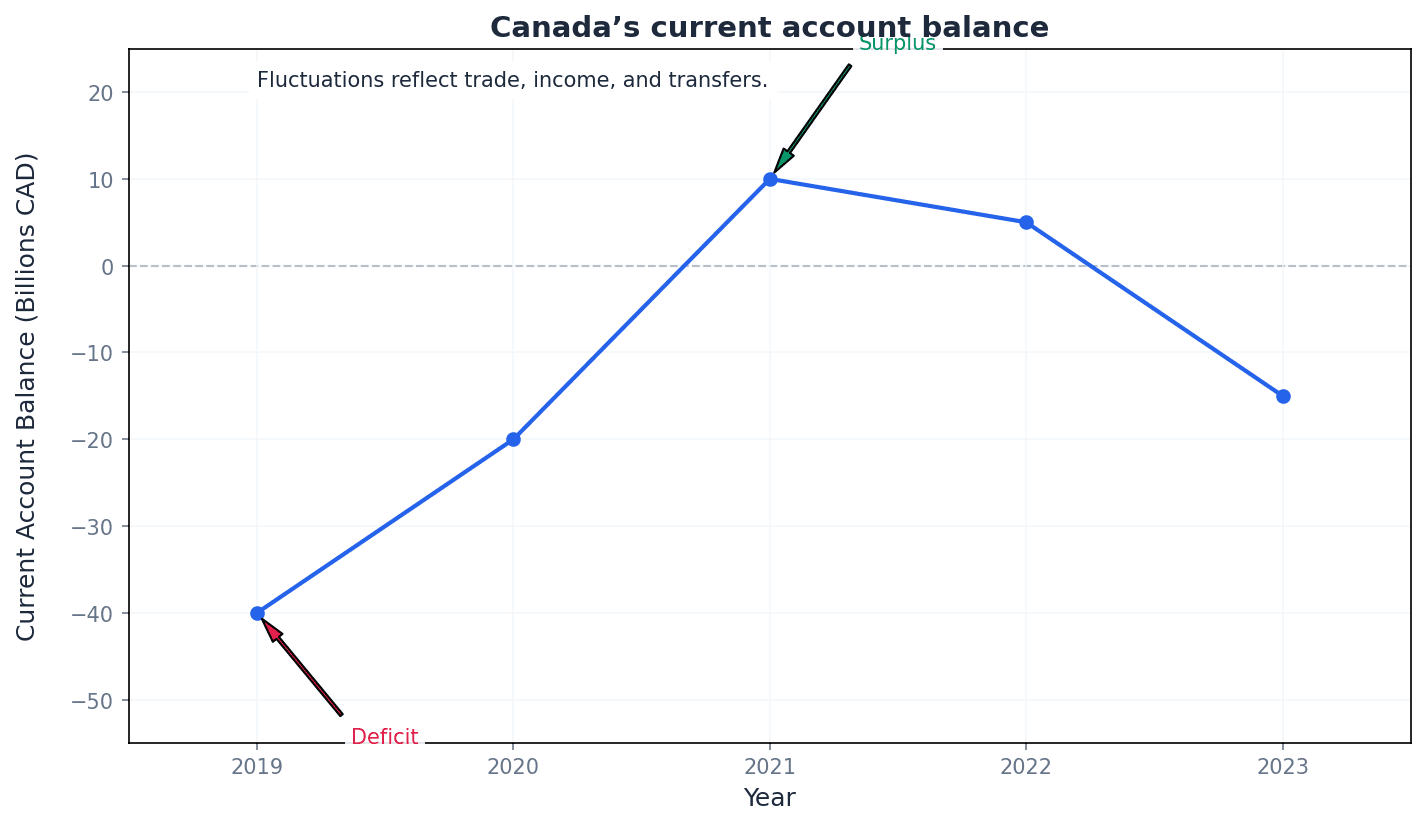
Current account deficits and surpluses have significant consequences for both the domestic and external economy. The significance of an imbalance is best assessed as a percentage of GDP, providing context to its scale. Deficits often require financing through borrowing or attracting foreign investment, potentially leading to future income outflows, while surpluses can indicate under-consumption or lead to inflationary pressures.
When discussing consequences, link a deficit to financing needs (borrowing, attracting investment) and potential future outflows of investment income.
To achieve higher marks, evaluate the significance of a deficit by considering its cause. A structural deficit is more concerning than a cyclical one.
When asked to evaluate an imbalance, discuss the consequences of BOTH a deficit and a surplus to show balanced analysis.
Advantages & Disadvantages
Current Account Deficit
Current Account Surplus
Evaluation Starters
Essay Structure Guide
Introduction
Begin by defining the current account of the balance of payments and briefly outlining its four components. State whether you will focus on deficits, surpluses, or both, and briefly mention the importance of assessing imbalances as a percentage of GDP.
Conclusion
Summarise your main arguments, reiterating the complexity of current account imbalances. Conclude by stressing that a nuanced understanding of the causes and context is essential for effective policy responses and for determining the true impact on an economy.
This chapter defines exchange rates and explains how floating exchange rates are determined by market forces. It differentiates between currency depreciation and appreciation, analysing their causes and discussing their significant impact on a domestic economy's national income, real output, price level, and employment using AD/AS analysis.
Foreign exchange rate — The foreign exchange rate is the price of one currency in terms of another currency.
It shows the external value of a currency, indicating how much of a foreign currency can be bought with a unit of the domestic currency, or vice versa. Changes in this rate affect the relative prices of exports and imports, much like the price of an apple in terms of oranges.
Students often think the exchange rate shows the internal value of a currency, but actually it shows the external value, while the price level shows the internal value.
When asked to 'define' the exchange rate, ensure you specify it's the price of one currency 'in terms of another currency' to gain full marks.
Floating exchange rate — A floating exchange rate is one determined by market forces.
This means the value of the currency is set by the interaction of demand for and supply of that currency on the foreign exchange market, without direct government intervention to fix its price. Its value can fluctuate freely, similar to the price of a popular toy determined solely by demand and supply.
Students often think 'floating' means completely uncontrolled, but actually central banks may still intervene occasionally to smooth out excessive fluctuations, even in a generally floating system.
When explaining how a floating exchange rate is determined, always refer to the 'demand for and supply of the currency' and the 'foreign exchange market'.
A floating exchange rate is determined by the market forces of demand and supply for a currency on the foreign exchange market. The equilibrium exchange rate is established where the quantity of currency demanded equals the quantity supplied. Any shifts in these demand or supply curves will lead to a change in the currency's value.
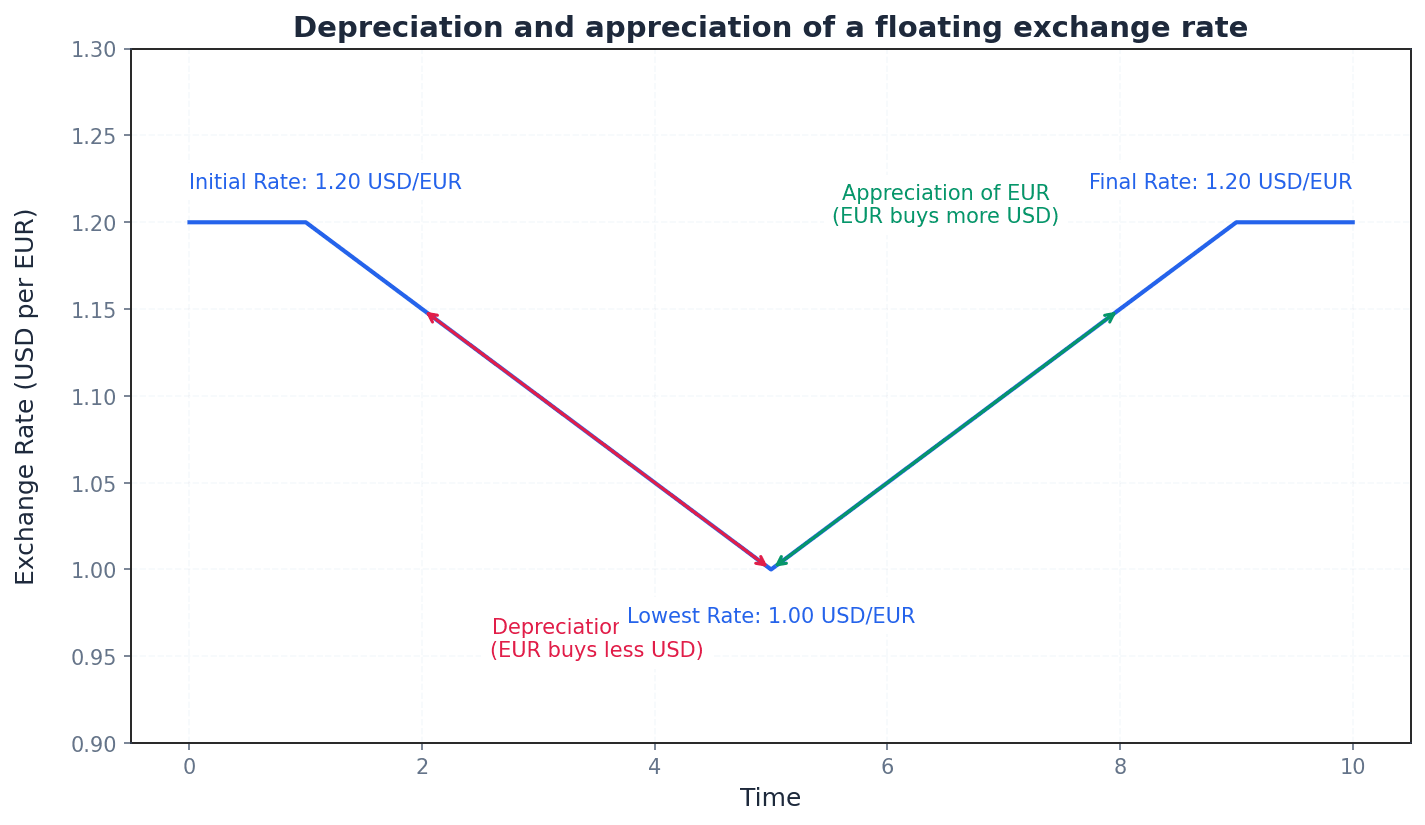
Depreciation — A fall in the value of a currency caused by market forces is known as a depreciation.
This means that more units of the domestic currency are needed to buy one unit of a foreign currency. It makes exports cheaper for foreigners and imports more expensive for domestic consumers, much like your local currency buying less US dollars than before.
Students often think depreciation is the same as devaluation, but actually depreciation is market-driven, while devaluation is a deliberate government decision in a fixed exchange rate system.
When analysing the effects of depreciation, remember to discuss both the impact on export prices (cheaper in foreign currency) and import prices (more expensive in domestic currency).
Appreciation — A rise in the value of the currency, caused by an increase in demand and/or a decrease in supply, is known as an appreciation.
This means fewer units of the domestic currency are needed to buy one unit of a foreign currency. It makes exports more expensive for foreigners and imports cheaper for domestic consumers, similar to your local currency buying more US dollars than before.
Students often think appreciation always benefits an economy, but actually while it makes imports cheaper, it can harm exporters by making their goods more expensive internationally.
When discussing appreciation, ensure you link it to changes in demand and/or supply of the currency and explain its dual impact on export and import prices.
Changes in a floating exchange rate are driven by shifts in the demand for and supply of a currency. Key causes include changes in trade (exports and imports), long-term investment (Foreign Direct Investment), interest rate differentials, and speculation. For instance, an increase in demand for a country's exports will increase demand for its currency, leading to appreciation.
Hot money flows — Short-term movements of money between countries seeking to gain a financial advantage by earning higher interest rates and buying currencies that are expected to rise in prices are sometimes referred to as hot money flows.
These flows are highly sensitive to interest rate differentials and exchange rate expectations, moving quickly between financial centres. They can cause significant fluctuations in a country's exchange rate, much like investors quickly moving funds to where they can find the highest returns.
Students often think hot money flows are primarily for long-term investment, but actually they are typically short-term and speculative, driven by quick profits rather than sustained growth.
When asked about causes of exchange rate changes, mentioning 'hot money flows' due to interest rate differentials or speculation demonstrates a deeper understanding of financial market influences.
Exchange rate changes have significant impacts on a domestic economy's equilibrium national income, real output, price level, and employment. These effects are typically analysed using the Aggregate Demand (AD) and Aggregate Supply (AS) model, as exchange rate movements influence net exports and the cost of imported raw materials.
National income — National income refers to the total income earned by a country's factors of production.
In the context of exchange rates, a depreciation can increase net exports, leading to higher aggregate demand and thus a rise in national income, similar to a country's overall 'paycheck' growing when more goods are sold abroad.
Real output — Real output refers to the total volume of goods and services produced in an economy, adjusted for inflation.
A depreciation can stimulate aggregate demand, leading to an increase in real output as firms produce more to meet higher demand. An appreciation can lead to a fall in real output, much like counting the actual number of goods produced rather than just their monetary value.
Price level — The price level is the average of current prices across the entire spectrum of goods and services produced in an economy.
A depreciation can lead to a rise in the domestic price level due to increased aggregate demand, more expensive imports, and higher costs of imported raw materials. An appreciation can reduce inflationary pressure, similar to the total cost of a giant shopping basket of goods.
Aggregate demand — Aggregate demand is the total demand for goods and services in an economy at a given price level and in a given time period.
A depreciation increases net exports, which is a component of aggregate demand, thus shifting the AD curve to the right. An appreciation reduces net exports, shifting the AD curve to the left, representing the total spending power of everyone in the country.
Aggregate supply — Aggregate supply is the total supply of goods and services produced within an economy at a given overall price level in a given time period.
An appreciation can shift the aggregate supply curve to the right by reducing the cost of imported raw materials, leading to lower production costs for domestic firms. A depreciation would have the opposite effect, representing the total amount of goods and services businesses are willing to produce.
A depreciation makes a country's exports cheaper for foreigners and imports more expensive for domestic consumers. This typically leads to an increase in net exports (X-M), which is a component of Aggregate Demand (AD). The AD curve shifts to the right, resulting in higher equilibrium national income, increased real output, and a higher price level. Additionally, more expensive imported raw materials can shift the Aggregate Supply (AS) curve to the left, contributing to cost-push inflation.
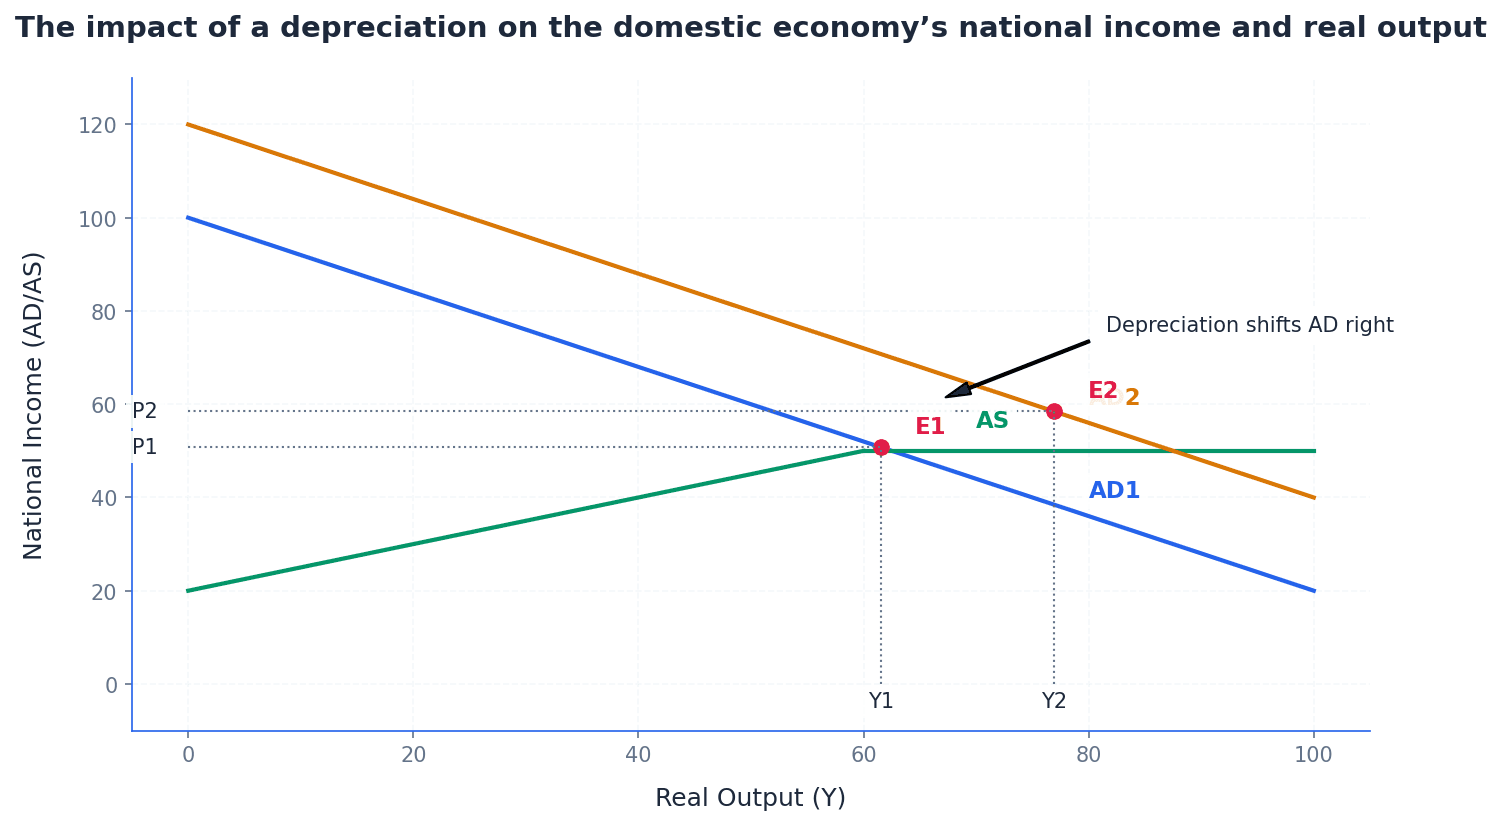
When using AD/AS analysis to discuss exchange rate impacts, clearly link changes in net exports to shifts in the AD curve and subsequent effects on national income and real output.
An appreciation makes a country's exports more expensive for foreigners and imports cheaper for domestic consumers. This typically leads to a decrease in net exports (X-M), shifting the Aggregate Demand (AD) curve to the left. This results in lower equilibrium national income, reduced real output, and a lower price level. Conversely, cheaper imported raw materials can shift the Aggregate Supply (AS) curve to the right, reducing cost-push inflationary pressures.
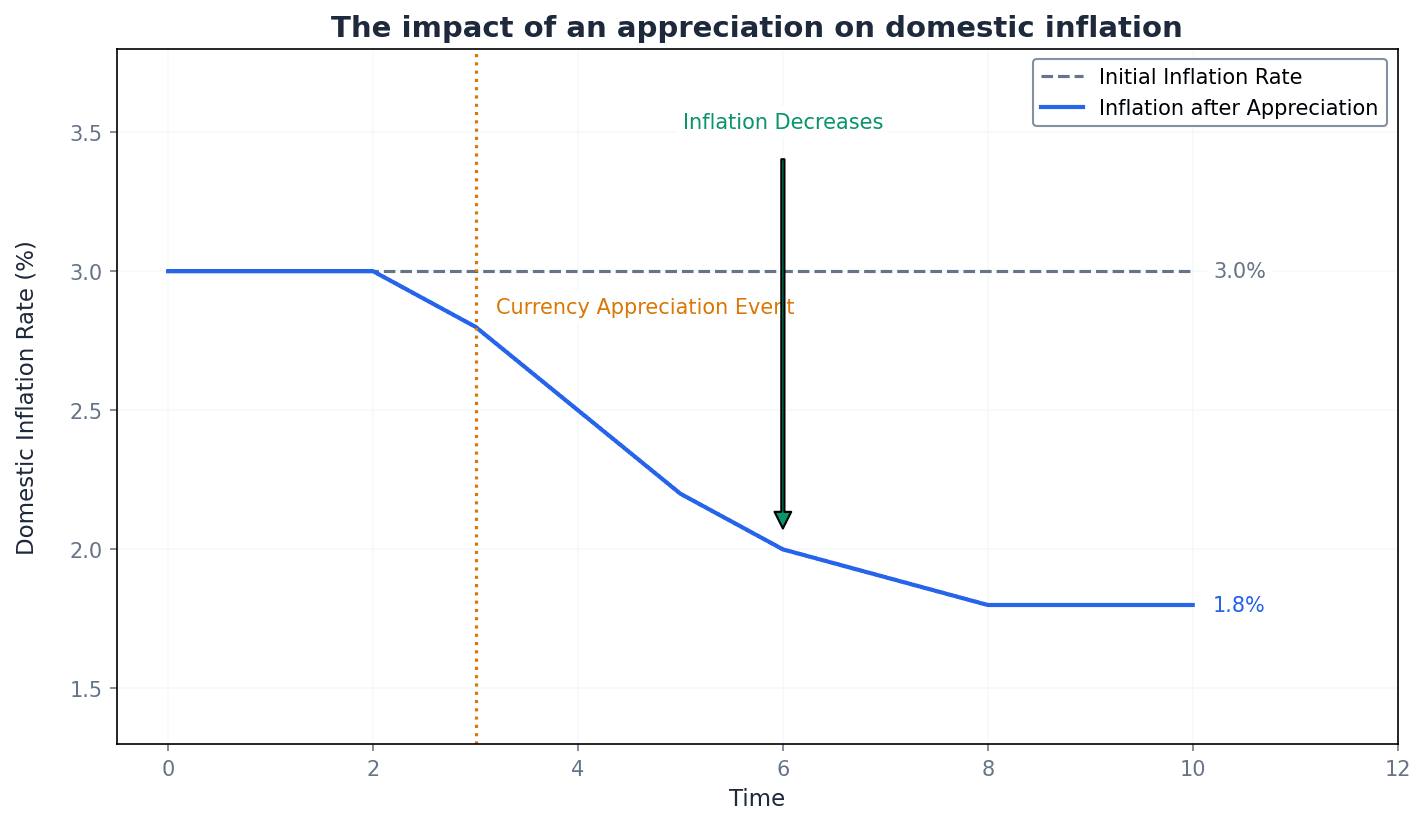
Always use two diagrams for impact analysis: 1) A D&S diagram for the currency market to show the change in the exchange rate. 2) An AD/AS diagram to show the resulting impact on the domestic economy's price level and real output.
Build a clear chain of reasoning. E.g., 'A rise in domestic interest rates -> attracts hot money flows -> increases demand for the currency -> causes appreciation -> exports become more expensive, imports become cheaper -> net exports (X-M) fall -> AD shifts left...'
When discussing depreciation's impact on inflation, analyse both demand-pull inflation (from the AD shift) and cost-push inflation (from more expensive imported raw materials shifting AS left).
Advantages & Disadvantages
Currency Depreciation
Currency Appreciation
Evaluation Starters
Essay Structure Guide
Introduction
Begin by defining the exchange rate and briefly explaining how a floating exchange rate is determined by market forces. State the main argument or the key impacts you will discuss.
Conclusion
Summarise the main impacts of exchange rate changes on the domestic economy. Reiterate the importance of market forces in determining floating rates and offer a final evaluative thought on the overall benefits or drawbacks.
This chapter examines government policies designed to correct imbalances in the current account of the balance of payments. It analyzes the impact of fiscal, monetary, supply-side, and protectionist policies on current account deficits and surpluses, considering their short-term and long-term effectiveness and potential side effects.
Current Account Deficit — A situation where more is spent on imports than earned from exports.
A current account deficit means a country is consuming more goods and services than it produces, with money leaving the country exceeding money entering. While it can allow for higher consumption and the import of productive capital goods in the short run, like a household consistently spending more than its income, it can lead to international debt if persistent.
Students often think that a current account deficit is always a negative economic indicator, but actually, a government may welcome one in the short run if it arises from importing more raw materials and capital goods, which can boost future production.
When assessing a current account deficit, always consider its size (as a % of GDP), duration, and cause. This nuanced approach is crucial for higher-level analysis marks in essay questions.
Current Account Surplus — A situation where there is a surplus of export revenue over import expenditure.
A current account surplus occurs when a country earns more from its exports than it spends on imports. This can boost aggregate demand and provide funds to repay external debt. However, like an individual earning a high salary but saving almost all of it, it also means the country is giving up the opportunity to buy foreign products it can afford.
Students often think a current account surplus is always beneficial, but actually, it can indicate an over-reliance on exports for growth and may lead to international political pressure and trade disputes, as seen with China and the USA.
In exam questions discussing the benefits of a surplus, balance your answer by also considering the drawbacks, such as the opportunity cost of lower domestic consumption and potential for international trade friction.
The government's primary objective regarding the current account is stability, aiming to avoid large, persistent deficits or surpluses. While a deficit can allow for higher consumption or the import of capital goods, a persistent one can lead to international debt. Conversely, a large surplus, while boosting aggregate demand, can signify weak domestic demand and worsen trading relations with other countries.
Fiscal policy involves the government adjusting taxation and spending to influence the economy. To correct a current account deficit, a contractionary fiscal policy is typically employed. This aims to reduce aggregate demand, thereby decreasing the demand for imports.
Contractionary Fiscal Policy — A policy involving increasing income tax and reducing government spending to reduce demand for goods and services, including imports.
This policy addresses a current account deficit by reducing households' disposable income through higher income tax, leaving less money for imports. Lower government spending directly cuts overall demand, which can also reduce imports and encourage domestic firms to seek export markets. It's like a family cutting spending to reduce debt, lowering their standard of living in the short term.
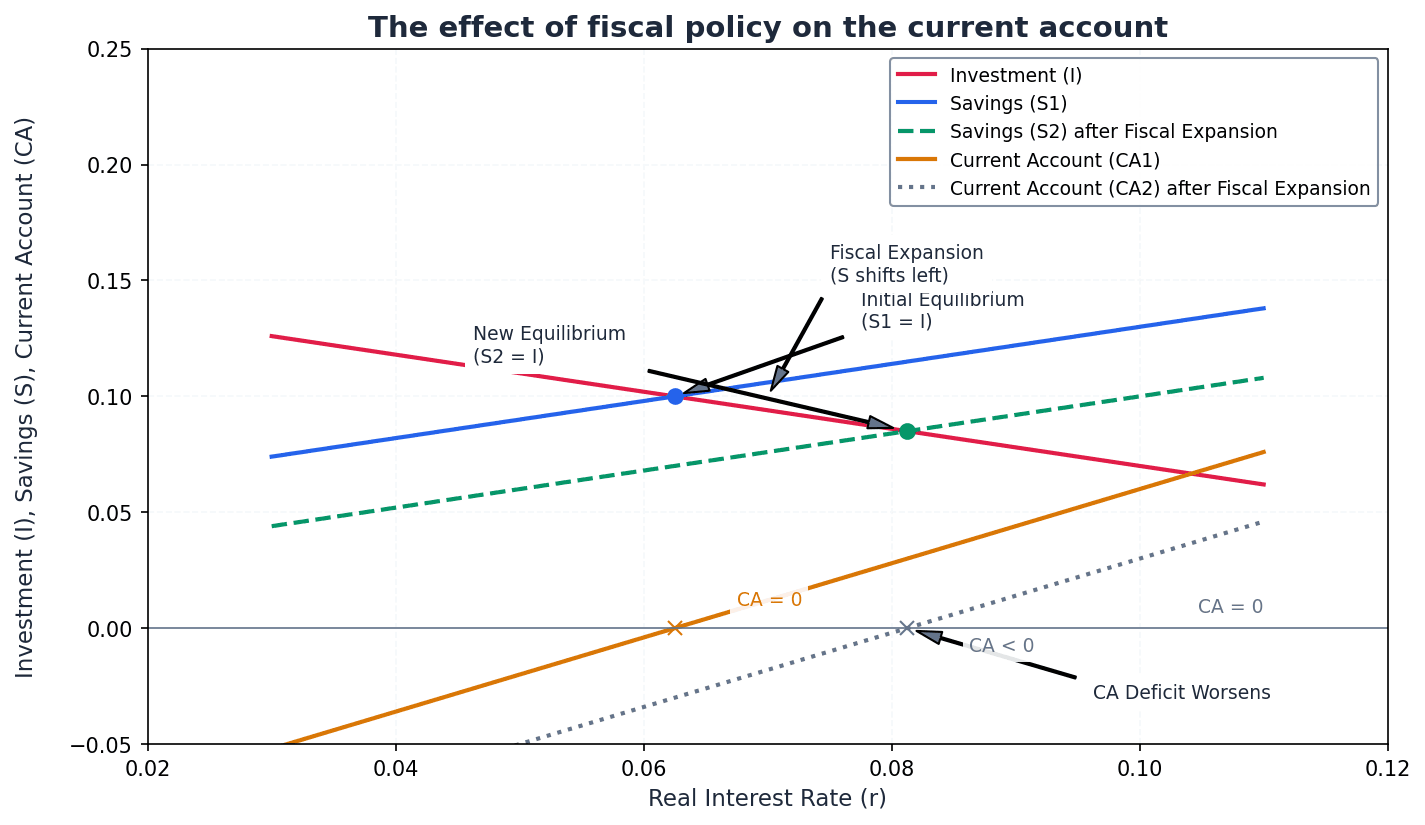
Students often think that fiscal policy measures are long-term solutions for current account imbalances, but actually, they are unlikely to be long-term solutions as households and firms may revert to previous spending patterns once policies stop.
When asked to evaluate contractionary fiscal policy, you must discuss its side effects. Mentioning the potential for increased unemployment, slower growth, and disincentive effects from higher taxes will demonstrate a balanced understanding.
Monetary policy, primarily through interest rate adjustments, can also influence the current account. To address a deficit, a contractionary monetary policy, such as raising interest rates, is used to curb consumer spending and investment, which includes spending on imports. This is considered a short-term solution.
Students often think that monetary policy tools are effective long-term solutions for current account imbalances, but actually, they are unlikely to be effective in the long-term because they often do not address structural weaknesses or strengths in the economy.
Supply-side policies offer a long-term approach to correcting current account imbalances by enhancing the fundamental competitiveness of an economy. These policies aim to improve the quantity and quality of a country's resources, making domestic products more attractive globally.
Supply-side Policy — Policies that aim to increase the quantity and quality of a country's resources to make domestic products more competitive.
These policies are a long-term strategy to correct a current account deficit by tackling structural weaknesses. Measures like deregulation, privatisation, spending on education and training, and trade union reform can increase efficiency, lower costs, and improve product quality. This makes domestic goods more attractive both at home and abroad, increasing exports and reducing import dependency, much like investing in education to improve long-term earning power.
Students often think supply-side policies are a quick way to fix a deficit, but actually, they are unlikely to be a quick way of correcting imbalances, though they have the potential to correct a deficit in the long run.
In questions asking for a long-term solution to a current account deficit, supply-side policy is the strongest candidate. Be sure to explain the mechanism, for example, how 'increased spending on education' leads to a 'more skilled labour force', which 'may reduce the relative price of domestic output and raise its quality', thus boosting exports.
Protectionist policies are expenditure-switching measures designed to directly reduce imports and encourage domestic consumption. These policies aim to make foreign goods less appealing or accessible to domestic consumers and firms.
Protectionist Policy — A policy, such as imposing a tariff, used as a way of encouraging domestic consumers and firms to switch to buying domestic products.
This policy directly targets imports to reduce a current account deficit. By imposing a tariff (a tax on imports), the government makes foreign goods more expensive, hoping consumers will buy cheaper, domestically produced substitutes instead. This is like a school cafeteria raising the price of outside snacks to encourage buying in-house.
Students often think imposing tariffs is a simple and effective way to fix a deficit, but actually, it may provoke retaliation from trading partners and may reduce the pressure on domestic firms to become more efficient.
When evaluating protectionism, use the key concept of efficiency. Explain that by shielding domestic firms from competition, tariffs may lead to a decline in productive, allocative, and dynamic efficiency, which is a significant drawback to weigh against the potential reduction in imports.
Always distinguish between short-run (fiscal, monetary) and long-run (supply-side) policies in your analysis.
For any policy, evaluate the potential negative side effects. For example, contractionary fiscal/monetary policy to cut a deficit can increase unemployment.
In evaluation, argue which policy is most appropriate by considering the root cause of the imbalance (e.g., excess demand vs. lack of competitiveness).
Advantages & Disadvantages
Contractionary Fiscal Policy to correct a deficit
Contractionary Monetary Policy to correct a deficit
Evaluation Starters
Essay Structure Guide
Introduction
Begin by defining the current account and explaining the government's objective of current account stability. Briefly outline the types of policies to be discussed (fiscal, monetary, supply-side, protectionist).
Conclusion
Summarise the main arguments, reiterating that there is no single 'best' policy and that the choice depends on the specific economic context, the nature of the imbalance, and the government's priorities. Emphasise the trade-offs involved and the importance of considering both short-term fixes and long-term structural solutions.
This chapter explores utility as a measure of satisfaction from consumption, differentiating between total and marginal utility. It explains the law of diminishing marginal utility and how consumers apply the equi-marginal principle to maximise total utility given limited income. The chapter also demonstrates the derivation of an individual demand curve and critically evaluates the limitations of rational consumer behaviour assumptions.
Utility — Utility is a measure of the level of happiness or satisfaction that someone receives from the consumption of a good.
Economists use utility to quantify satisfaction, assuming it can be measured in units. This concept helps explain why consumers are willing to pay different amounts for successive units of a good, as their satisfaction changes. For example, the first time you hear your favourite song, you get immense satisfaction (high utility), but the tenth time in a row, the additional satisfaction might be less.
Students often think utility is only about usefulness, but it specifically refers to the satisfaction or happiness derived from consumption.
When asked to define utility, ensure you include both 'happiness' and 'satisfaction' and link it directly to 'consumption of a good' for full marks.
total utility — Total utility is the overall satisfaction that is derived from the consumption of all units of a good over a given time period.
It is the sum of all marginal utilities from consuming each unit of a good. As consumption increases, total utility generally rises, but at a decreasing rate due to diminishing marginal utility. For instance, if you eat three slices of pizza, your total utility is the combined satisfaction from all three slices.
marginal utility — Marginal utility is the additional utility derived from the consumption of one more unit of a particular good.
It is the change in total utility resulting from consuming one extra unit. The law of diminishing marginal utility states that this additional satisfaction tends to decrease as more units are consumed. If your first slice of pizza gives you 10 units of satisfaction and your second gives you 5 units, the marginal utility of the second slice is 5 units.
Students often think total utility always increases at a constant rate, but it increases at a decreasing rate once diminishing marginal utility sets in, and can even fall if marginal utility becomes negative.
When calculating total utility, remember it's the sum of marginal utilities up to that point. Clearly distinguish it from marginal utility in your explanations.
diminishing marginal utility — The law of diminishing marginal utility suggests that as consumption of a good increases, the marginal utility will get smaller.
This principle explains why consumers are willing to pay less for successive units of a good. The satisfaction gained from each additional unit decreases, even if total satisfaction is still rising. For example, after a long run, your first glass of water is incredibly satisfying, but subsequent glasses provide less additional satisfaction.
Students often think diminishing marginal utility means total utility is falling, but it means total utility is increasing at a slower rate, or that the *additional* satisfaction is getting smaller.
When explaining diminishing marginal utility, use clear examples and link it to the reduced willingness to pay for additional units. This concept is crucial for deriving the demand curve.
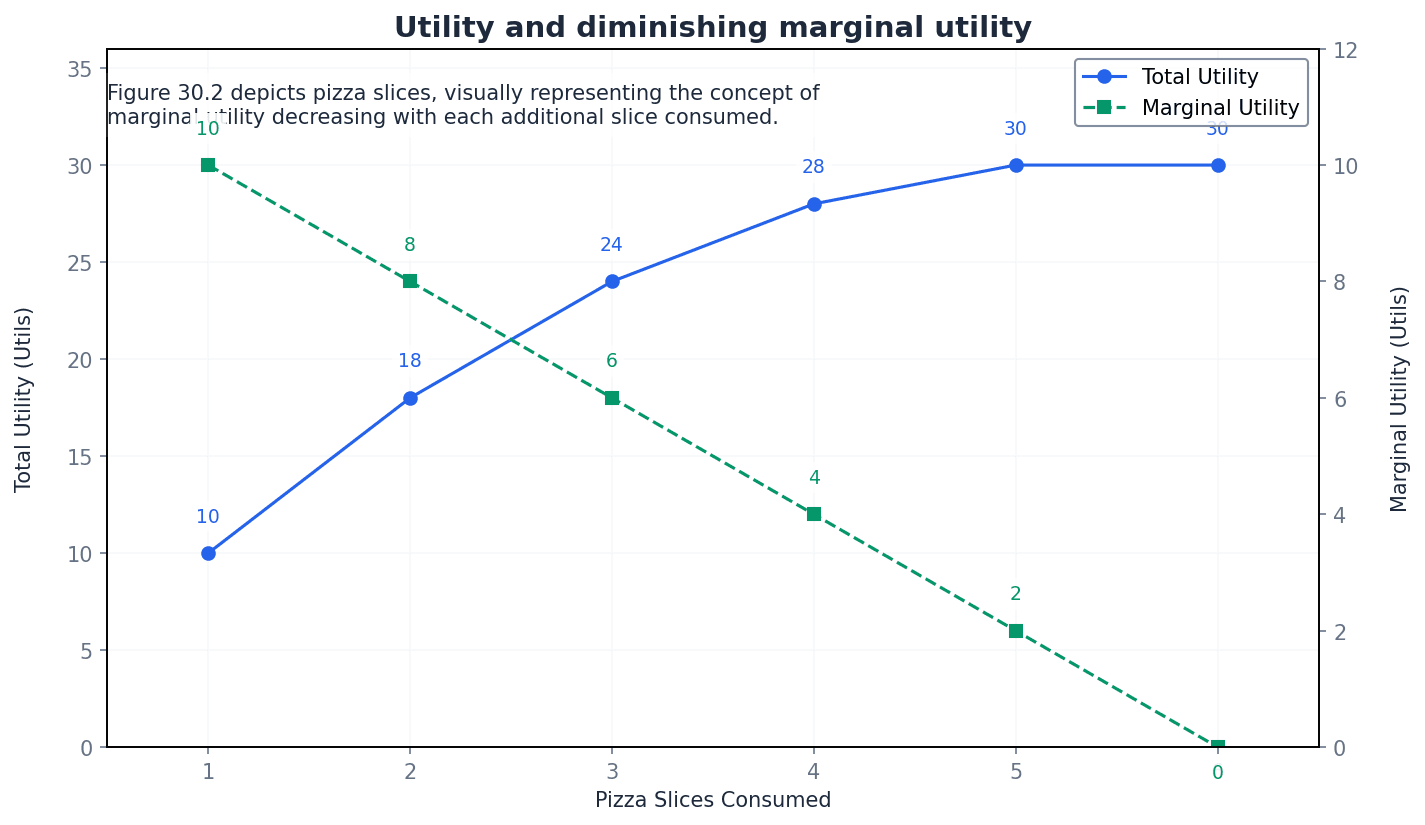
equi-marginal principle — The equi-marginal principle states that a consumer is in equilibrium when it is not possible to switch any expenditure from one product to another to increase total utility.
This occurs when the ratio of marginal utility to price (MU/P) is equal for all goods consumed. It ensures that the last dollar spent on each good yields the same amount of additional satisfaction, thus maximising total utility. Imagine you have a budget for snacks; you'll keep buying different snacks until the 'satisfaction per dollar' is the same for the last unit of each snack.
Equi-marginal principle
Used to determine consumer equilibrium where total utility is maximised given limited income. Assumes rational behaviour and utility maximisation.
Students often think the equi-marginal principle means marginal utility is equal for all goods, but it means the *marginal utility per dollar spent* (MU/P) is equal for all goods.
When applying the equi-marginal principle, always state the formula MU_A/P_A = MU_B/P_B = ... and explain that it represents consumer equilibrium where utility is maximised given limited income.
individual demand curve — An individual demand curve shows the quantity of a good that a single consumer is willing and able to purchase at different prices over a given period.
It can be derived from marginal utility theory by showing how a consumer's utility-maximising quantity demanded changes as the price of a good changes, assuming other factors remain constant. If the price of your favourite coffee drops, you might buy more cups because the satisfaction per dollar spent has increased, leading to a new utility-maximising point.
The individual demand curve is downward sloping because as the price of a good falls, the marginal utility per dollar spent (MU/P) for that good rises. This incentivises the consumer to purchase more of that good to restore equilibrium according to the equi-marginal principle. By plotting these utility-maximising quantities at different prices, an individual's demand curve is formed.
Students often think an individual demand curve is the same as a market demand curve, but it represents the demand of a single consumer, whereas market demand aggregates all individual demands.
When deriving a demand curve from utility theory, clearly show how a change in price alters the MU/P ratio, leading to a new equilibrium quantity demanded, and then plot these price-quantity pairs.
Marginal utility theory assumes consumers are rational and aim to maximise their total utility. However, in reality, consumers may lack perfect information, be influenced by biases, advertising, or habits, and may not always make decisions based on precise utility calculations. These factors can lead to purchasing decisions that deviate from the theoretical predictions of utility maximisation.
Students often assume consumers always act rationally as prescribed by economic theory, but real-world evidence shows other factors influence purchasing decisions.
For evaluation, critique the assumption of rational behaviour. Mention that consumers may lack perfect information or be influenced by biases.
Use a clear diagram to show the relationship between Total Utility and Marginal Utility, labelling the point where TU is maximised (where MU=0).
Advantages & Disadvantages
Marginal Utility Theory
Rational Consumer Behaviour
Evaluation Starters
Essay Structure Guide
Introduction
Begin by defining utility, total utility, and marginal utility. State the chapter's aim: to explain how consumers maximise utility and how this links to demand, while acknowledging limitations.
Conclusion
Summarise the core concepts of utility and its role in consumer choice. Reiterate the strengths of the theory in explaining demand, but conclude by emphasising its limitations in fully capturing the complexities of real-world consumer behaviour.
This chapter explores consumer behaviour using indifference curves and budget lines. Indifference curves illustrate combinations of goods yielding equal satisfaction, while budget lines show affordable combinations given income and prices. The model helps analyse how price changes lead to substitution and income effects, impacting consumption of normal, inferior, and Giffen goods, despite its real-world limitations.
indifference curve — An indifference curve shows all of the combinations of two goods that give the consumer equal satisfaction or utility.
These curves are downward-sloping and convex to the origin, reflecting the marginal rate of substitution. Higher indifference curves represent higher levels of satisfaction, which rational consumers always prefer. Imagine choosing between pizza slices and soda cans; an indifference curve shows all combinations that make you equally happy.
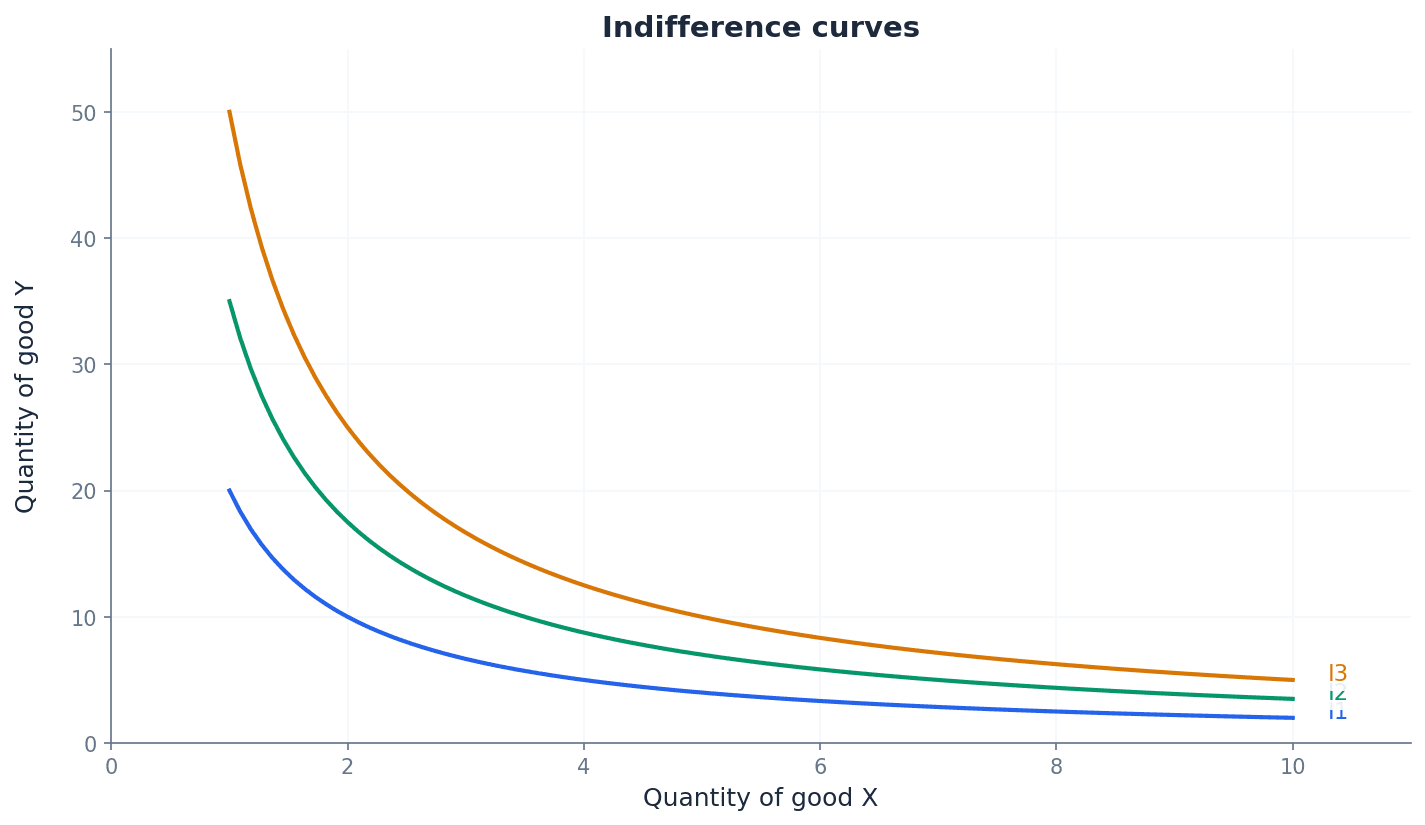
Students often think indifference curves can cross, but actually they cannot because that would imply a consumer is irrational, getting different levels of satisfaction from the same combination of goods.
When asked to draw indifference curves, ensure they are downward-sloping, convex to the origin, and do not cross. Label axes clearly as 'Quantity of good X' and 'Quantity of good Y'.
indifference map — An indifference map is a diagram showing a number of different indifference curves.
It illustrates multiple levels of satisfaction, with curves further from the origin representing higher utility. Rational consumers aim to reach the highest possible indifference curve given their budget. Think of a contour map showing different altitudes on a mountain; each contour line represents a specific height, just as each indifference curve represents a specific level of satisfaction.
Students often think all points on an indifference map give equal satisfaction, but actually only points on the *same* indifference curve give equal satisfaction; different curves represent different satisfaction levels.
marginal rate of substitution — The rate at which the consumer is willing to substitute one good for another in this way is known as the marginal rate of substitution.
It is represented by the slope of the indifference curve. As a consumer has more of one good, they are willing to give up less of the other good to obtain an additional unit of the first, leading to the convex shape. For example, if you have a lot of chocolate and very little fruit, you might be willing to give up a lot of chocolate for just one more piece of fruit.
Students often think the marginal rate of substitution is constant, but actually it diminishes as you move along an indifference curve, reflecting the decreasing willingness to give up one good for another.
Explain that the diminishing marginal rate of substitution is why indifference curves are convex. Avoid confusing it with the marginal rate of transformation from a production possibility frontier.
budget line — A budget line shows numerically all the possible combinations of two goods that a consumer can purchase with a given income and given prices of the two goods.
It represents the consumer's budget constraint, illustrating the trade-offs between two goods given their income and prices. Any point on or below the line is affordable, while points above are not. Imagine you have 1 each) and bananas ($2 each); the budget line shows all the combinations you can buy.
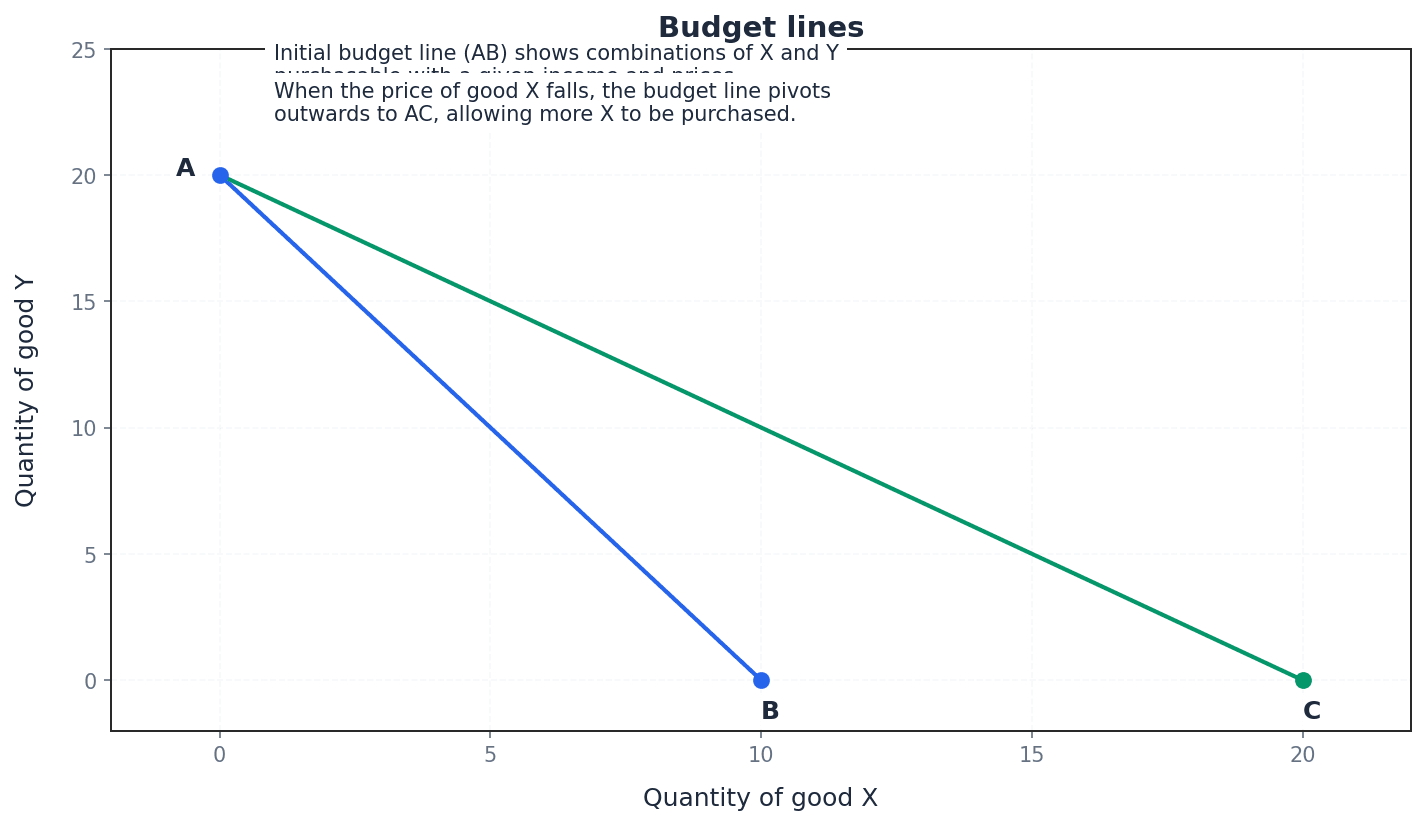
Students often think a budget line represents satisfaction, but actually it only represents affordability; satisfaction is shown by indifference curves.
When drawing a budget line, ensure it is a straight line. A change in price of one good causes a pivot, while a change in income causes a parallel shift. Label the axes with the quantities of the two goods.
The budget line can shift or pivot due to changes in income or prices. An increase in income causes a parallel outward shift of the budget line, allowing the consumer to afford more of both goods. Conversely, a decrease in income causes an inward parallel shift. A change in the price of one good causes the budget line to pivot along the axis of the good whose price has changed, altering the slope of the budget line.
Consumer equilibrium occurs where the budget line is tangent to the highest possible indifference curve, representing the optimal combination of goods given income and prices. When the price of a good changes, this equilibrium shifts, leading to two distinct effects on consumption: the substitution effect and the income effect. These effects explain how consumers adjust their purchasing decisions.
substitution effect — As the price of X has fallen relative to that of Y, which is unchanged, consumers will substitute X for Y. This is known as the substitution effect of a price change.
It is the change in consumption of a good due to a change in its relative price, holding real income constant. Consumers always substitute towards the relatively cheaper good. For example, if the price of coffee drops but tea stays the same, you might buy more coffee and less tea, substituting the cheaper coffee.
In diagrams, the substitution effect is shown by a movement along the *original* indifference curve to a point where the slope matches the new relative prices. It is always positive (more of the relatively cheaper good).
income effect — With the fall in the price of X, the consumer actually has more money to spend on other goods, X included. Real income has therefore increased, which may mean that a consumer may now purchase even more of good X. This is called the income effect of a price change.
It is the change in consumption of a good due to a change in real income resulting from a price change, holding relative prices constant. The income effect can be positive (normal goods) or negative (inferior/Giffen goods). If the price of your favourite snack drops, it's like having extra money, which you might use to buy more of that snack or other items.
Students often think the income effect is always positive, but actually it can be negative for inferior goods, meaning less of the good is consumed as real income rises.
In diagrams, the income effect is shown by a parallel shift of the budget line, moving from one indifference curve to another. Clearly distinguish between positive and negative income effects based on the type of good.
For a normal good, a fall in price leads to both a positive substitution effect and a positive income effect. The substitution effect causes consumers to buy more of the good because it is relatively cheaper. The income effect, due to increased real purchasing power, also leads to buying more of the good. Both effects reinforce each other, resulting in an overall increase in quantity demanded.
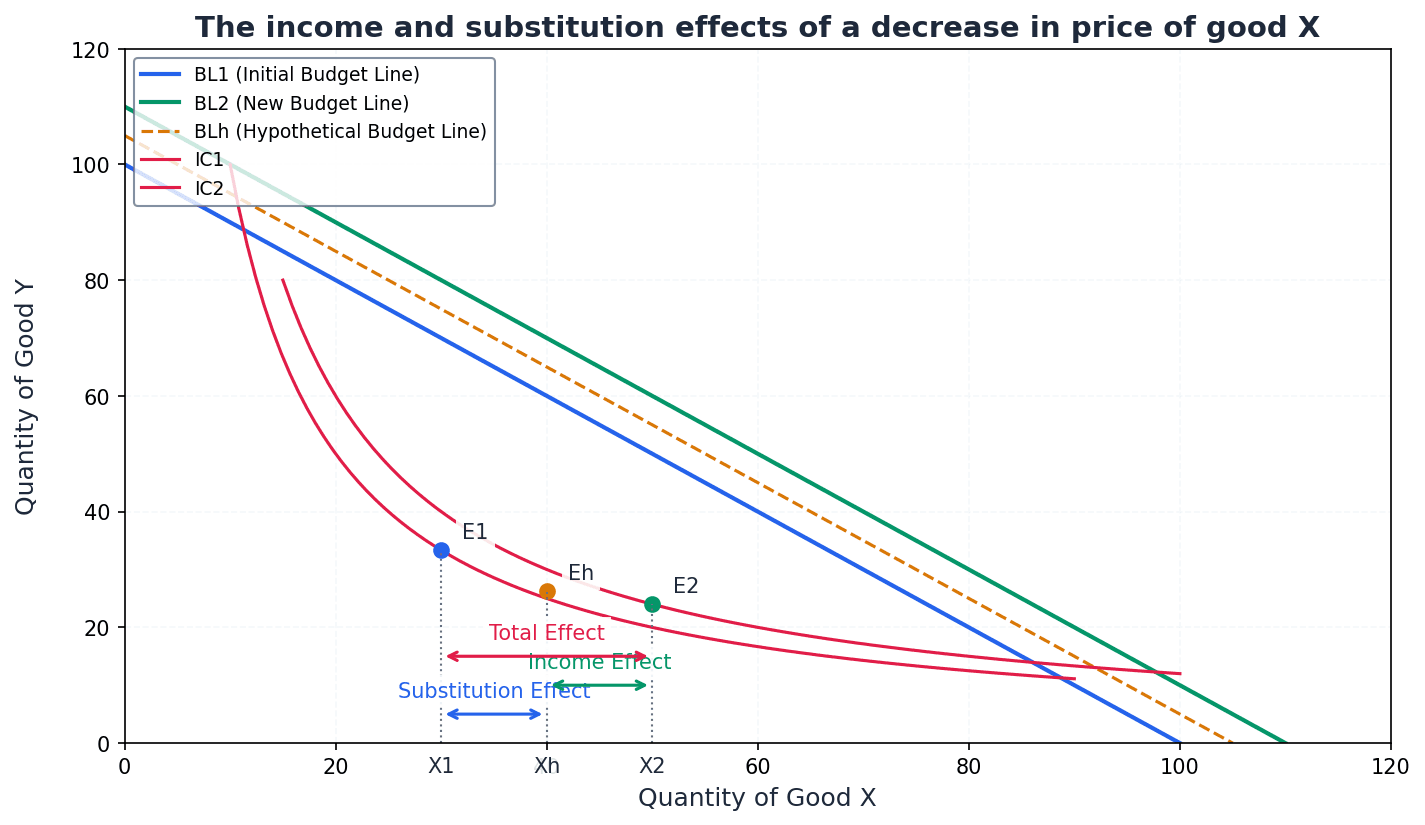
For an inferior good, a fall in price still results in a positive substitution effect, as consumers substitute towards the relatively cheaper good. However, the income effect is negative: as real income increases due to the price fall, consumers demand less of the inferior good. Typically, the positive substitution effect outweighs the negative income effect, so the overall quantity demanded still rises when the price falls.
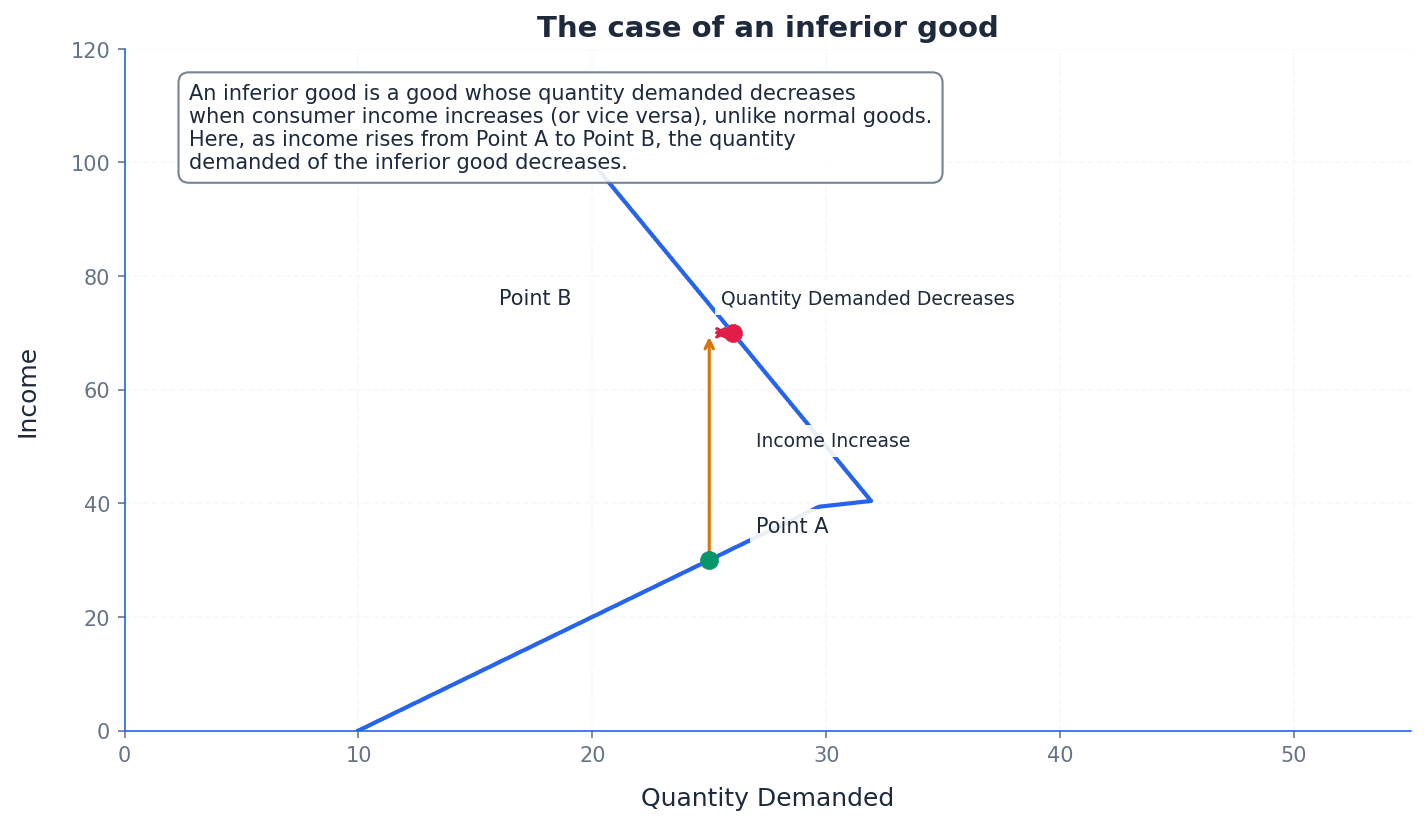
Giffen good — A Giffen good is one where if the price of the good falls, demand falls and demand increases as the price increases.
This is an unusual type of inferior good where the negative income effect is so strong that it outweighs the positive substitution effect. For low-income families, this could be a staple food where a price fall frees up income to buy more preferred, expensive goods, reducing demand for the staple. Imagine a very poor family whose main food is cheap rice; if the price of rice falls, they might buy less rice to afford other goods.
Students often think all inferior goods are Giffen goods, but actually Giffen goods are a rare subset of inferior goods where the income effect is not only negative but also *stronger* than the substitution effect.
When analysing Giffen goods, explicitly state that the income effect is negative and greater than the substitution effect, leading to an upward-sloping demand curve. This is a key distinguishing feature.
While a powerful analytical tool, the model of indifference curves has limitations. It assumes rational consumers with perfect information, which may not hold in reality. The model also struggles with measuring satisfaction or utility objectively, as it is a subjective concept. Furthermore, it typically analyses only two goods, simplifying complex real-world consumption choices.
Always draw large, fully-labelled diagrams. Label axes, budget lines (BL1, BL2), indifference curves (IC1, IC2), and equilibrium points (E1, E2).
To separate the income and substitution effects, draw a hypothetical budget line parallel to the new budget line but tangent to the original indifference curve.
For evaluation questions, critique the model's limitations, such as the assumption of rational consumers with perfect information and the difficulty of measuring satisfaction.
Advantages & Disadvantages
Indifference Curve Analysis
Understanding Giffen Goods
Evaluation Starters
Essay Structure Guide
Introduction
Begin by defining indifference curves and budget lines, stating their purpose in analysing consumer behaviour. Briefly outline how the model explains consumer equilibrium and the effects of price changes.
Conclusion
Summarise the key insights provided by the indifference curve and budget line model in understanding consumer choices. Reiterate its strengths as an analytical tool while acknowledging its theoretical limitations in fully capturing real-world complexities.
This chapter explores various types of economic efficiency, including productive, allocative, Pareto optimality, and dynamic efficiency, outlining their conditions. It then defines market failure as the inability of a free market to achieve an efficient allocation of resources, detailing its causes and consequences. The chapter emphasizes that efficiency is a desirable state for resource allocation at both microeconomic and macroeconomic levels.
Productive efficiency — Productive efficiency occurs when firms produce at the lowest possible cost, making the best use of resources.
This means that for a given set of inputs, the maximum possible output is produced, or a given output is produced with the minimum possible resources. In a competitive market, firms are incentivised to achieve productive efficiency to maximise profits or avoid bankruptcy. Imagine a baker who can make the most number of loaves of bread using the least amount of flour, yeast, and oven time compared to any other baker; this baker is productively efficient.
Students often confuse productive efficiency with simply producing a lot; it specifically means producing at the lowest possible average cost.
When asked to explain productive efficiency, ensure you link it to 'lowest possible cost' or 'minimum average cost' and can illustrate it using a firm's average cost curve or a PPC.
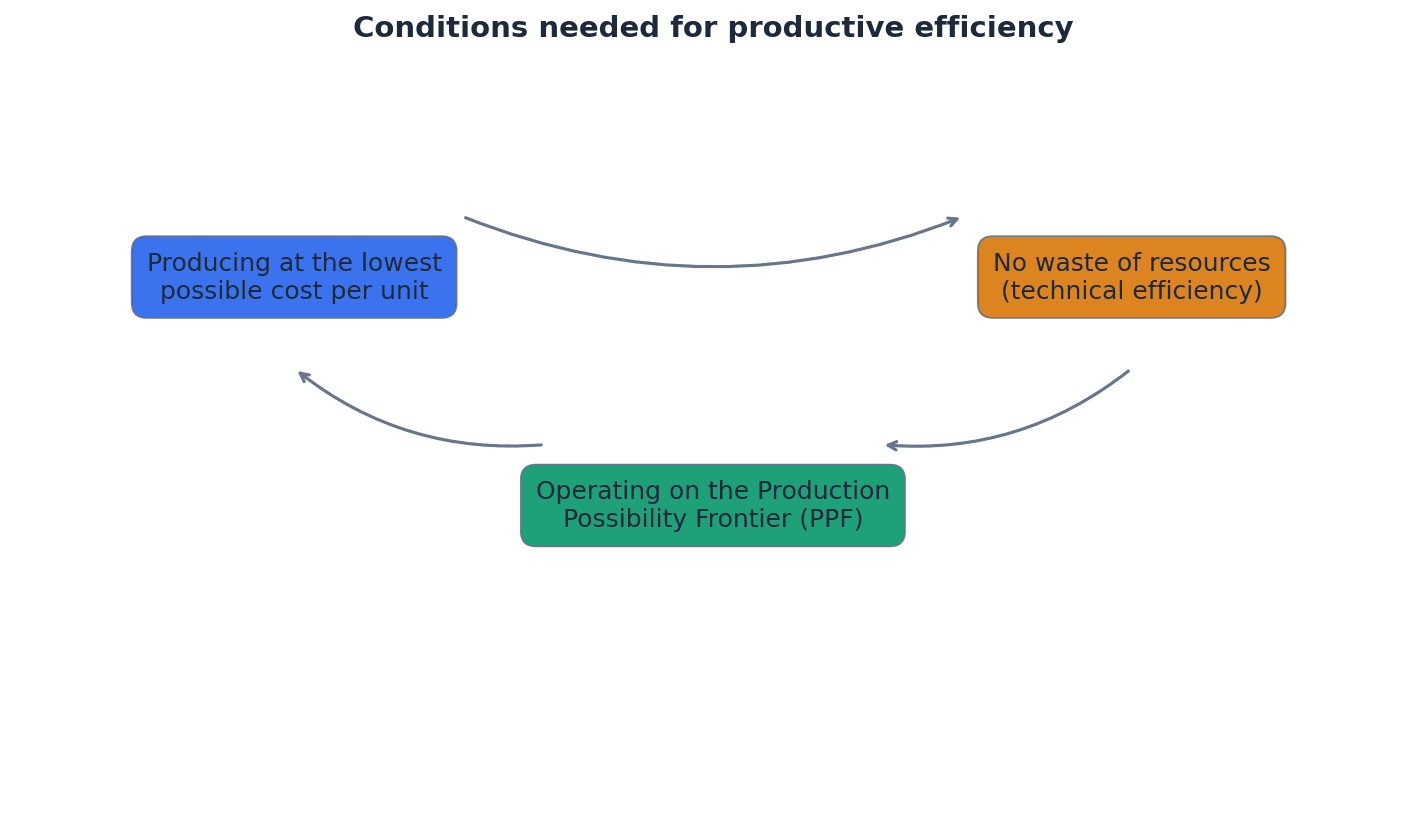
Allocative efficiency — Allocative efficiency occurs when firms produce the combination of goods and services that are most wanted by consumers, giving them maximum satisfaction.
This state is achieved when the price consumers are willing to pay for a good equals its marginal cost of production (P=MC). This ensures that resources are allocated to produce precisely the right amount of each product, reflecting consumer preferences and the true economic cost. Think of a restaurant that perfectly matches its menu to what its customers truly desire, at prices that reflect the cost of making each dish; no food is wasted, and customers are perfectly satisfied.
Students often think allocative efficiency is about producing goods cheaply, but it's about producing the 'right' goods in the 'right' quantities that consumers value most, relative to their cost (P=MC).
For allocative efficiency, always state the condition P=MC and explain why this condition ensures resources are efficiently allocated according to consumer preferences and opportunity cost.
Pareto optimality — Pareto optimality occurs when it is impossible to make someone better off without making someone else worse off.
This represents the best possible situation in the circumstances, with resources allocated in the most efficient way. If an allocation is not Pareto efficient, there is an opportunity for a Pareto improvement, where at least one person can be made better off without harming anyone else. Imagine a group of friends sharing a pizza; if the pizza is divided so that no one can get a bigger slice without someone else getting a smaller slice, that's Pareto optimal.
Students often think Pareto optimality means everyone is equally well off, but it means no one can improve their situation without someone else's situation deteriorating.
When explaining Pareto optimality, use a production possibility curve (PPC) to illustrate: points on the frontier are Pareto optimal, while points inside are Pareto inefficient.
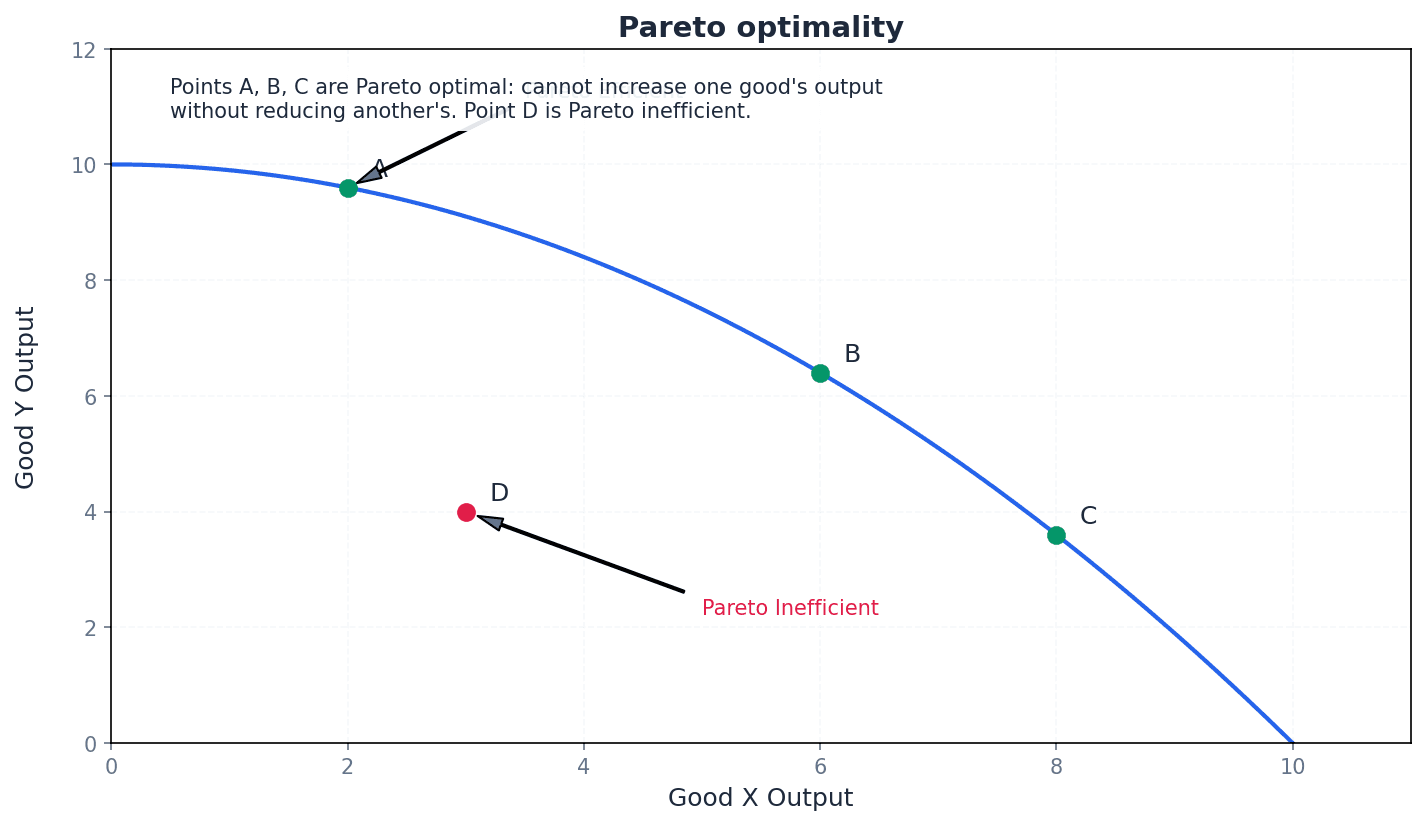
Dynamic efficiency — Dynamic efficiency is a form of productive efficiency that benefits a firm over time, achieved when resources are reallocated to increase output relative to resource increase, meeting changing market needs through new production processes.
This involves investment in research, development, and innovation, often funded by excess profits, to protect market share and improve production methods. It is a long-run concept that leads to a downward shift in the long-run average cost curve, benefiting consumers through new technologies and lower prices. Consider a smartphone company that constantly invests in R&D to develop new, more powerful, and cheaper-to-produce phone models; this continuous improvement makes them dynamically efficient.
Students often confuse dynamic efficiency with static productive efficiency; dynamic efficiency refers to improvements in efficiency over time through innovation and investment.
When discussing dynamic efficiency, emphasise its long-run nature, the role of investment (e.g., R&D), and its impact on the LRAC curve (shifting downwards).
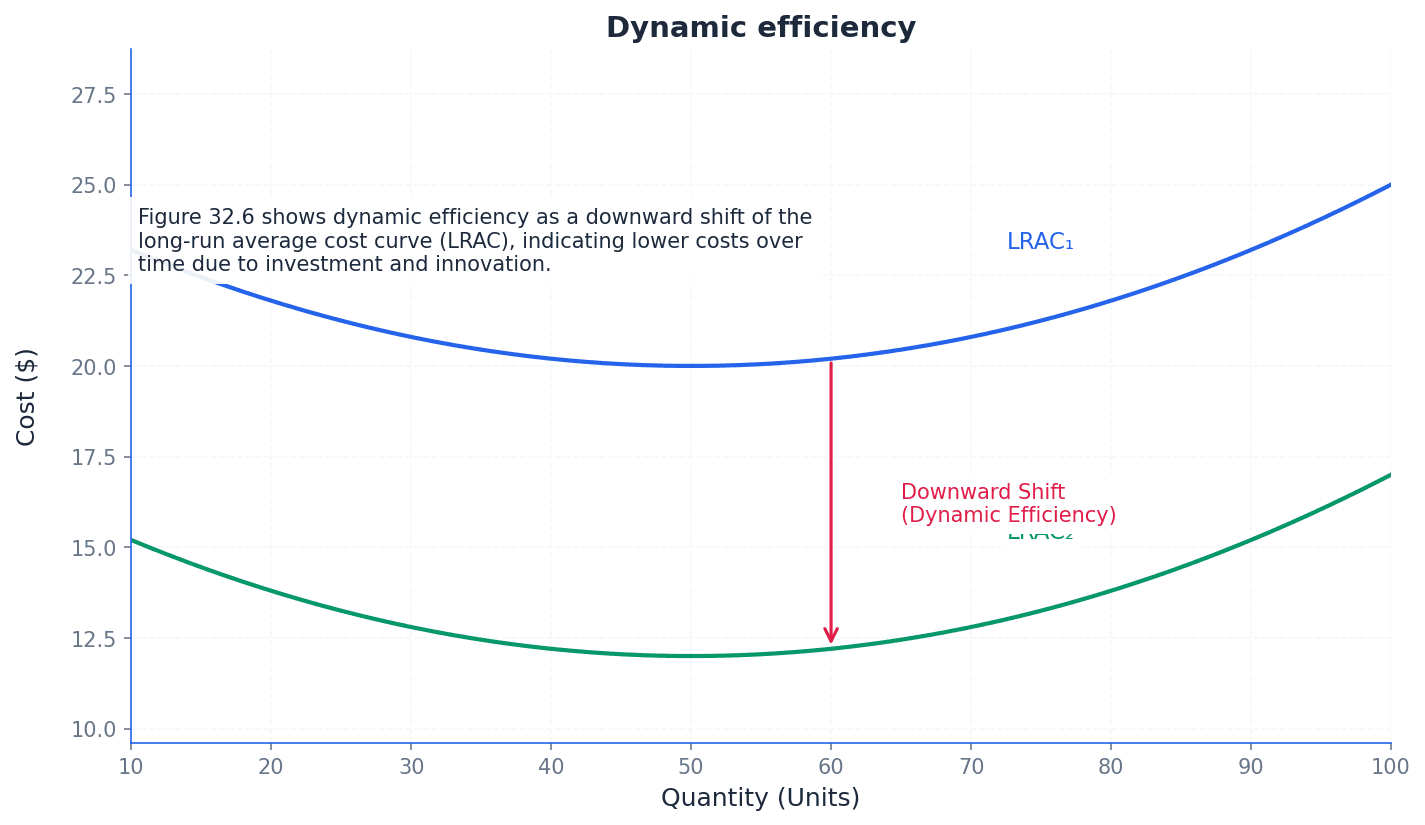
Market failure — Market failure exists whenever a free market, left to its own devices and totally free from any form of government intervention, fails to make the best use of scarce resources.
This occurs when the interaction of supply and demand does not lead to productive and/or allocative efficiency, resulting in an inefficient allocation of resources. Examples include externalities, public goods, information failure, and abuse of monopoly power. Imagine a traffic light system that malfunctions, causing chaos and accidents instead of smooth traffic flow; the market, like the traffic light, fails to coordinate resources efficiently.
Students often think market failure means a market has completely collapsed, but it means the market is not allocating resources efficiently.
When analysing market failure, always link it back to the concept of 'inefficient allocation of resources' and be prepared to explain specific causes like externalities or public goods.
Achieving economic efficiency in resource allocation is a desirable state for an economy. This applies at both the microeconomic level, concerning individual firms and markets, and the macroeconomic level, concerning the overall economy's resource use. Efficiency ensures that resources are utilised in the best possible way to maximise welfare.
Use diagrams: Show productive efficiency at the minimum point of the AC curve. Show allocative efficiency where the Demand/AR curve (P) intersects the MC curve.
Define with precision: In any essay, start by clearly defining the specific type of efficiency you are discussing and state its condition (e.g., P=MC).
Link market failure to inefficiency: When discussing a cause of market failure (e.g., externalities), explicitly explain why it leads to a misallocation of resources and a loss of allocative efficiency.
Evaluate with conflicts: For higher marks, discuss potential conflicts between types of efficiency. For example, a monopoly may lack allocative efficiency (P>MC) but achieve dynamic efficiency through R&D investment.
Use 'Pareto' correctly: Use the term 'Pareto optimality' to describe a perfectly efficient outcome, but remember to state that it makes no judgement about the equity of that outcome.
Advantages & Disadvantages
Productive Efficiency
Allocative Efficiency
Evaluation Starters
Essay Structure Guide
Introduction
Begin by defining the key terms of the question, such as 'efficiency' and 'market failure', and briefly outline the scope of your essay. State your main argument or thesis.
Conclusion
Summarise your main arguments, reiterating the importance of efficiency in resource allocation. Conclude with a final evaluative statement on the challenges and trade-offs involved in achieving and maintaining efficiency in an economy.
This chapter explores how externalities, which are side effects on third parties, lead to market failure by causing a divergence between private and social costs and benefits. It analyses how these divergences result in deadweight welfare losses due to over or under-provision of goods, and also covers asymmetric information and moral hazard as causes of market failure.
Private costs (PC) — Private costs are the costs incurred by firms, individuals or others who actually carry out the particular action, either as producers or consumers.
These are the direct costs borne by the economic agent making the decision. For a producer, this includes production expenses like wages and raw materials; for a consumer, it's the price paid for a good or service. For example, the private cost of driving a car is the fuel you buy and the maintenance you pay for.
Private benefits (PB) — Private benefits are directly received by those who produce or consume the good or service in the action.
These are the direct advantages or utility gained by the economic agent making the decision. For a producer, this is revenue; for a consumer, it's the satisfaction or utility from consuming a good. For instance, the private benefit of eating a meal is the satisfaction of hunger and enjoyment of the food.
Externality — An externality is the effect, negative or positive, on a so-called third party who has had no involvement in the action that has caused the externality.
Externalities arise when economic decisions by producers or consumers affect third parties not directly involved in the transaction. These side effects can be either beneficial or detrimental, leading to a divergence between private and social costs or benefits and thus market failure. Imagine your neighbour decides to host a loud party every weekend. The noise is an externality; it's a negative effect on you (a third party) from their decision to party, even though you're not involved in their party planning or attendance.
Students often confuse the action causing an externality with the externality itself; the externality is the *effect* on a third party, not the action that caused it.
External costs (EC) — External costs are a consequence of externalities that arise from a particular action and are not paid for by those responsible for the action, instead falling on third parties.
These are the uncompensated costs imposed on third parties due to the production or consumption activities of others. They represent a negative spillover effect, leading to social costs being higher than private costs. For example, the external cost of a factory polluting a river is the cost to local residents who can no longer fish or swim, or the cost to the public health system for treating pollution-related illnesses.
External benefits (EB) — External benefits are a consequence of externalities that arise from a particular action and whose advantages do not accrue to those responsible for the action, instead falling on third parties.
These are the uncompensated benefits received by third parties due to the production or consumption activities of others. They represent a positive spillover effect, leading to social benefits being higher than private benefits. For instance, the external benefit of someone getting vaccinated is that others in the community are less likely to catch the disease from them, even if they weren't vaccinated themselves.
Social costs (SC) — Social costs are the total costs incurred or accruing to society as a result of a particular action.
Social costs encompass both the private costs borne by the decision-maker and any external costs imposed on third parties. They represent the true cost to society of an economic activity. The social cost of driving a car includes your fuel costs (private cost) plus the cost of air pollution and road congestion imposed on others (external costs).
Social costs
Used to calculate the total cost to society of an action, including both private and external costs.
Social benefits (SB) — Social benefits are the total benefits incurred or accruing to society as a result of a particular action.
Social benefits encompass both the private benefits received by the decision-maker and any external benefits enjoyed by third parties. They represent the true benefit to society of an economic activity. The social benefit of getting an education includes your increased earning potential (private benefit) plus the benefits to society of a more skilled workforce and informed citizenry (external benefits).
Social benefits
Used to calculate the total benefit to society of an action, including both private and external benefits.
Students often think private costs/benefits are the same as social costs/benefits, forgetting to account for external costs/benefits. Remember that social costs/benefits are the sum of private and external costs/benefits.
Negative externality — A negative externality occurs where the side effects have a negative or damaging impact on third parties involving unexpected costs to them.
These externalities impose uncompensated costs on individuals or groups not directly involved in the production or consumption of a good or service. They lead to social costs exceeding private costs, resulting in overproduction or overconsumption from society's perspective. A factory polluting a river is a negative externality; the factory benefits from cheaper waste disposal, but local fishermen (third parties) incur costs from reduced fish stocks.
When analysing negative externalities, clearly distinguish between the private costs borne by the decision-maker and the external costs borne by third parties.
Positive externality — A positive externality is where the side effects provide unexpected benefits to the third parties.
These externalities generate uncompensated benefits for individuals or groups not directly involved in the production or consumption. They lead to social benefits exceeding private benefits, resulting in underproduction or underconsumption from society's perspective. If your neighbour plants a beautiful garden, you (a third party) benefit from the pleasant view and improved air quality without paying for it; this is a positive externality.
When evaluating positive externalities, explain how the external benefits lead to a divergence between private and social benefits, justifying government intervention to increase provision.
Externalities cause market failure because the free market equilibrium, where Marginal Private Cost (MPC) equals Marginal Private Benefit (MPB), does not reflect the true social costs or benefits. This divergence means that resources are misallocated from society's perspective, leading to either overproduction or underproduction of goods and services.
Marginal private costs (MPC) — Marginal private costs are the costs incurred by the firm for producing one additional unit of a good or service.
This is essentially the firm's supply curve, representing the additional cost to the producer for each extra unit. In the absence of externalities, MPC equals Marginal Social Cost. For a baker, the MPC of baking one more loaf of bread is the cost of the extra flour, yeast, and energy used.
Marginal external costs (MEC) — Marginal external costs are the additional costs imposed on third parties by the production or consumption of one more unit of a good or service.
These costs are not borne by the producer or consumer but by society. They represent the vertical distance between the Marginal Private Cost (MPC) and Marginal Social Cost (MSC) curves in production externalities, or between Marginal Private Benefit (MPB) and Marginal Social Benefit (MSB) in consumption externalities. The MEC of a factory producing one more unit of a product might be the additional cost of treating one more person for respiratory illness due to increased air pollution.
Marginal social costs (MSC) — Marginal social costs are the total costs to society of producing one additional unit of a good or service.
MSC includes both the marginal private cost and any marginal external cost. When MSC is greater than MPC, it indicates a negative production externality, leading to overproduction from society's perspective. The MSC of producing one more car includes the cost to the car manufacturer (MPC) plus the cost of the extra pollution emitted to the environment (MEC).
When drawing diagrams for negative production externalities, ensure the MSC curve is above the MPC curve, with the vertical distance representing the marginal external cost.
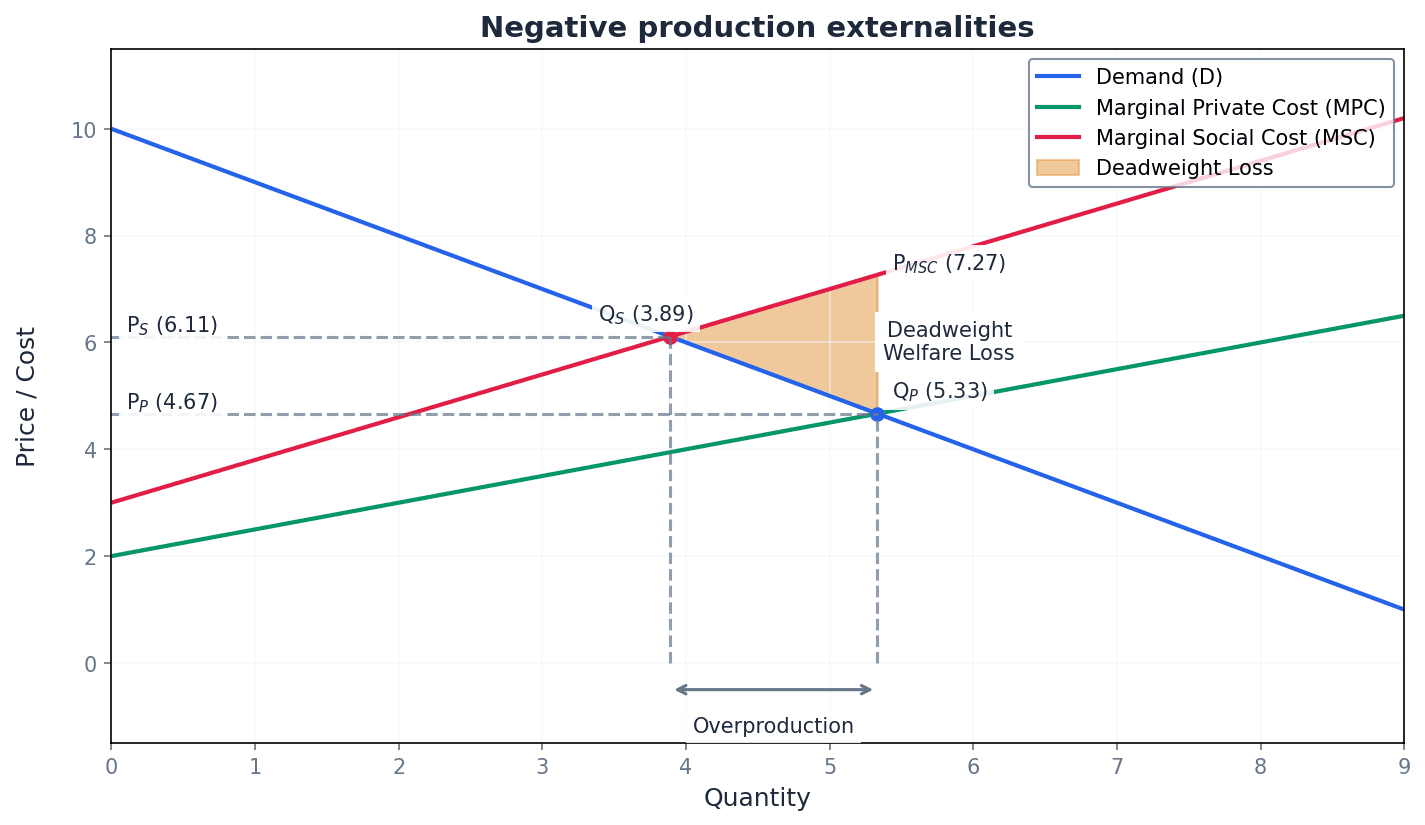
Marginal private benefit (MPB) — Marginal private benefit is the additional benefit received by the consumer from consuming one more unit of a good or service.
This is typically represented by the demand curve, reflecting the utility or satisfaction an individual gains from an extra unit. In the absence of externalities, MPB equals Marginal Social Benefit. The MPB of eating one more slice of pizza is the additional satisfaction you get from that slice.
Marginal external benefit (MEB) — Marginal external benefit is the additional benefit received by third parties from the production or consumption of one more unit of a good or service.
These benefits are not captured by the producer or consumer but accrue to society. They represent the vertical distance between the Marginal Private Benefit (MPB) and Marginal Social Benefit (MSB) curves in consumption externalities, or between Marginal Private Cost (MPC) and Marginal Social Cost (MSC) in production externalities. The MEB of one more person getting educated might be the additional benefit to society from a more informed voter or a more productive worker.
Marginal social benefit (MSB) — Marginal social benefit is the total benefit to society from consuming one additional unit of a good or service.
MSB includes both the marginal private benefit and any marginal external benefit. When MSB is greater than MPB, it indicates a positive consumption externality, leading to underconsumption from society's perspective. The MSB of one more person getting vaccinated includes the benefit to that individual (MPB) plus the benefit to the community from reduced disease transmission (MEB).
When drawing diagrams for positive consumption externalities, ensure the MSB curve is above the MPB curve, with the vertical distance representing the marginal external benefit.
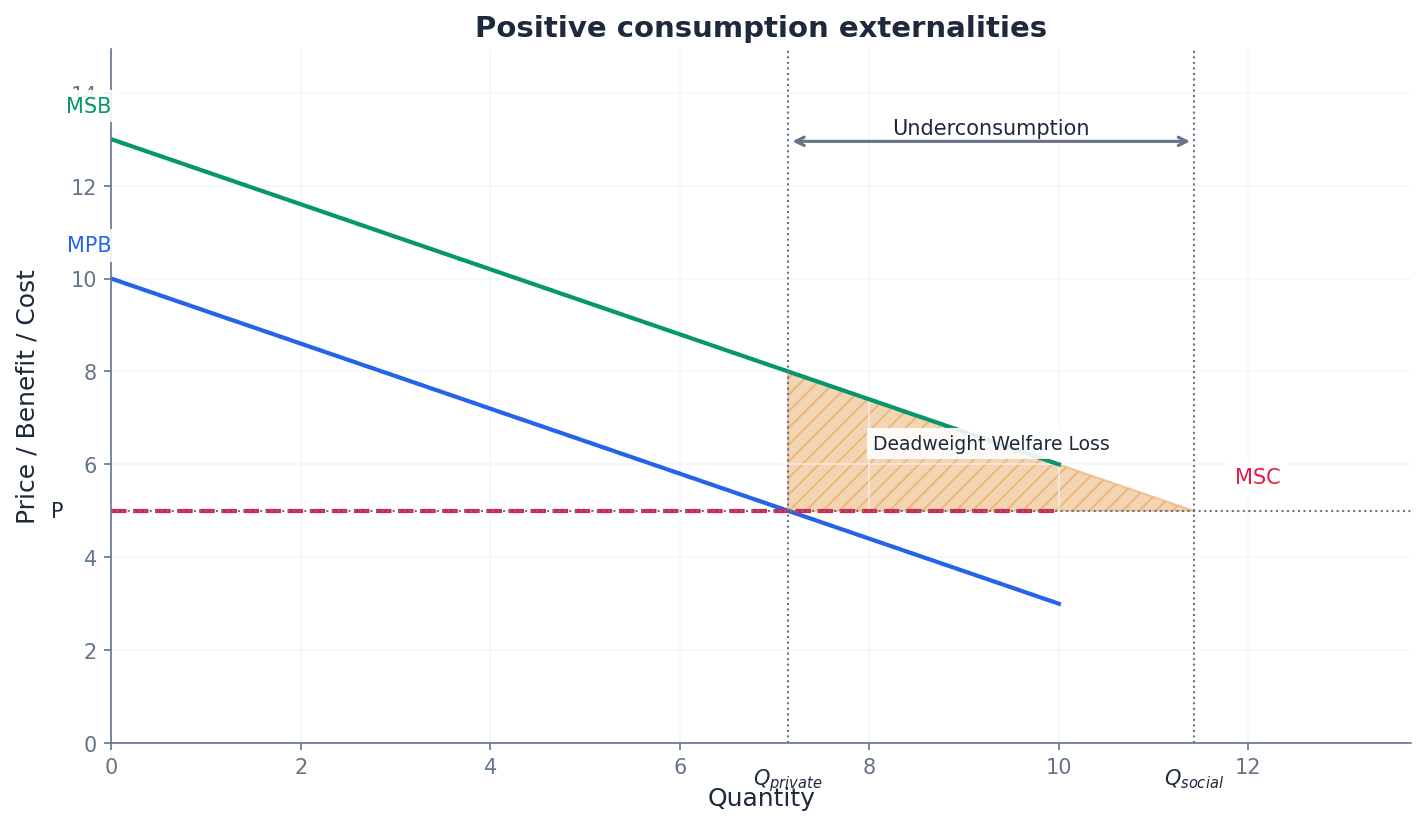
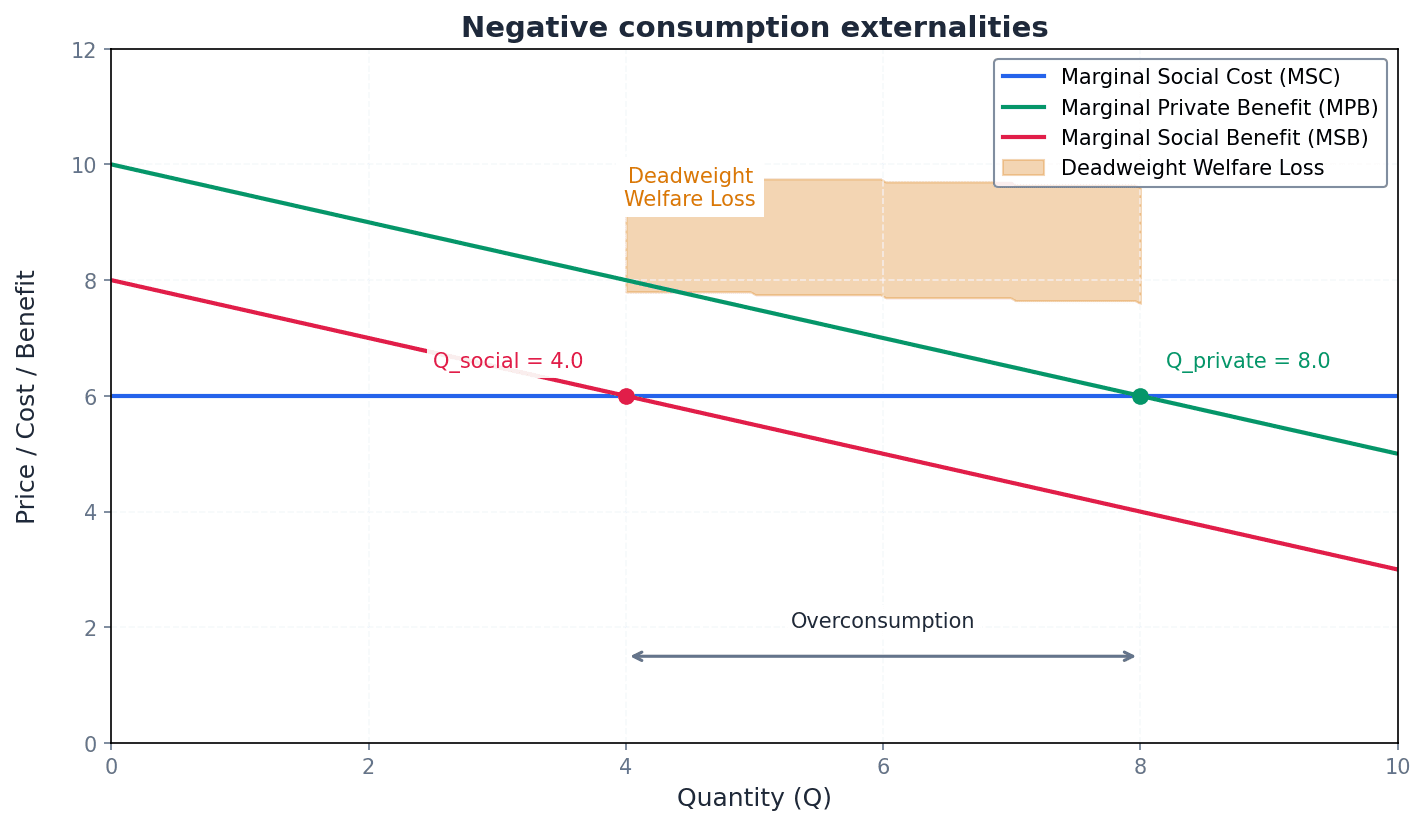
Students often struggle to distinguish between production and consumption externalities. Remember that production externalities affect cost curves (MPC/MSC), while consumption externalities affect benefit curves (MPB/MSB).
deadweight welfare loss — Deadweight welfare loss is the loss of economic efficiency that can occur when the free market equilibrium for a good or service is not achieved or is not socially optimal.
This loss represents the reduction in total surplus (consumer and producer surplus) that results from underproduction or overproduction relative to the socially efficient level. It is typically shown as a triangular area on a supply and demand diagram. Imagine a cake that could feed 10 people perfectly, but due to a miscalculation, only enough is baked for 8, or enough for 12 but 2 slices go to waste. The 'missing' or 'wasted' slices represent the deadweight welfare loss.
When asked to analyse deadweight welfare loss, clearly identify the area on the diagram (e.g., triangle xyz) and explain whether it results from overproduction or underproduction relative to the social optimum.
Students often forget to include the deadweight welfare loss area in diagrams illustrating externalities. This loss represents uncaptured potential welfare for society as a whole.
Beyond externalities, market failure can also arise from asymmetric information, where one party in a transaction possesses more or better information than the other. This imbalance can lead to suboptimal decisions or even the collapse of markets for certain goods, as the party with less information cannot make fully informed choices.
Asymmetric information — Asymmetric information occurs when one party in the market, usually the seller, has some information that the other party, usually the buyer, does not have.
This imbalance of information can lead to market failure because the party with less information may make suboptimal decisions, or the market for certain goods may collapse due to adverse selection. When buying a used car, the seller knows its true condition (e.g., if it's a 'lemon'), but the buyer doesn't, leading to asymmetric information.
When explaining asymmetric information, provide clear examples where one party (buyer or seller) has superior knowledge, and discuss the consequences like adverse selection.
Adverse selection — Adverse selection is an outcome of hidden characteristics, where only one party knows more about a situation than the other party, leading to undesirable market outcomes.
This occurs before a transaction takes place, where one party has private information about a characteristic that is relevant to the transaction. For example, in insurance, unhealthy people are more likely to buy insurance, leading to higher costs for insurers. If only people with high risk of flooding buy flood insurance, the insurance company faces adverse selection because it attracts a disproportionately risky pool of customers.
Moral hazard — Moral hazard refers to situations involving hidden actions, where one party takes actions that the other party cannot observe but which affect both of them.
This occurs after a transaction, where one party changes their behaviour because they are protected from the full consequences of their actions. For example, an insured person might take more risks knowing their losses are covered. If you have comprehensive car insurance, you might drive less carefully (a hidden action) because the cost of an accident is largely covered, which is moral hazard.
Students often confuse adverse selection (hidden characteristics before a transaction) with moral hazard (hidden actions after a transaction). Remember, adverse selection relates to hidden *characteristics* before a transaction, while moral hazard relates to hidden *actions* after a transaction.
Cost-benefit analysis (CBA) is a crucial tool, especially for public sector projects, to evaluate decisions by considering all social costs and benefits. It takes a long and wide view, going beyond mere financial appraisal to include non-market values, often by assigning 'shadow prices' to quantify them. This comprehensive approach helps determine if the overall benefits to society outweigh the costs of a project.
cost–benefit analysis — Cost–benefit analysis is a useful technique to aid decision-making by analysing the various costs and benefits that are involved, particularly where a financial appraisal alone may not be entirely appropriate.
CBA takes a long and wide view, including all social costs and social benefits, not just private ones, and often assigns shadow prices to non-market costs and benefits. It is widely used in the public sector for major investment projects to determine if the overall benefits to society outweigh the costs. Deciding whether to build a new public park involves a CBA: you'd weigh the construction costs and maintenance (costs) against the benefits of recreation, improved air quality, and increased property values for nearby residents (benefits).
Students often think cost-benefit analysis is only about financial costs and benefits, but actually it explicitly includes non-monetary external costs and benefits, often requiring 'shadow pricing'.
When evaluating CBA, remember to discuss its stages, the challenges of quantifying non-market values, and its role in allocating scarce resources for public goods.
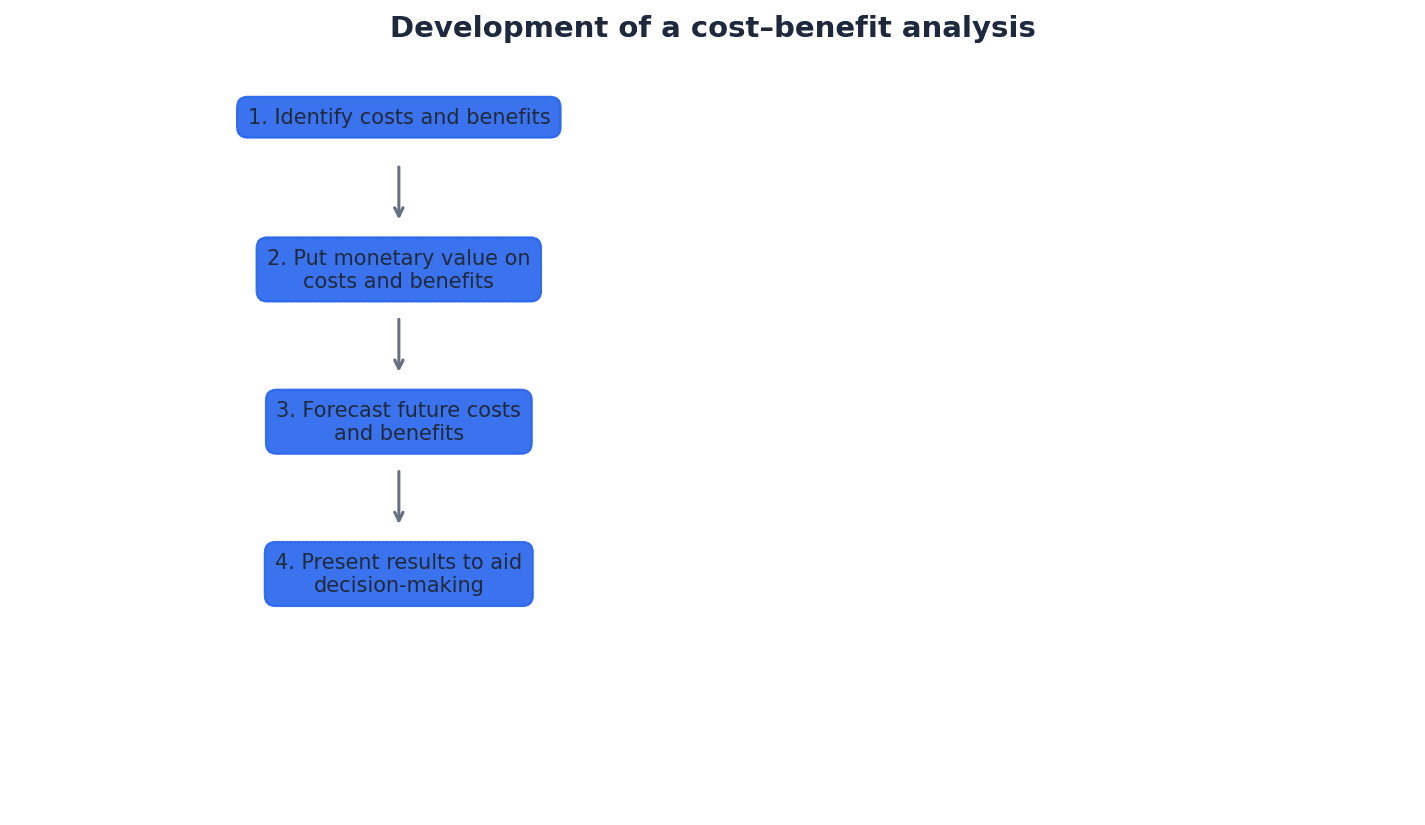
Always draw a fully labelled diagram for externality questions. Label axes (Price/Cost/Benefit, Quantity), curves (MPC, MSC, MPB, MSB), equilibrium points (private vs. social), and the deadweight welfare loss area.
Start your answers by defining key terms precisely. For example, 'A negative externality is a harmful spillover effect on a third party...'
Use a clear, specific example for each type of externality. E.g., 'Air pollution from a factory is a negative production externality,' or 'Vaccinations provide a positive consumption externality.'
Advantages & Disadvantages
Government intervention to correct negative externalities (e.g., taxes)
Government intervention to correct positive externalities (e.g., subsidies)
Evaluation Starters
Essay Structure Guide
Introduction
Begin by defining market failure and externalities (both positive and negative), clearly stating that externalities cause a divergence between private and social costs/benefits. Briefly outline the essay's scope, mentioning how externalities lead to deadweight welfare losses and how tools like CBA are used.
Conclusion
Summarise how externalities lead to market failure and welfare losses. Reiterate the importance of understanding social costs and benefits for efficient resource allocation. Conclude with a balanced perspective on the role of government intervention and analytical tools like CBA in addressing these market failures, acknowledging their complexities and limitations.
This chapter explores how firms manage production and costs in the short and long run, introducing concepts like diminishing returns and economies of scale. It also defines various types of revenue and profit, crucial for understanding firm behaviour and market dynamics.
production function — The production function is a graph showing the relationship between the quantity of factor inputs (labour/workers) and the total product or output of clothing.
It illustrates how output changes as variable inputs are added to fixed inputs in the short run. This concept is fundamental to understanding productivity and the law of diminishing returns. For example, a baker with a fixed oven (capital) uses the production function to show how many loaves of bread they can bake as they add more bakers (labour) to operate that single oven.
marginal product — Marginal product is the increase in total product that occurs from an additional unit of input (labour, in this case).
It measures the extra output gained by employing one more unit of a variable factor, holding other factors constant. This concept is crucial for understanding the law of diminishing returns and a firm's short-run decision-making. For instance, if a team of workers picks apples, the marginal product of the fifth worker is the extra number of apples picked when that fifth worker joins the team, compared to what four workers picked.
average product — Average product is calculated by dividing the total product by the number of workers employed.
It is a measure of labour productivity, indicating how much output is produced by each worker on average. Firms use this to assess the overall efficiency of their workforce. For example, if a factory produces 100 cars with 10 workers, the average product is 10 cars per worker.
Learners often confuse product (output) and productivity (output per worker). Remember, product is about total output, while productivity is about output per worker.
law of diminishing returns — The law of diminishing returns states that as the number of workers increases, the marginal product declines.
This short-run concept occurs when successive units of a variable input are added to a fixed input, eventually leading to a decrease in the marginal output of the variable input. It explains the U-shape of short-run cost curves. Imagine adding more and more fertiliser to a potted plant; initially, the plant grows faster, but eventually, adding more fertiliser might not help much, or could even harm the plant, showing diminishing returns.
When explaining the law of diminishing returns, explicitly state that it is a short-run concept and involves adding a variable factor to at least one fixed factor.
Fixed costs (FC) — Fixed costs (FC) are the costs that are independent of output.
These costs do not change with the level of production in the short run, such as rent or insurance. They must be paid even if output is zero, and their total remains constant. The rent for a factory building is a fixed cost; whether the factory produces 100 units or 1000 units, the rent payment remains the same.
Variable costs (VC) — Variable costs (VC) include all the costs that are directly related to the level of output, the usual ones being labour and raw material or component costs.
These costs fluctuate with the volume of production; they are zero if no output is produced and increase as output increases. They are incurred directly in the production process. The cost of raw materials to make a product is a variable cost; if you make more products, you use more raw materials, and the cost increases.
total cost (TC) — Total cost (TC) is the sum of total fixed cost (TFC) and total variable cost (TVC).
It represents the overall cost of producing a given level of output. Understanding total cost is essential for firms to determine profitability and make production decisions. If your fixed costs for a lemonade stand are the cost of the stand itself, and your variable costs are the lemons and sugar, your total cost is the sum of these for all the lemonade you make.
Total cost
Used to calculate the overall cost of production in the short run.
average fixed cost (AFC) — Average fixed cost (AFC) is calculated by dividing total fixed cost by output.
AFC continuously falls as output increases because the total fixed cost is spread over a larger number of units. This contributes to the initial downward slope of the average total cost curve. If your factory rent is 10 per unit. If you produce 1000 units, your AFC drops to $1 per unit.
Average fixed cost
Used to calculate the fixed cost per unit of output.
average variable cost (AVC) — Average variable cost (AVC) is calculated by dividing total variable cost by output.
AVC typically falls initially due to increasing returns, then rises due to the law of diminishing returns. It represents the variable cost incurred per unit of output. If the total cost of ingredients for 10 pizzas is 5 per pizza.
Average variable cost
Used to calculate the variable cost per unit of output.
average total cost (ATC) — Average total cost (ATC) is calculated by dividing total cost by output.
Also known as unit cost, ATC shows the cost per unit of output. Its U-shape in the short run is due to the interaction of falling AFC and rising AVC. If the total cost to produce 100 toys is 5 per toy.
Average total cost
Used to calculate the total cost per unit of output.
Marginal cost (MC) — Marginal cost (MC) is the addition to the total cost when making one extra unit of output.
It is the change in total cost divided by the change in output. MC is crucial for firms' short-run output decisions, as they will only increase output if expected revenue outweighs this extra cost. If producing 10 shirts costs 108, the marginal cost of the 11th shirt is $8.
Marginal cost
Used to calculate the additional cost of producing one more unit of output.
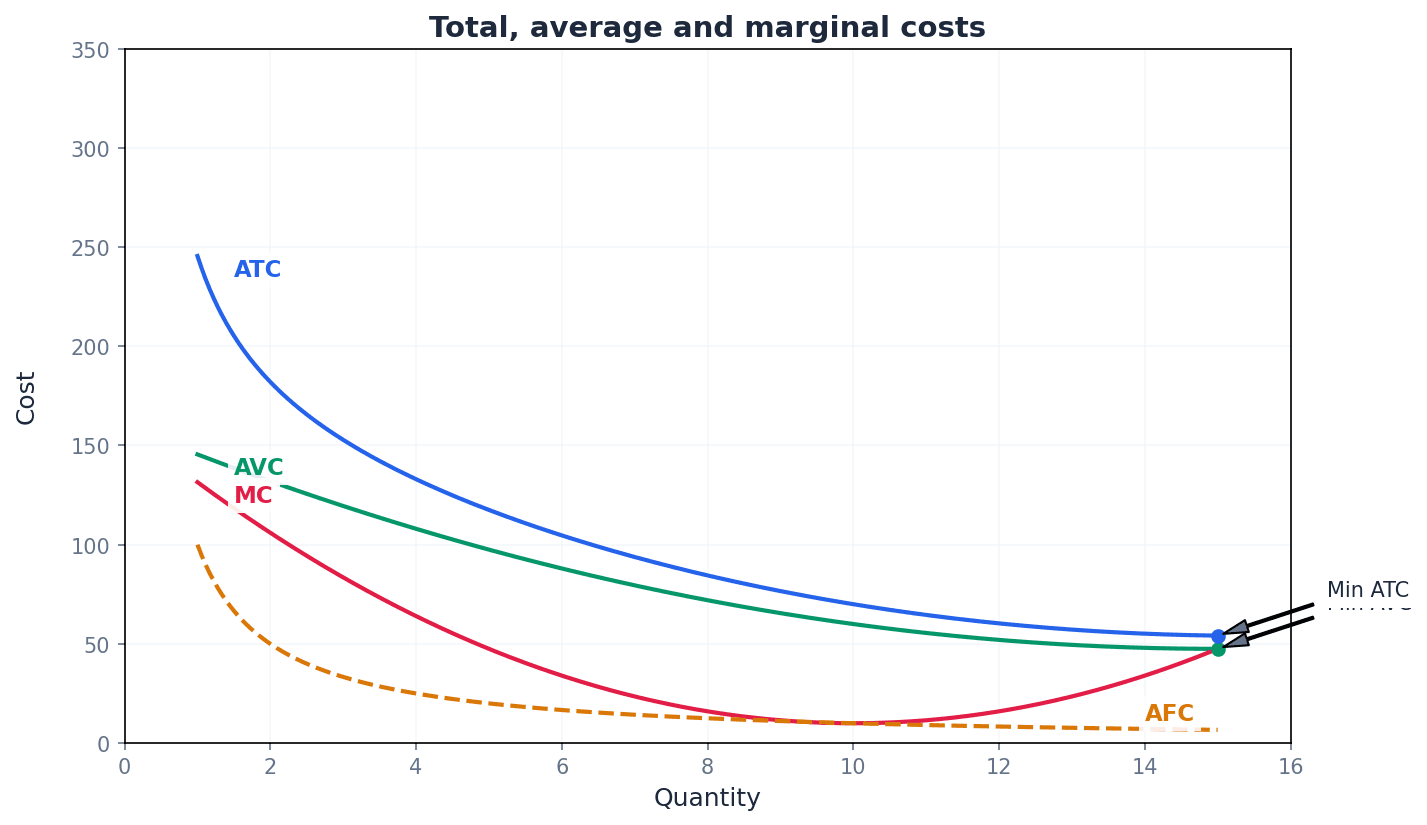
When drawing ATC, ensure it is U-shaped and that the marginal cost curve intersects it at its lowest point.
optimum output — Optimum output is where the firm is productively efficient in the short run, meaning the average total or unit cost is lowest.
This is the level of output where the firm achieves the lowest possible cost per unit in the short run. It occurs at the minimum point of the average total cost curve, where MC = ATC. For a bakery, the optimum output is the number of loaves of bread they can bake where the cost per loaf is the absolute lowest, given their current oven and staff.
In the short run, at least one factor of production is fixed, while others are variable. The production function illustrates how output changes as variable inputs are added to fixed inputs. This leads to the law of diminishing returns, where marginal product eventually declines. Consequently, short-run cost curves like Average Variable Cost (AVC) and Average Total Cost (ATC) are typically U-shaped, reflecting initial efficiencies followed by rising costs due to diminishing returns.
isoquant — An isoquant is a curve that joins points that give a particular level of output.
Isoquants illustrate different combinations of labour and capital that can produce the same quantity of output. They are used in long-run production analysis to show the physical relationship between inputs and output, distinct from cost considerations. Imagine you're baking a cake. An isoquant would show all the different combinations of flour and sugar that would still result in one perfectly sized cake, even if the taste varies slightly.
Students often think isoquants are cost curves, but actually they represent output from a physical standpoint, not a cost standpoint.
isocosts — Isocosts are lines of constant relative costs for the factors of production.
They represent all combinations of two inputs (e.g., labour and capital) that a firm can purchase for a given total cost. Firms combine isocosts with isoquants to find the least-cost production method. If you have a fixed budget for buying ingredients, an isocost line would show all the different combinations of flour and sugar you could buy with that exact amount of money.
expansion path — The expansion path or long-run production function of the firm can be shown by joining together all of the various tangential points between isoquants and isocosts.
It illustrates the least-cost combination of inputs for every possible level of output in the long run. This path is crucial for long-term planning as it shows how a firm should adjust its factor mix as it expands. Imagine a path on a map that shows the most efficient route to reach different destinations (output levels) while spending the least amount of fuel (cost).
Optimal factor combination (equi-marginal principle)
Used by firms in the long run to find the most efficient combination of factors of production.
In the long run, all factors of production are variable, meaning a firm can adjust its scale of operation. The long-run production function considers how output changes when all inputs are varied. This leads to the concept of returns to scale, which describes whether output increases proportionally more than, less than, or equal to the increase in inputs.
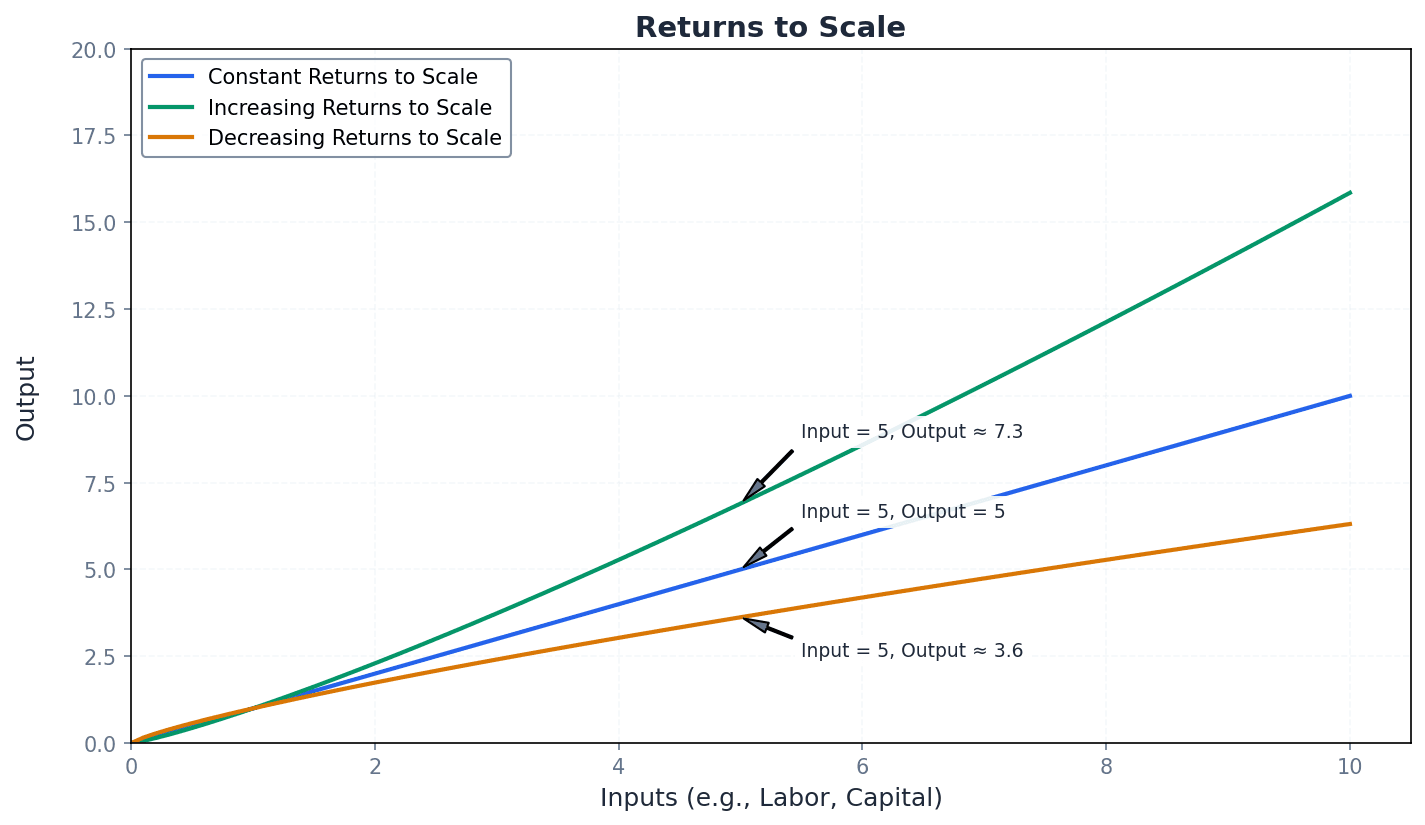
long-run average cost (LRAC) — The long-run average cost (LRAC) curve shows the least cost combination of producing any given quantity of output.
It is a flatter U-shaped curve that envelops a series of short-run average cost curves, representing the lowest possible average cost for each output level when all factors of production are variable. Think of the LRAC as the 'best possible' average cost curve you could achieve if you could choose the perfect factory size (SRAC) for every level of output.
short-run average cost curve (SRAC) — The short-run average cost curve (SRAC) shows the average cost of production for a given plant size, where at least one factor of production is fixed.
Each SRAC curve represents the average costs for a specific scale of operation in the short run. The LRAC curve is derived from a series of these SRAC curves. If you have a small coffee shop, your SRAC curve shows your average costs for different numbers of coffees made with that specific shop size. If you build a bigger shop, you'd have a new SRAC curve.
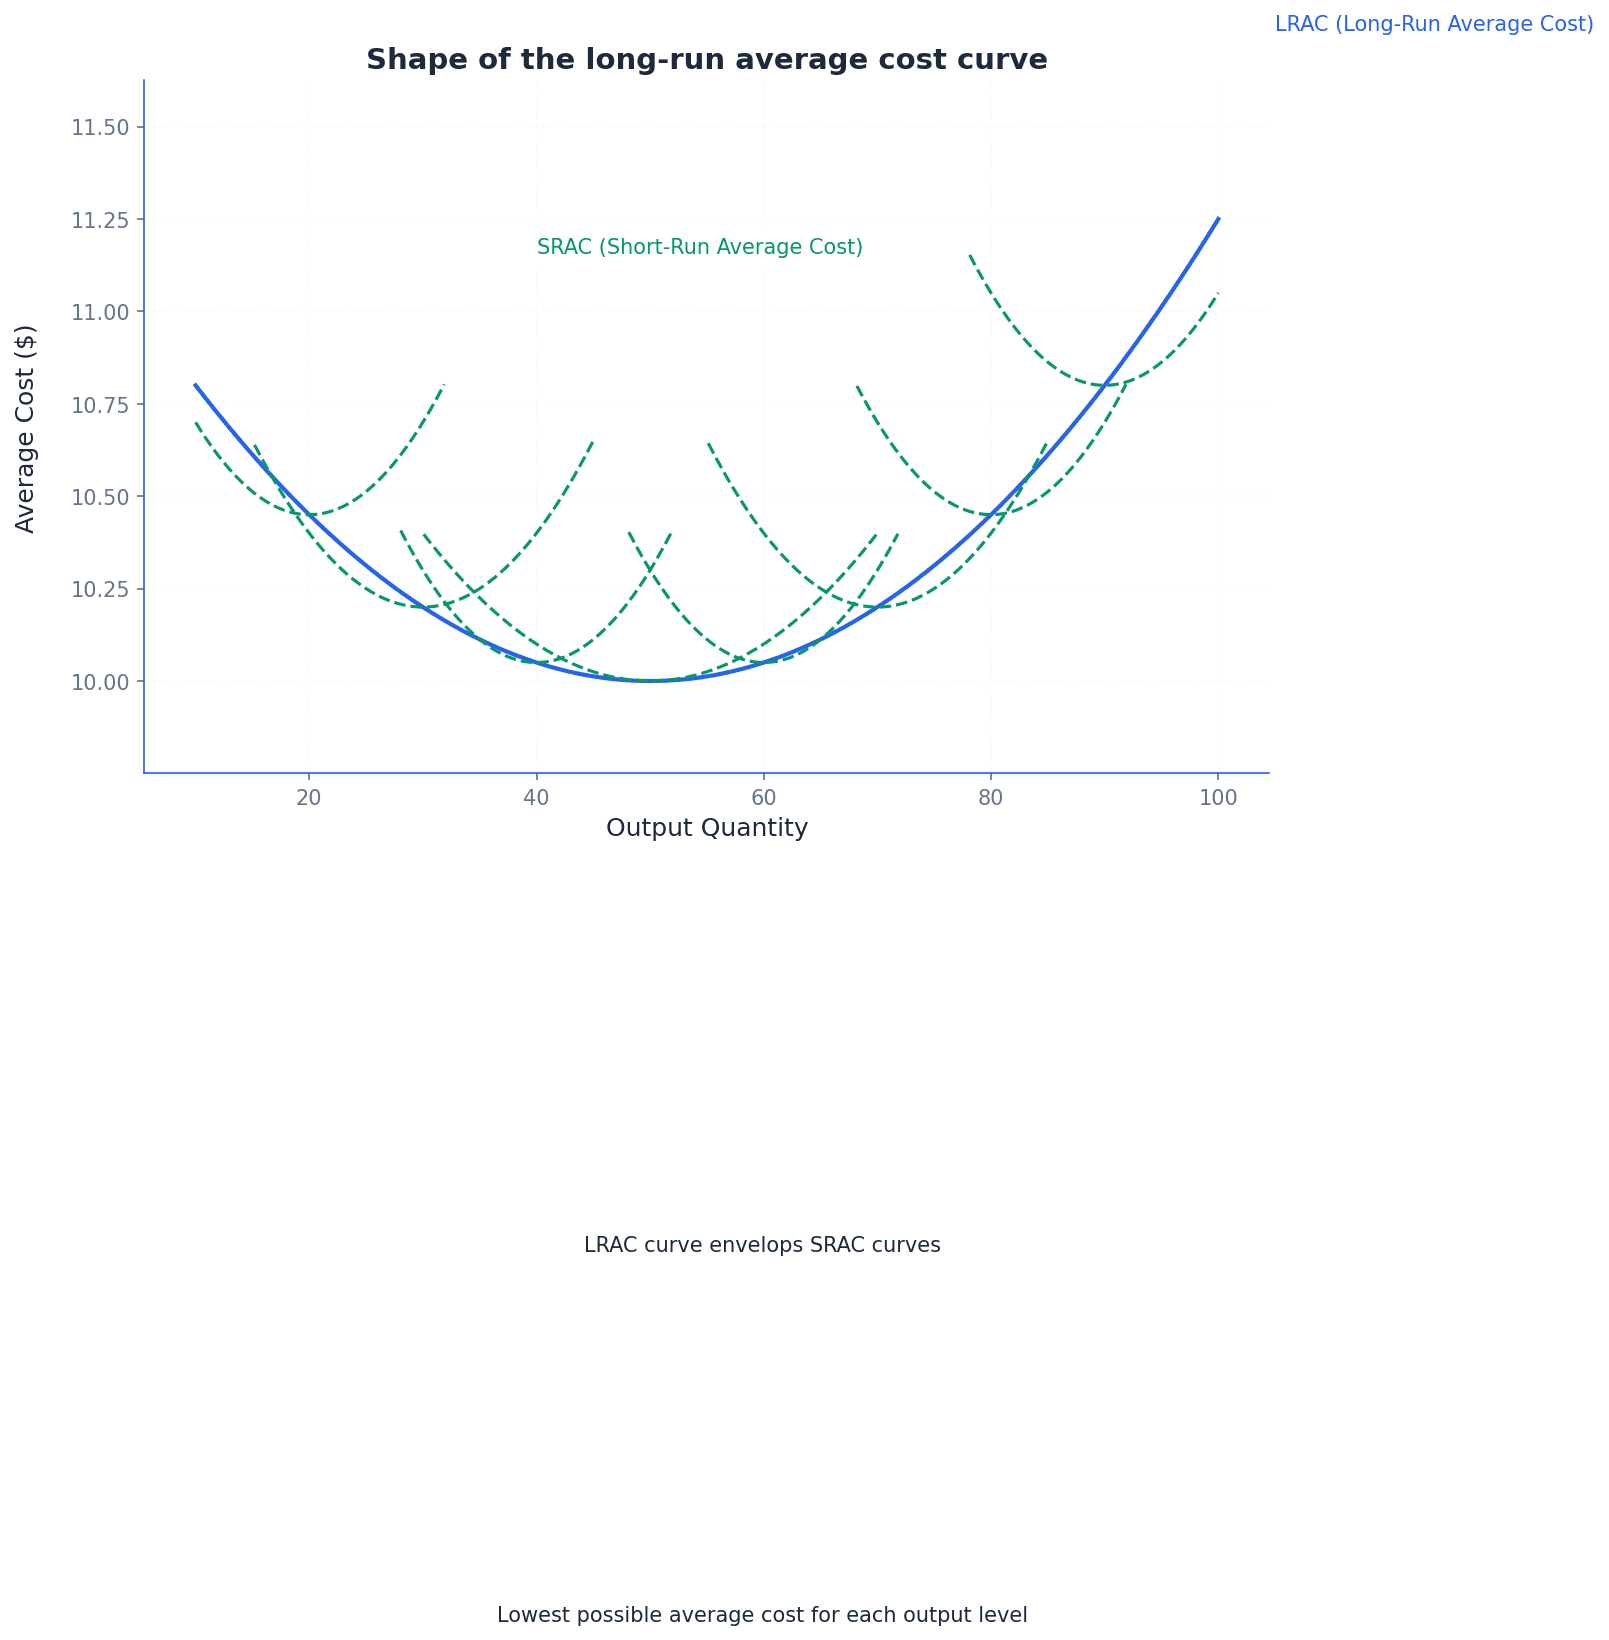
minimum efficient scale — The minimum efficient scale is the lowest level of output where average costs are minimised.
At this point, a firm has maximised its efficiency in both the short and long run. Industries with a low minimum efficient scale tend to have many firms, while those with a high scale have fewer, larger firms. For a car manufacturer, the minimum efficient scale is the production volume where they achieve the lowest possible cost per car, fully utilising all economies of scale.
economies of scale — A firm experiences economies of scale if costs per unit of output fall as the scale of production increases.
These occur when a firm's output rises proportionally faster than its inputs, leading to decreasing long-run average costs. They provide a competitive advantage and can be internal or external. Buying ingredients in bulk for a restaurant is an economy of scale; the more you buy, the cheaper the price per unit, reducing your average cost per meal.
Internal economies of scale — Internal economies of scale are the benefits gained by a firm as a result of its own decision to produce on a larger scale.
These advantages arise from within the firm itself as it grows, such as technical efficiencies from specialised machinery, bulk purchasing discounts, or specialised management. They lead to a downward-sloping LRAC. A large supermarket chain can buy huge quantities of milk directly from a dairy at a much lower price per litre than a small corner shop, which is an internal purchasing economy of scale.
External economies of scale — External economies of scale are particular benefits received by all the firms in an industry as a direct consequence of the growth of that industry.
These benefits arise from the overall expansion of the industry, not just a single firm's growth. Examples include a skilled labour pool, improved infrastructure, or specialist suppliers emerging in a concentrated area. If many tech companies set up in one city, a pool of skilled IT workers becomes available, and specialist repair shops for tech equipment emerge, benefiting all tech firms in that city.
diseconomies of scale — Diseconomies of scale occur when a firm’s costs per unit of output increase as the scale of output continues to increase beyond a certain size.
This situation is represented by the upward-sloping section of the LRAC curve. They typically arise from problems of management coordination, communication, and worker morale in very large, complex organisations. Imagine a very large school with thousands of students; it might become harder to manage, communicate effectively, and maintain individual student attention, leading to higher 'cost' per student in terms of quality or resources.
External diseconomies — External diseconomies are disadvantages that may be seen in the form of traffic congestion, land shortages, and shortages of skilled labour due to the excessive concentration of economic activities in a narrow geographical location.
These are disadvantages that affect all firms in an industry due to the overall growth and concentration of that industry in a specific area. They lead to an upward shift in the LRAC for all firms. If too many factories are built in one industrial zone, traffic jams might increase delivery times and costs for all factories, and land prices might skyrocket, affecting everyone.
Students often confuse diminishing returns (short-run, one variable factor) with diseconomies of scale (long-run, all factors variable). Remember, diminishing returns apply in the short run, while economies and diseconomies of scale are long-run concepts.
When asked to explain economies of scale, specify that they are a long-run concept and provide examples of different types (technical, purchasing, managerial, etc.).
Total revenue (TR) — Total revenue (TR) represents the sales of a firm and is obtained by multiplying the price of a good (P) by the number of units sold (Q).
It is the total income a firm receives from selling its goods and services over a period. Understanding TR is fundamental to calculating profit and making pricing decisions. If a baker sells 50 loaves of bread at 150.
Total revenue
Used to calculate the total income from sales.
Average revenue (AR) — Average revenue (AR) is the revenue per unit of output sold.
It is calculated by dividing total revenue by the quantity sold. For a firm, its demand curve is its average revenue curve, showing the price per unit at different quantities. If a company earns 10 per item.
Average revenue
Used to calculate the revenue per unit of output sold.
Marginal revenue (MR) — Marginal revenue (MR) is the additional revenue arising from the sale of an additional unit of output.
It is the change in total revenue divided by the change in output. Firms use MR to decide whether to produce an extra unit, comparing it to marginal cost. If selling 10 books brings in 108, the marginal revenue of the 11th book is $8.
Marginal revenue
Used to calculate the additional revenue from selling an additional unit of output.
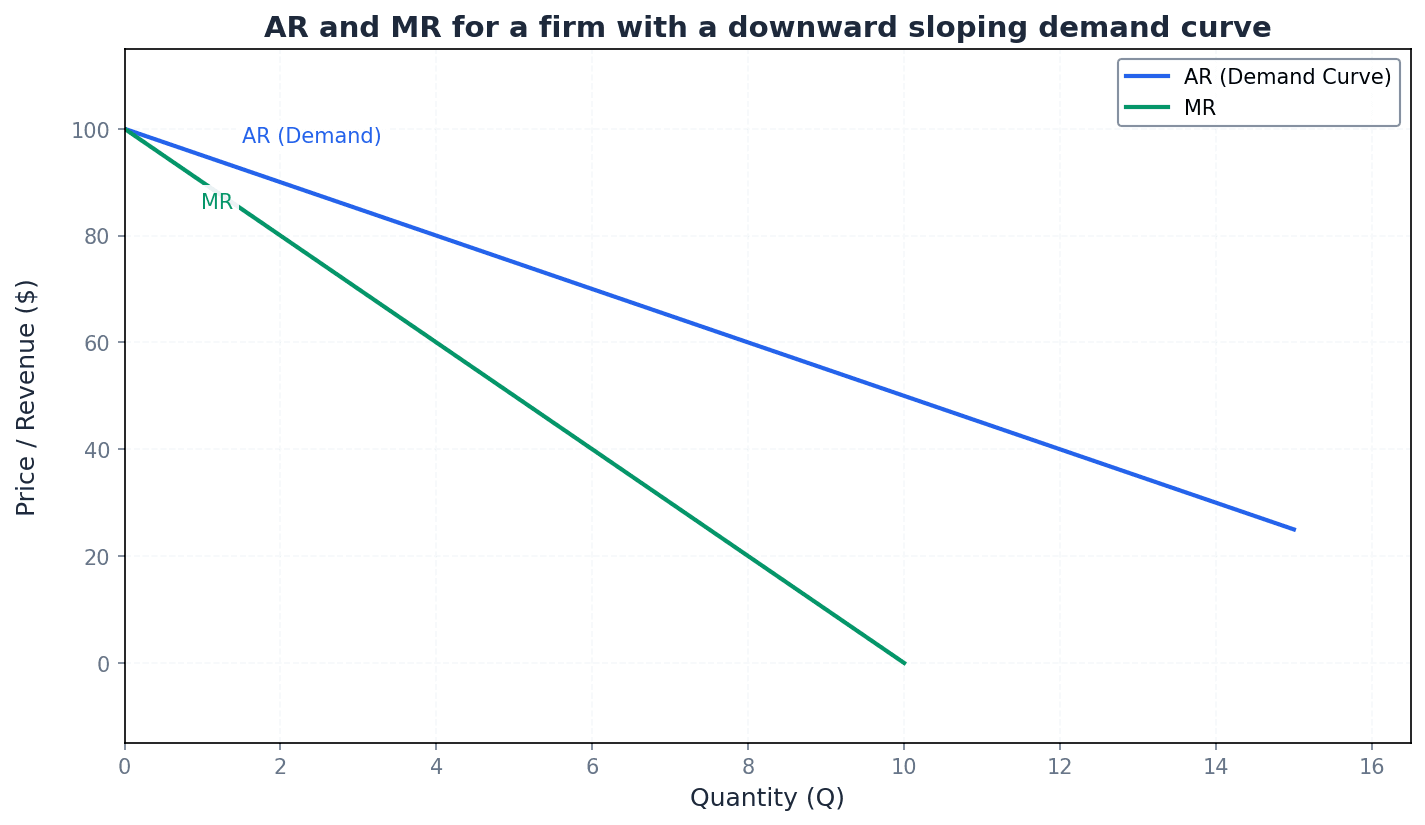
For a firm with a downward-sloping demand curve, the MR curve is always below the AR curve (AR = Demand).
A common error is to refer to total revenue when discussing marginal decisions, instead of marginal revenue. Always use marginal revenue when considering the impact of one additional unit.
normal profit — Normal profit is the minimum level of profit an entrepreneur will expect to reflect what could have been earned elsewhere with the resources that are available.
It is considered a cost of production because without it, the entrepreneur would not remain in business. It represents the opportunity cost of the entrepreneur's capital and effort, and is included in total costs. If you could earn 50,000 is your normal profit for running your own business; anything less, and you might as well work for someone else.
Learners often forget that normal profit is an item in the total costs of a firm. Remember, economic profit deducts normal profit.
supernormal profit — Supernormal profit is any profit over and above normal profit.
Also known as economic profit, it signals to other firms that a market is attractive, potentially leading to new entrants. It indicates that a firm is earning more than the minimum required to stay in business. If your normal profit is 70,000, then the extra $20,000 is supernormal profit.
Profit (economic)
Used to calculate economic profit, which accounts for opportunity costs including normal profit.
Supernormal profit
Used to calculate profit earned above the minimum required to stay in business.
Students sometimes confuse supernormal profit with accounting profit; accounting profit does not typically subtract the opportunity cost of the entrepreneur's resources.
Subnormal profit — Subnormal profit is when the profit that is earned by a firm is less than normal profit.
If a firm consistently makes subnormal profit, it indicates that its resources could earn a better return elsewhere. This is a signal for the firm to consider withdrawing from the market in the long run. If your normal profit is 30,000, then you are making a subnormal profit, meaning you'd be better off doing something else with your resources.
To show profit on a diagram, first find the profit-maximising output (MC=MR). Then, draw a vertical line up to the AR and AC curves. The area of the rectangle between AR and AC at that quantity represents the profit (or loss).
Always draw cost and revenue diagrams accurately. Label axes (Cost/Revenue/Price, Quantity) and ensure MC cuts ATC and AVC at their minimum points.
Advantages & Disadvantages
Economies of Scale
Diseconomies of Scale
Evaluation Starters
Essay Structure Guide
Introduction
Begin by defining the key terms relevant to the question, such as short-run/long-run, costs, revenues, and profit types. Briefly outline the scope of your essay, indicating whether you will focus on production, cost, or revenue aspects, and how they interrelate.
Conclusion
Summarise your main arguments, reiterating the interconnections between production, costs, revenues, and profits. Provide a final, balanced judgment on the importance of these concepts for understanding firm behaviour and market outcomes, perhaps highlighting the dynamic interplay between short-run constraints and long-run strategic decisions.
This chapter explores various market structures, from the theoretical ideal of perfect competition to different forms of imperfect competition like monopolistic competition, oligopoly, and monopoly. It details their defining characteristics, firm performance, and introduces concepts such as concentration ratios, collusion, and contestable markets, highlighting their implications for efficiency and consumer welfare.
Perfect competition — An ideal market structure where there are many firms, freedom of entry into the industry with all firms producing identical products, firms are price takers and there is perfect information for all firms in the market.
This model serves as a benchmark for efficiency, as supernormal profits are competed away in the long run, leaving only the most efficient firms making normal profit. Firms have no market power and cannot influence price, much like vendors at a farmers' market selling identical apples.
Students often think perfect competition is common in the real world, but actually it is a theoretical ideal used for comparison, with very few real-world examples.
When asked to 'analyse' perfect competition, focus on its efficiency implications (productive and allocative efficiency) and how it acts as a benchmark for other market structures.
Imperfect competition — A collective term for market structures other than perfect competition, including monopoly, monopolistic competition, oligopoly, and natural monopoly.
These market structures deviate from the ideal of perfect competition due to factors like fewer firms, product differentiation, barriers to entry, or imperfect information, leading to varying degrees of market power for firms. This is like a shopping mall with diverse stores, from unique boutiques to large chains.
When comparing market structures, clearly state the specific type of imperfect competition you are referring to and highlight the key characteristics that differentiate it from perfect competition.
Monopolistic competition — A market structure where there are many firms and freedom of entry into an industry, but firms have some control over the product and its price due to product differentiation.
Firms are price makers but face a relatively elastic demand curve due to many substitutes. They can make supernormal profits in the short run, but free entry of competitors eliminates these in the long run, leading to normal profits, similar to local restaurants competing with unique recipes.
Students often confuse monopolistic competition with monopoly, but actually monopolistic competition has many firms and low barriers to entry, while monopoly has a single firm and high barriers.
When discussing monopolistic competition, emphasize the role of product differentiation and non-price competition, and explain how free entry leads to normal profits and excess capacity in the long run.
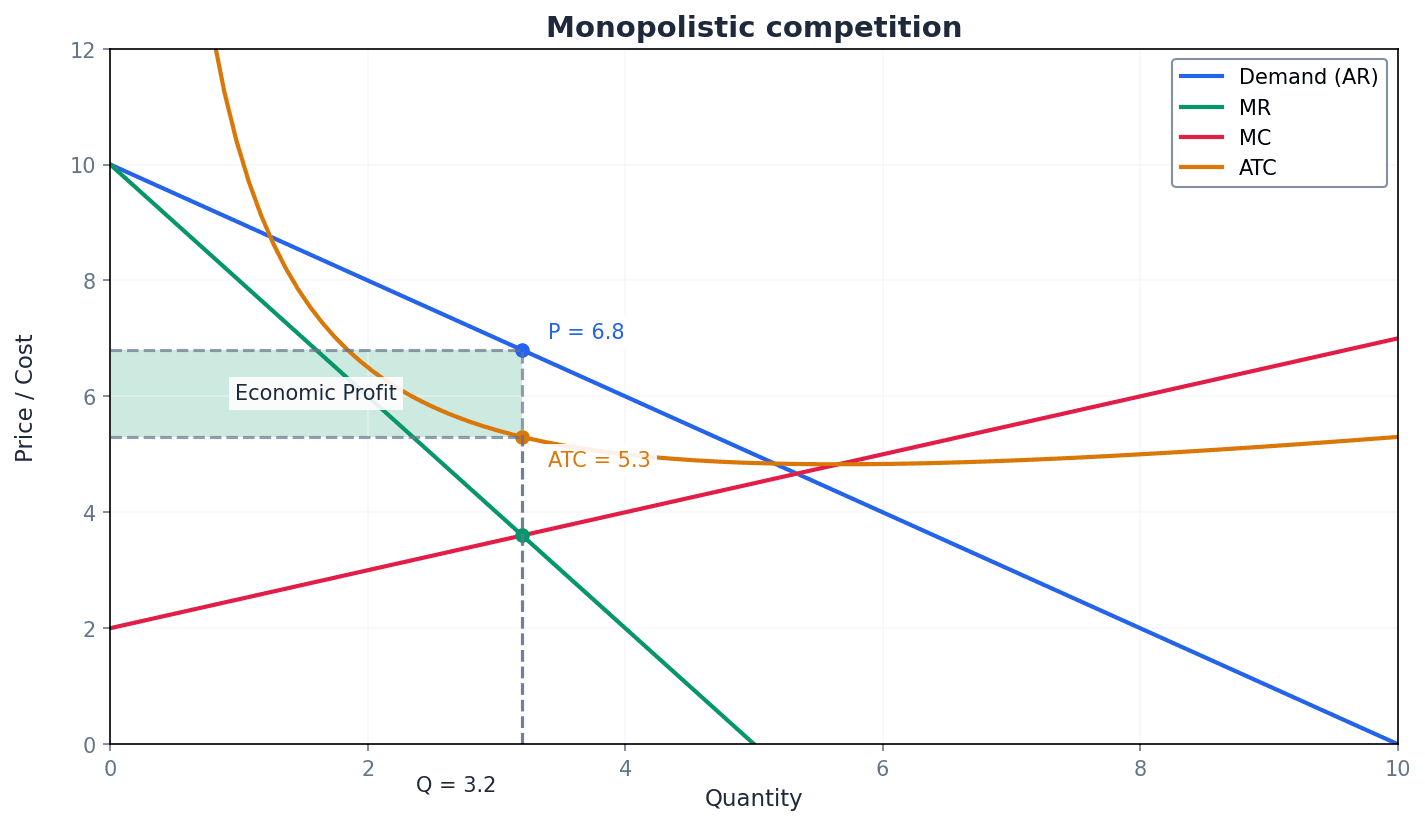
Oligopoly — A market situation where the total output is concentrated in the hands of a few firms, leading to interdependence in their decision-making.
Oligopolistic firms have market power and can erect barriers to entry. Their decisions on price and output are interdependent, meaning each firm must consider the reactions of its rivals, much like the mobile phone network industry where providers react to competitors' changes.
When analysing oligopoly, discuss interdependence and the potential for both competitive and collusive behaviour, using concepts like the kinked demand curve or Prisoner's Dilemma.
Monopoly — A market structure where there is a single seller in the market, or one firm dominates the market due to a very large market share.
A pure monopoly has a single firm controlling the entire output, while a dominant monopoly has a significant market share (e.g., over 25% or 40% in the UK). Monopolies are price makers and are protected by substantial barriers to entry, allowing them to earn supernormal profits in the long run, similar to a single company owning all water supply infrastructure in a city.
When evaluating monopoly, compare its performance (higher price, lower output, supernormal profit, inefficiency) against perfect competition, but also consider potential benefits like economies of scale and investment in innovation.
Pure monopoly — A market situation where there is just one firm producing a good or service for the entire market.
This is the most extreme form of monopoly, where the single firm faces the entire market demand curve and has complete control over price or quantity, subject to consumer demand. It is protected by substantial barriers to entry, like a historical national postal service.
Distinguish between a 'pure monopoly' and a 'dominant monopoly' (e.g., >25% market share) when answering questions, as the implications for market power and regulation can differ.
Natural monopoly — A particular form of monopoly where long-run average costs are lower when there is just one firm in the industry.
This occurs when fixed costs are very high, and economies of scale are so substantial that a single firm can supply the entire market at a lower average cost than multiple competing firms. It is often seen in industries with extensive infrastructure, such as a railway network.
When discussing natural monopoly, focus on the concept of economies of scale and the high fixed costs that make it inefficient for multiple firms to operate, often linking it to public services and government intervention.
Market structures are defined by several key characteristics: the number of buyers and sellers, the degree of product differentiation, the freedom of entry and exit, and the availability of information. These factors determine the level of competition and the market power of individual firms. For instance, perfect competition features many firms, identical products, and free entry, while a monopoly has a single firm, unique products, and high barriers to entry.
Barriers to entry — A range of obstacles that deter or prevent new firms from entering a market to compete with existing firms.
These barriers give existing firms market power, allowing them to make decisions without the immediate threat of new competition. They can be legal (e.g., patents), market-based (e.g., brand loyalty), cost-related (e.g., high start-up costs), or physical (e.g., control of raw materials), acting like a high wall around a castle.
When asked to 'explain' barriers to entry, provide specific examples for each type (legal, market, cost, physical) and link them to how they deter new firms and grant market power.
Sunk costs — Costs that cannot usually be recovered if a firm is shutting down, as the resources are not easily transferred to other uses.
These costs act as a barrier to exit from an industry because the capital investment will be lost. The risk of incurring sunk costs deters potential entrants, thus also acting as a barrier to entry, similar to a highly specialised machine that cannot be repurposed.
Product differentiation — The process of making a product different from those of competitors, often through quality, physical differences, branding, or marketing.
This gives firms a slight degree of monopoly power, allowing them some control over price. It is a key characteristic of monopolistic competition and can also be present in oligopolies, much like different brands of soft drinks are differentiated by taste and branding.
When discussing product differentiation, explain how it affects the firm's demand curve (making it downward-sloping and less elastic) and its ability to engage in non-price competition.
Price takers — Firms that have no influence on the market price and must accept the ruling price determined by the forces of market demand and the output of all firms.
This is a characteristic of perfect competition, where individual firms are so small relative to the market that their output decisions do not affect the overall market price. Their demand curve is perfectly elastic, like a single wheat farmer selling at the global market price.
When describing price takers, explicitly state that their demand curve is perfectly elastic and that marginal revenue equals average revenue and price.
Price makers — Firms that have some influence on the market price and can choose the price to charge or the quantity to supply, but not both.
This is a characteristic of imperfectly competitive markets (monopoly, oligopoly, monopolistic competition) where firms face a downward-sloping demand curve. Their ability to set prices depends on their market power and the availability of substitutes, similar to a company with a patented new drug.
When analysing price makers, explain how their demand curve is downward-sloping and how they determine their profit-maximising price and output where MC=MR.
Shutdown price — The price at which a firm can continue in production making short-run losses, as long as the price received covers the average variable cost (AVC).
If the price falls below AVC, the firm should shut down immediately because it cannot even cover its variable costs, and its loss would be greater than its fixed costs. Above AVC but below ATC, it covers variable costs and some fixed costs, like a restaurant staying open if it covers ingredients and wages, but not rent.
Students often think a firm should shut down as soon as it makes a loss, but actually in the short run, it can continue operating as long as price covers AVC, as fixed costs are sunk.
Clearly distinguish between short-run and long-run shutdown decisions. In the short run, cover AVC; in the long run, cover all costs (ATC) to make normal profit.
The performance of firms in different market structures varies significantly in terms of revenues, output, and profits. Perfect competition leads to productive and allocative efficiency in the long run, with firms earning only normal profits. Monopolies, however, can earn supernormal profits due to barriers to entry, often leading to higher prices, lower output, and potential X-inefficiency. Monopolistic competition sees firms earning normal profits in the long run due to free entry, while oligopolies exhibit complex strategic behaviour due to interdependence.
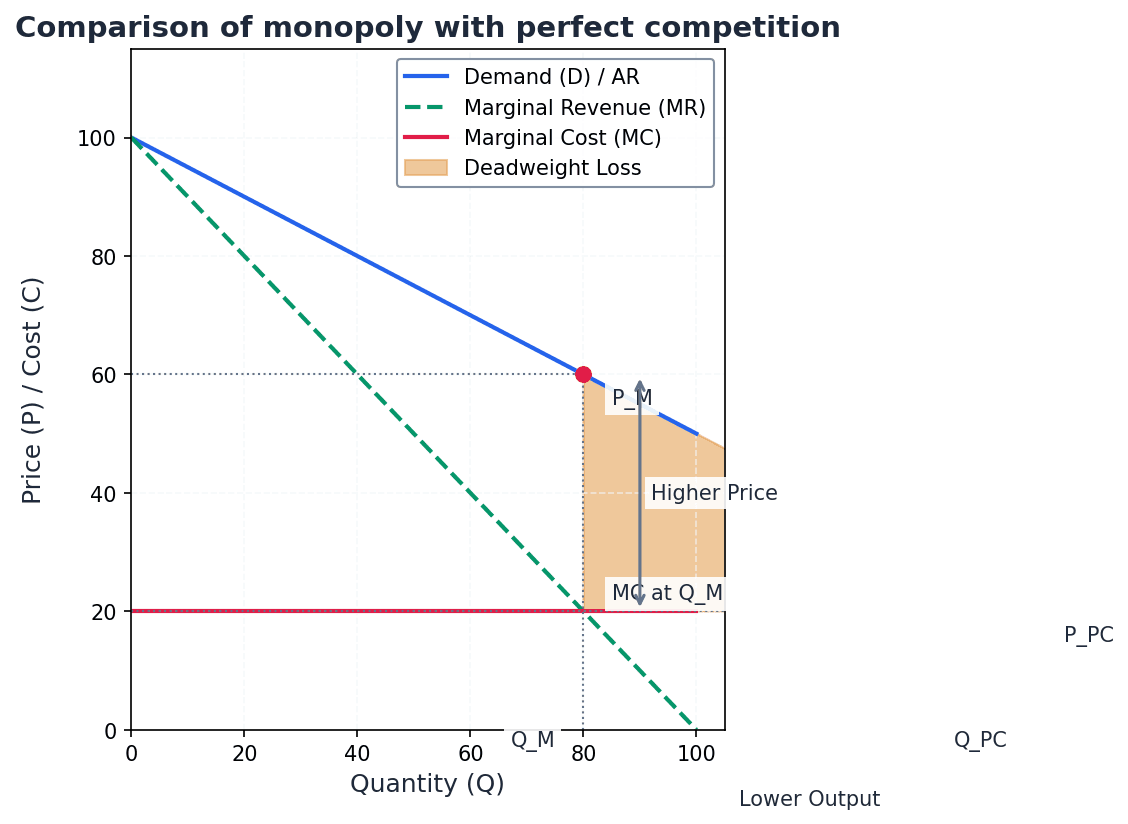
X-inefficiency — A type of productive inefficiency where a firm is not producing at the lowest possible cost for a given level of output.
This often occurs in monopolies or state-owned enterprises due to a lack of competitive pressure, leading to complacency, poor management, or excessive costs (e.g., too many workers, inefficient use of capital), similar to a government department with a guaranteed budget.
When discussing X-inefficiency, explain that it is a form of productive inefficiency caused by a lack of competitive pressure, leading to higher actual costs than the minimum possible costs for a given output.
Concentration ratio — A measure of the market share of a given number of firms (usually 3, 4 or 5) in relation to the total market size.
It is calculated by adding the percentage market shares of the top firms, typically based on sales value, physical output, or number of employees. A higher ratio indicates a less competitive market, closer to oligopoly or monopoly, like looking at the top 4 pizza chains' share of total sales.
4 firm concentration ratio
Used to measure the power of firms in a market; can also be calculated for 3 or 5 firms. A ratio greater than 60% is often considered 'highly oligopolistic'.
When calculating a concentration ratio, ensure you use the correct number of firms specified (e.g., 4-firm) and clearly state what the ratio indicates about market structure (e.g., 'highly oligopolistic' if >60%).
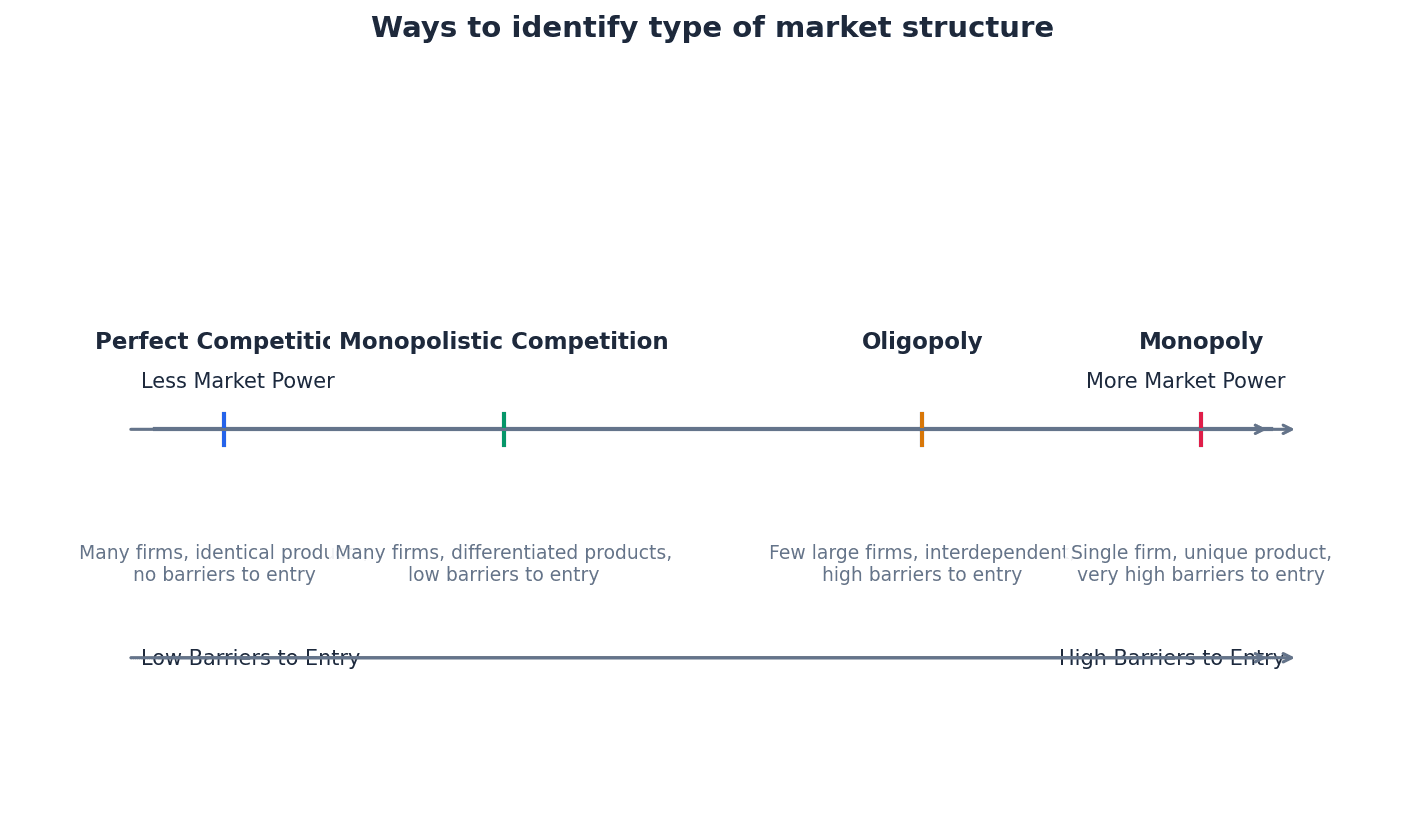
Collusion — An anti-competitive action by producers where firms co-operate with rivals, often informally through price leadership or formally through cartels, to restrict competition.
The objective of collusion is to maximise the profits of the whole group by acting as a single seller, often by agreeing on prices or output levels. Informal collusion is not illegal, but formal cartels are, similar to airlines secretly agreeing to raise ticket prices.
Distinguish between informal collusion (e.g., price leadership) and formal collusion (cartels), noting that cartels are illegal. Explain the incentives for firms to collude and the factors that make collusion difficult to sustain (e.g., Prisoner's Dilemma).
Cartel — A formal price or output agreement between firms in an industry to restrict competition.
By joining a cartel and agreeing prices or output levels, firms operate as a single seller, aiming to maximise their collective profit. Cartels are typically illegal in most countries due to their anti-competitive nature, like OPEC agreeing on oil production levels.
Price leadership — A form of informal collusion where firms automatically follow the lead of one dominant firm in the group when adjusting prices.
The dominant firm sets the price, and other firms in the oligopoly follow suit, leading to price stability without a formal agreement. This helps avoid price wars and maximises group profits, as when one major airline announces a fare increase and others follow.
Prisoner’s Dilemma — A concept in game theory that explains why two otherwise rational people might not co-operate, even if it appears to be in their best interest to do so.
It illustrates how individual self-interest can lead to a collectively suboptimal outcome. In oligopolies, it can explain why firms might break collusive agreements (like cartels) by increasing output, even though all firms would be better off if they cooperated, similar to two students deciding whether to work hard or slack off on a group project.
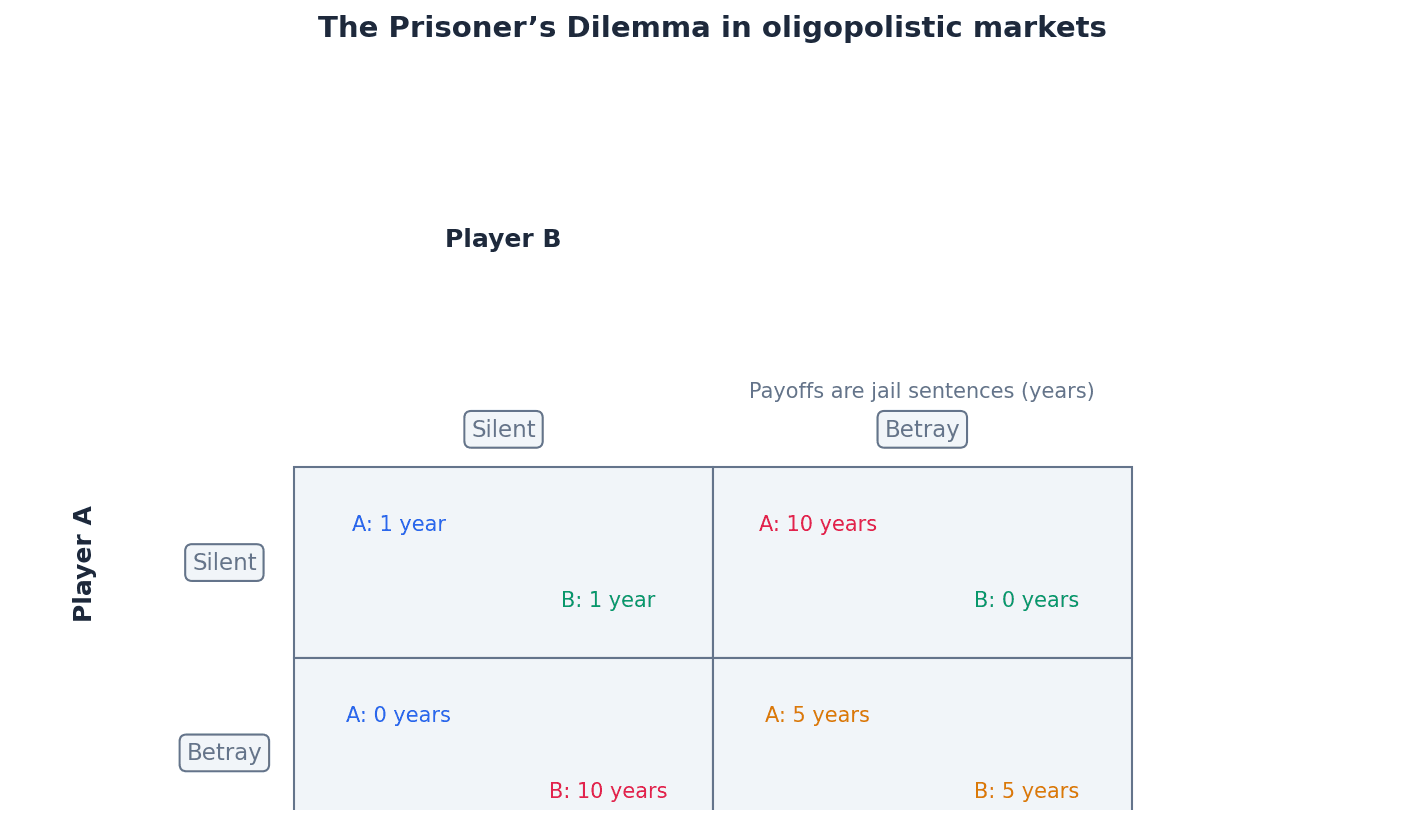
When applying the Prisoner's Dilemma to oligopoly, use a pay-off matrix to illustrate how individual incentives to 'cheat' (e.g., increase output in a cartel) can undermine co-operation and lead to a less profitable outcome for all.
Kinked demand curve — A traditional model of oligopoly used to explain how firms react to each other’s behaviour, assuming price rigidity.
The model assumes that if an oligopolist raises its price, rivals will not follow, leading to a large fall in demand (elastic). If it lowers its price, rivals will follow, leading to a small increase in demand (inelastic). This creates a 'kink' at the current price, suggesting price stability, like friends deciding where to eat.
Students often think the kinked demand curve explains how the price is set, but actually it only explains why prices tend to be rigid once a price has been established, not how that initial price was chosen.
Non-price competition — Competitive strategies that do not involve changing the price of a product, such as advertising, product innovation, brand proliferation, market segmentation, and process innovation.
Firms, especially in oligopolies and monopolistic competition, use non-price competition to increase revenue, strengthen market power, and differentiate their products without triggering price wars. It aims to shift the demand curve or make it less elastic, like car companies adding new features or advertising.
Predatory pricing — A strategy where existing large producers cut their price in order to eliminate any high-cost producers or new firms that enter the industry.
This involves deliberately setting prices below average cost to drive competitors out of the market, with the intention of raising prices once competition is eliminated. It is often illegal, like a large supermarket selling milk below cost to force out a local dairy.
Students often confuse predatory pricing with limit pricing, but actually predatory pricing aims to force existing competitors out, while limit pricing aims to deter new entrants.
Limit pricing — A strategy where firms deliberately set a low price and temporarily abandon profit maximisation as their objective to deter new entrants.
By setting a price below the level that would attract new firms, existing firms sacrifice some short-run profit to maintain their market share and prevent future competition. This can be a form of collusion if agreed upon by multiple firms, like an internet provider offering slightly lower prices to deter new competitors.
Price discrimination — A practice where a monopolist chooses to split up the output and sell it at different prices to different customers.
This allows the monopolist to capture more consumer surplus and convert it into producer surplus, thereby increasing its profits. It requires market power, the ability to segment customers, and prevention of resale, such as a cinema charging different prices for student and adult tickets.
When explaining price discrimination, identify the conditions necessary for it to occur (market power, market segmentation, prevention of resale) and its impact on consumer and producer surplus.
Contestable market — A market where potential competitors can influence the conduct of firms currently in the market, even if there are few actual competitors.
The key features are low or zero barriers to entry and exit (costless entry and exit, no sunk costs). The threat of 'hit and run' entry by new firms forces existing firms to behave more competitively, even if they are a monopoly or oligopoly, like the domestic airline industry where new airlines can easily enter or exit routes.
Students often think a contestable market is a market structure, but actually it is a set of conditions that can apply to any imperfect market structure, influencing the behaviour of firms within it.
When analysing contestable markets, focus on the role of low barriers to entry and exit (especially sunk costs) in forcing incumbent firms to behave efficiently and earn only normal profits, regardless of the number of actual firms.
Hit and run entry — A characteristic of contestable markets where a firm is attracted to enter a market due to high profits, takes a share of the profits, and then leaves once profit levels fall back to normal.
This behaviour is possible because entry and exit are costless (no sunk costs). The threat of such entry forces incumbent firms to keep prices low and earn only normal profits in the long run, similar to a pop-up shop making quick profits during a festival and then closing.
Start your answers by defining the market structure in question, mentioning its key characteristics: number of firms, barriers to entry, and product type.
For evaluation, compare market structures based on price, output, and efficiency (allocative, productive, X-inefficiency).
When identifying a market structure from data, calculate the concentration ratio and use it as evidence alongside a discussion of other characteristics like barriers to entry.
Advantages & Disadvantages
Monopoly
Oligopoly
Evaluation Starters
Essay Structure Guide
Introduction
Begin by defining market structure and briefly outlining the range of structures from perfect competition to monopoly. State the essay's purpose, which is to analyse the characteristics and performance of different market structures, often focusing on their implications for efficiency and consumer welfare.
Conclusion
Summarise the key differences in characteristics and performance across market structures. Reiterate the main arguments regarding efficiency and consumer welfare. Conclude with a nuanced statement about the complexities of real-world markets and the challenges of achieving optimal outcomes, often requiring a balance between competition and other objectives.
This chapter examines why firms vary in size and how they grow, distinguishing between internal expansion and external integration methods. It also explores the dynamics of cartels and the principal-agent problem, highlighting conflicts of interest due to information asymmetry.
Internal growth — A firm decides to retain some of the profit rather than pay it out to the owners, putting it back into the business as new investment to increase productive capacity.
This type of growth involves a firm using its retained profits to expand its existing operations or build new facilities, much like a person saving money from their salary to buy a bigger house. It allows a firm to expand its operations and output from within, using its own accumulated resources, and is common in capital-intensive activities with expanding markets, often during economic boom periods.
Students often think internal growth means only increasing sales, but actually it specifically refers to increasing productive capacity through reinvested profits.
When asked to explain internal growth, ensure you mention 'retained profit' and 'new investment' to increase 'productive capacity' for full marks.
External growth — The business expands by joining with others via takeovers or mergers.
This method of growth involves combining with other existing firms, either through a mutually agreed merger or a takeover where one firm acquires control of another, similar to two small sports teams combining to form one larger, stronger team. It can be a quicker route to expansion, especially when fixed costs are high.
Students often think external growth is only about buying other companies, but actually it also includes mutually agreed mergers where both parties join to form a new entity.
Distinguish clearly between 'takeovers' (one firm buys another) and 'mergers' (firms agree to join) when discussing external growth, as the nuances are important.
Firms exhibit varying sizes due to a multitude of factors. Some firms remain small because they operate in niche markets, face limitations in accessing finance for expansion, or their owners prefer to maintain a smaller scale of operation. Conversely, firms grow large by pursuing strategies of internal expansion or external integration, often driven by the desire to achieve economies of scale or increase market power.
Students often believe that all small firms will eventually grow into large businesses; however, only a very small percentage achieve this.
External growth primarily occurs through integration, which can take several forms depending on the relationship between the merging or acquired firms. These methods include horizontal, vertical, and conglomerate integration, each with distinct motives and consequences for the firms involved and the wider market.
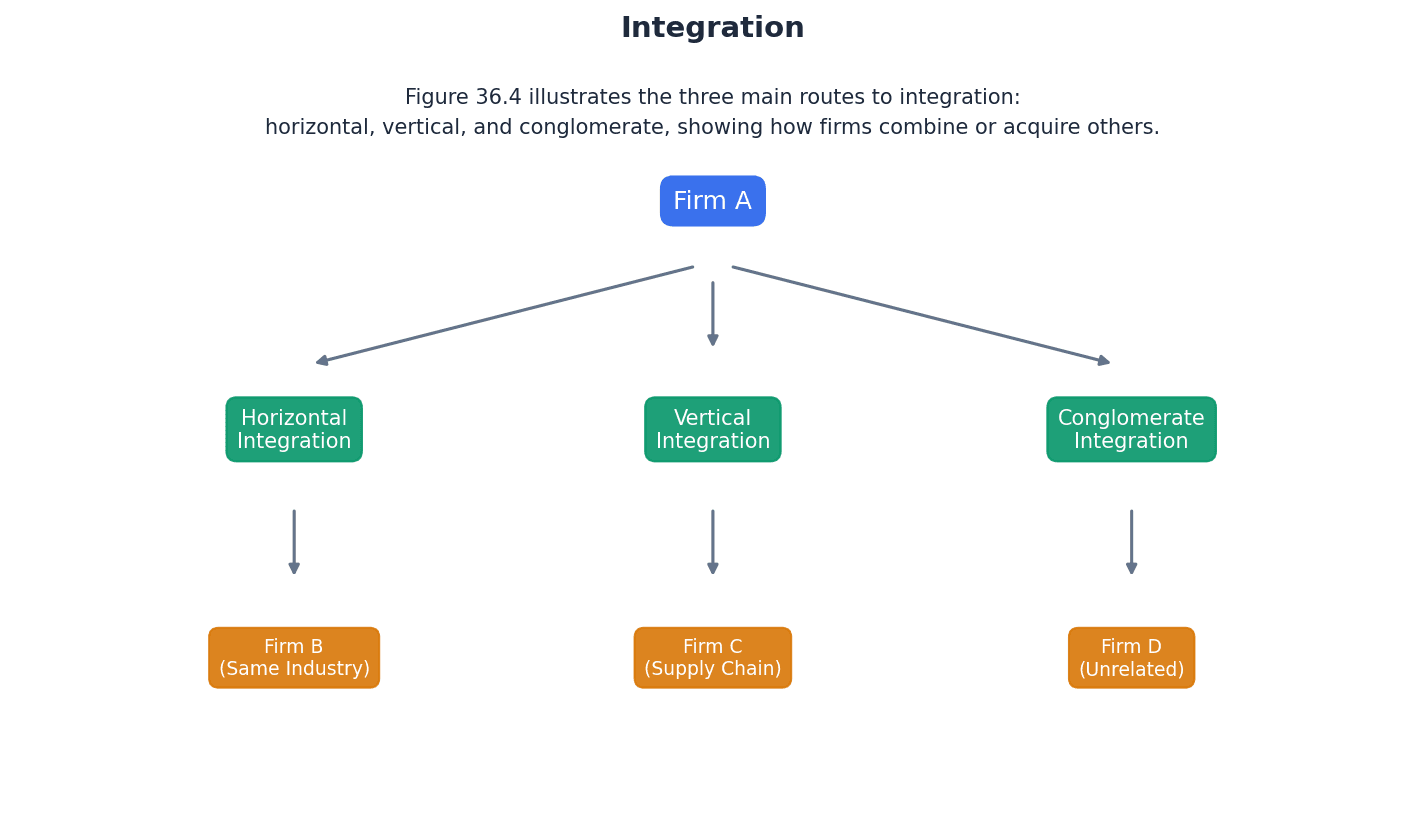
Horizontal integration — A process or strategy used by firms to strengthen their position in an industry, involving the merger or acquisition of a business that is in the same sector of an industry.
This type of integration occurs between firms at the same stage of production in the same industry, such as two competing coffee shop chains merging. Its prime motives are to achieve economies of scale, increase market power, and reduce competition, potentially leading to abnormal profits.
Students often think horizontal integration is just any merger, but actually it specifically refers to firms at the same stage of production in the same industry.
When analysing horizontal integration, discuss both the benefits (economies of scale, market power) and potential drawbacks (government intervention due to monopoly concerns).
Vertical integration — Where a firm grows by moving into a forward or backward stage of its production process or supply chain.
This can be 'forward' (e.g., a manufacturer buying a retailer) or 'backward' (e.g., a manufacturer buying a supplier of raw materials), similar to a bakery buying a wheat farm or opening its own chain of sandwich shops. Benefits include improved security and quality of supplies and reduced supply chain costs, but it can lead to higher costs if not managed effectively.
Students often confuse forward and backward vertical integration, but actually forward moves closer to the consumer, while backward moves closer to raw materials.
Clearly state whether the integration is 'forward' or 'backward' and provide a relevant example to demonstrate understanding of vertical integration.
Conglomerate — A firm whose growth comes from the purchase of unrelated businesses.
The primary rationale for conglomerate growth is to spread risk across diverse business interests, much like a company owning a car manufacturer, a hotel chain, and a tea plantation. Each company within a conglomerate typically operates independently, and losses from one subsidiary can be offset by profits from others.
Students often think a conglomerate is just a very large company, but actually its defining characteristic is the ownership of businesses in unrelated industries.
When discussing conglomerates, focus on 'spreading risk' as the main reason for this type of integration, and mention the challenge of strategic management due to diversity.
Cartel — A formal agreement between member firms in an industry to limit competition.
Cartels typically involve fixing quantities to be produced or prices for products, aiming to maximise profits similar to a monopolist, much like a group of students agreeing to all charge the same high price for their tutoring services. Their long-term survival depends on high barriers to entry and the absence of internal disagreements or external threats.
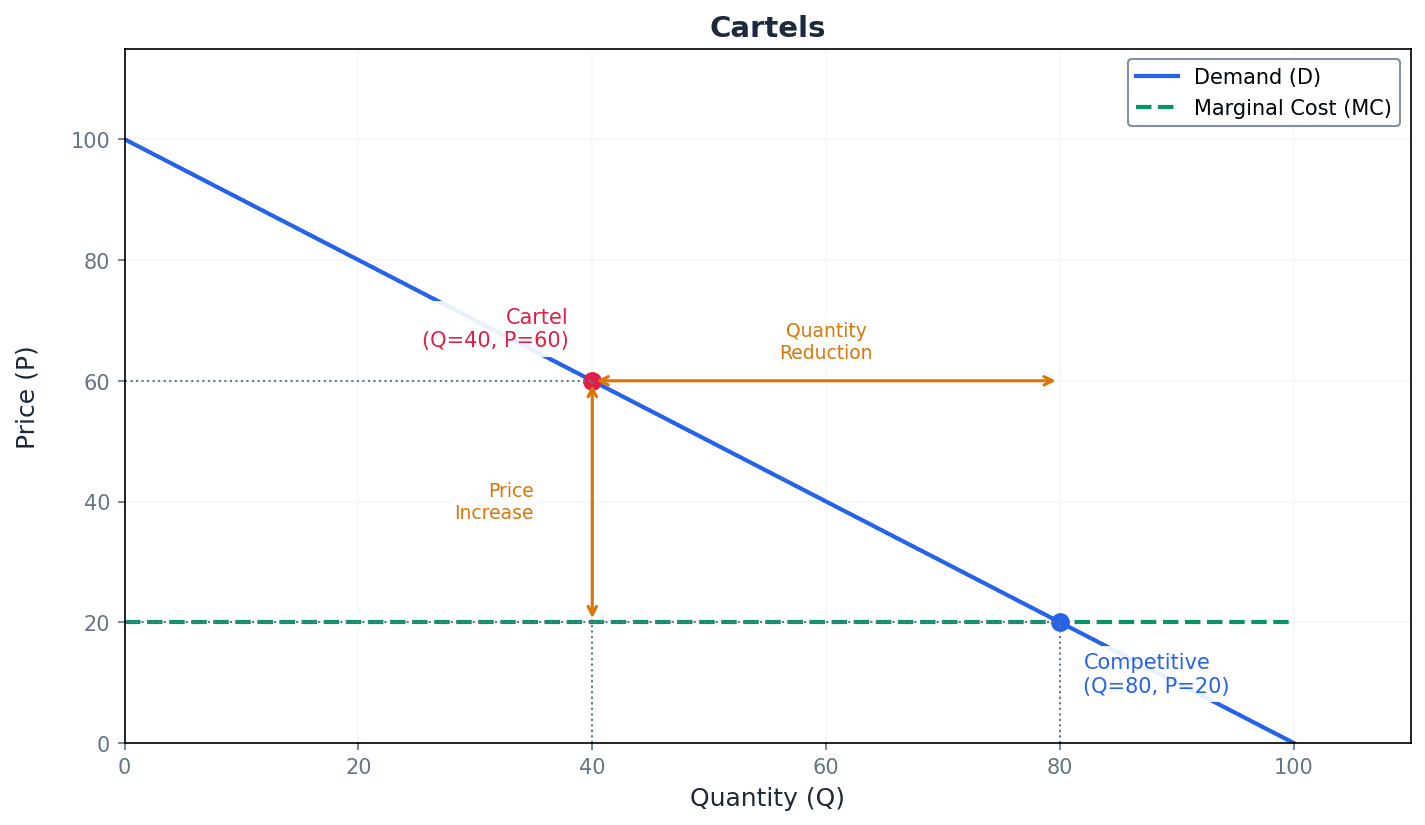
Students often assume cartels are always stable and effective; they are often threatened by internal disagreements, new suppliers, and legal obstacles.
When analysing cartels, discuss the conditions for effectiveness (high barriers to entry, strong dominant member) and the threats to their survival (price wars, legal obstacles, new suppliers).
Principal–agent problem — Occurs when one person (the agent) makes decisions on behalf of another person (the principal), but the agent may act in their own interest rather than the principal's.
This problem arises due to asymmetric information, where the agent (e.g., firm management) has more information than the principal (e.g., shareholders), similar to a mechanic recommending unnecessary repairs to increase their own profit. It can lead to a misallocation of resources if agents pursue personal prestige or career development over the firm's profit maximisation.
Students often think the principal-agent problem is just about managers making bad decisions, but actually it's specifically about managers making decisions that benefit themselves over the owners due to information asymmetry.
Explain the roles of 'principal' and 'agent' clearly, link the problem to 'asymmetric information' and 'moral hazard', and discuss its consequence as 'misallocation of resources' or 'agency cost'.
Asymmetric information — A situation where one party in a transaction has more or superior information compared to another.
In the context of the principal-agent problem, managers (agents) possess more detailed, day-to-day information about the firm's operations and growth plans than the owners (principals), much like a used car seller knowing more about a car's history than the buyer. This informational imbalance can lead to decisions that are not in the principal's best interest.
Students often think asymmetric information is just a lack of information, but actually it's specifically when one party has *more* information than the other, creating an imbalance.
Moral hazard — Occurs when one party takes on more risk because another party has agreed to bear the cost of those risks.
In the principal-agent context, if principals cannot fully monitor agents, agents might take actions that benefit themselves (e.g., risky growth strategies for prestige) knowing that the principals will bear the financial consequences if things go wrong, similar to someone with full insurance being less careful with their car. This is a consequence of asymmetric information.
Students often confuse moral hazard with adverse selection; moral hazard occurs *after* a transaction or agreement, due to changed incentives, while adverse selection occurs *before* due to hidden information.
Agency cost — The costs incurred by principals in monitoring agents and the costs arising from agents acting in their own self-interest.
These costs include expenses for monitoring agents' actions, structuring incentives to align interests, and the potential losses from agents making decisions that do not maximise the principal's welfare, much like the extra money paid for a trusted mechanic or time spent researching reviews. It represents the inefficiency arising from the principal-agent problem.
When discussing firm growth, always distinguish between internal (organic) and external (integration) methods.
For any merger question, state the exact type (horizontal, vertical, conglomerate) and analyse the specific motives and consequences.
In essays on cartels, earn evaluation marks by analysing their instability, focusing on the incentive for firms to cheat on the agreement.
To explain the principal-agent problem effectively, you MUST use the key terms: 'asymmetric information' and 'conflict of interest'.
When evaluating a merger, always consider the impact on different stakeholders: the firm itself (profits, efficiency), consumers (price, choice), and competitors.
Advantages & Disadvantages
Internal Growth
Horizontal Integration
Evaluation Starters
Essay Structure Guide
Introduction
Begin by defining the key terms related to firm growth and the specific focus of the question (e.g., types of integration, cartels, or the principal-agent problem). Briefly outline the main arguments you will present.
Conclusion
Summarise your main arguments without introducing new information. Provide a final, well-reasoned judgement or overall assessment, weighing the various factors discussed in your essay. Reiterate the most significant implications or challenges related to the question.
This chapter explores various objectives firms pursue beyond traditional profit maximisation, including survival, profit satisficing, sales maximisation, and revenue maximisation, often influenced by the principal–agent problem. It also analyses different pricing policies such as price discrimination, limit pricing, predatory pricing, and price leadership, and explains the crucial relationship between price elasticity of demand and a firm's total revenue.
Profit maximisation — Profit maximisation involves achieving the greatest difference between the total revenue and total cost (including normal profit).
This is the traditional objective assumed by economists, where firms produce at the output level where marginal cost equals marginal revenue (MC=MR). Achieving supernormal profit is a reward for taking risks, much like a baker finding the 'sweet spot' where the extra money from selling one more cake just covers its extra cost, leading to the biggest overall profit.
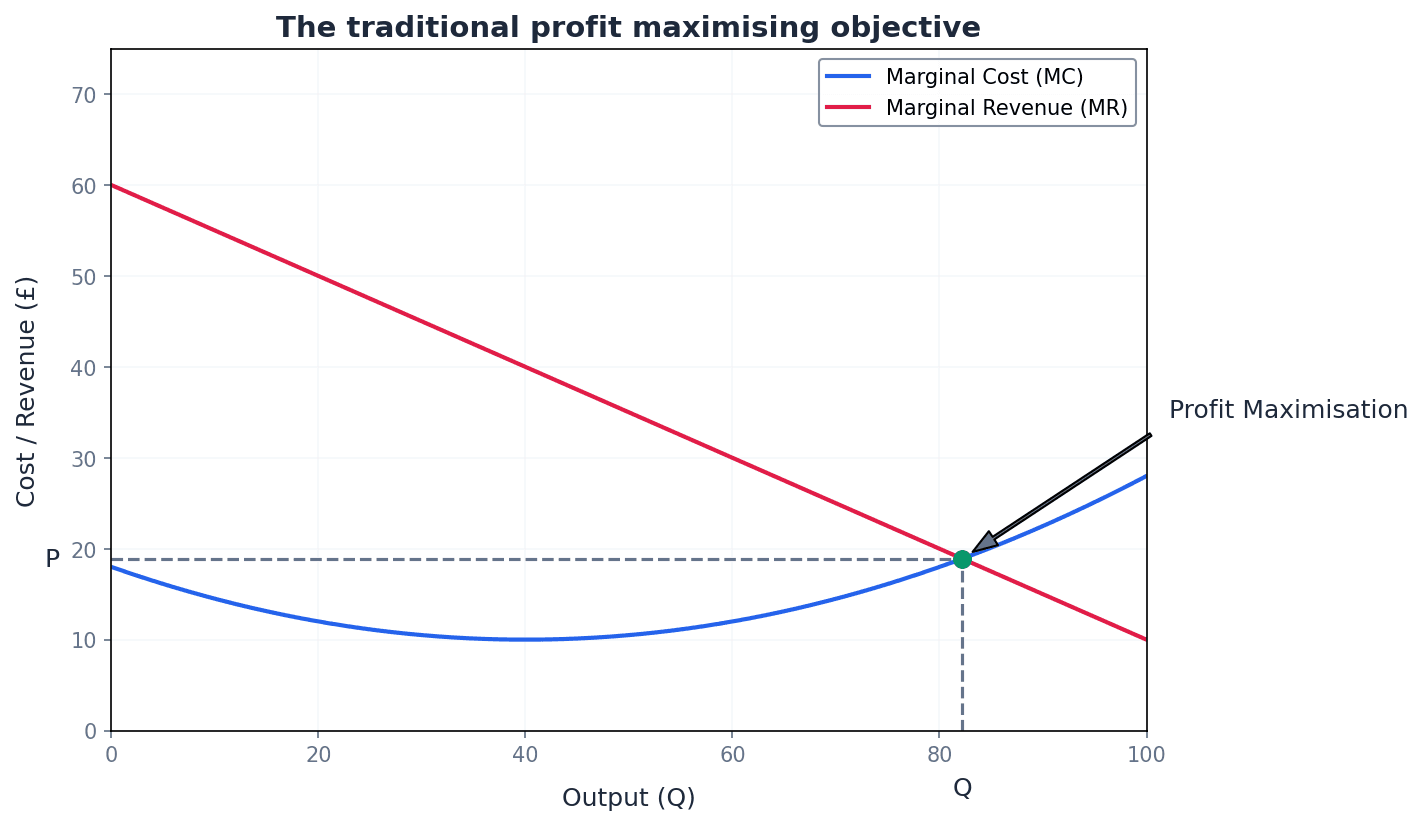
Students often think profit maximisation means selling the most units, but actually it means finding the output level where the difference between total revenue and total cost is greatest, which is not necessarily the highest sales volume.
When asked to 'analyse' profit maximisation, ensure you discuss both the MC=MR rule and the reasons why firms might not always achieve it, such as difficulty in identification or long-term strategic considerations.
Principal–agent problem — The principal–agent problem arises when the management (agents) may have different objectives to the shareholders (principals) of a firm.
This conflict of interest can lead managers to pursue objectives like revenue maximisation, growth, or personal benefits rather than strict profit maximisation, especially in large firms where ownership is divorced from control. It's like a gardener (agent) you hire to maintain your garden (principal) who might prefer expensive tools or longer breaks, benefiting them but not necessarily you.
Beyond profit maximisation, firms may pursue other objectives such as survival, profit satisficing, sales maximisation, and revenue maximisation. These alternative objectives often arise due to the principal-agent problem, where the interests of managers (agents) diverge from those of shareholders (principals), leading to a focus on factors other than pure profit.
Profit satisficing — Profit satisficing occurs when a firm seeks to make a reasonable or minimum level of profit, sufficient to satisfy the shareholders but also to keep other stakeholders happy.
This objective acknowledges that firms operate within a complex environment with various interest groups (shareholders, workers, consumers) whose expectations need to be met. It implies sacrificing some potential short-term profits for broader stakeholder satisfaction and long-term stability, similar to a small restaurant aiming for comfortable profits while also valuing happy staff and loyal customers.
When explaining profit satisficing, ensure you highlight the role of multiple stakeholders and the trade-offs involved, contrasting it with the singular focus of profit maximisation.
Sales maximisation — Sales maximisation is the objective to maximise the volume of sales rather than the total revenue from sales.
This objective leads to a higher output than revenue maximisation, specifically up to the break-even output where total revenue just covers total cost. It might be pursued to gain market share, achieve economies of scale, or deter new entrants, sometimes involving cross-subsidisation, much like a new streaming service offering low introductory prices to attract a large user base.
Cross-subsidisation — Cross-subsidisation occurs when the profit from one part of a firm is used to offset losses made elsewhere.
This strategy allows a firm to maintain loss-making operations, often for social objectives or to support a broader business strategy like sales maximisation. It's common in multi-product firms or state-owned enterprises, similar to a bus company using profits from busy routes to maintain less popular rural services.
Revenue maximisation — Revenue maximisation is an alternative theory of a firm’s behaviour where senior managers are interested in increasing sales and maximising total revenue from sales.
This objective is often linked to managerial salaries and bonuses, which are typically based on total revenue rather than profits. Production continues to the point where marginal revenue (MR) equals zero, resulting in a higher output than profit maximisation, much like a concert promoter aiming to fill a venue and maximise total ticket sales, even if it means slightly lower prices per ticket.
Students often confuse revenue maximisation with sales maximisation, but actually revenue maximisation aims for the highest total money received (where MR=0), while sales maximisation aims for the highest physical quantity sold (where TR=TC).
Clearly distinguish between sales maximisation (volume) and revenue maximisation (total money) in your explanations, especially when comparing their respective output levels and implications for profit.
The relationship between price elasticity of demand (PED) and a firm's total revenue is crucial for pricing decisions. For a downward-sloping demand curve, if demand is price elastic, a price cut increases total revenue; if demand is price inelastic, a price cut decreases total revenue. This understanding helps firms predict the impact of price changes on their earnings.
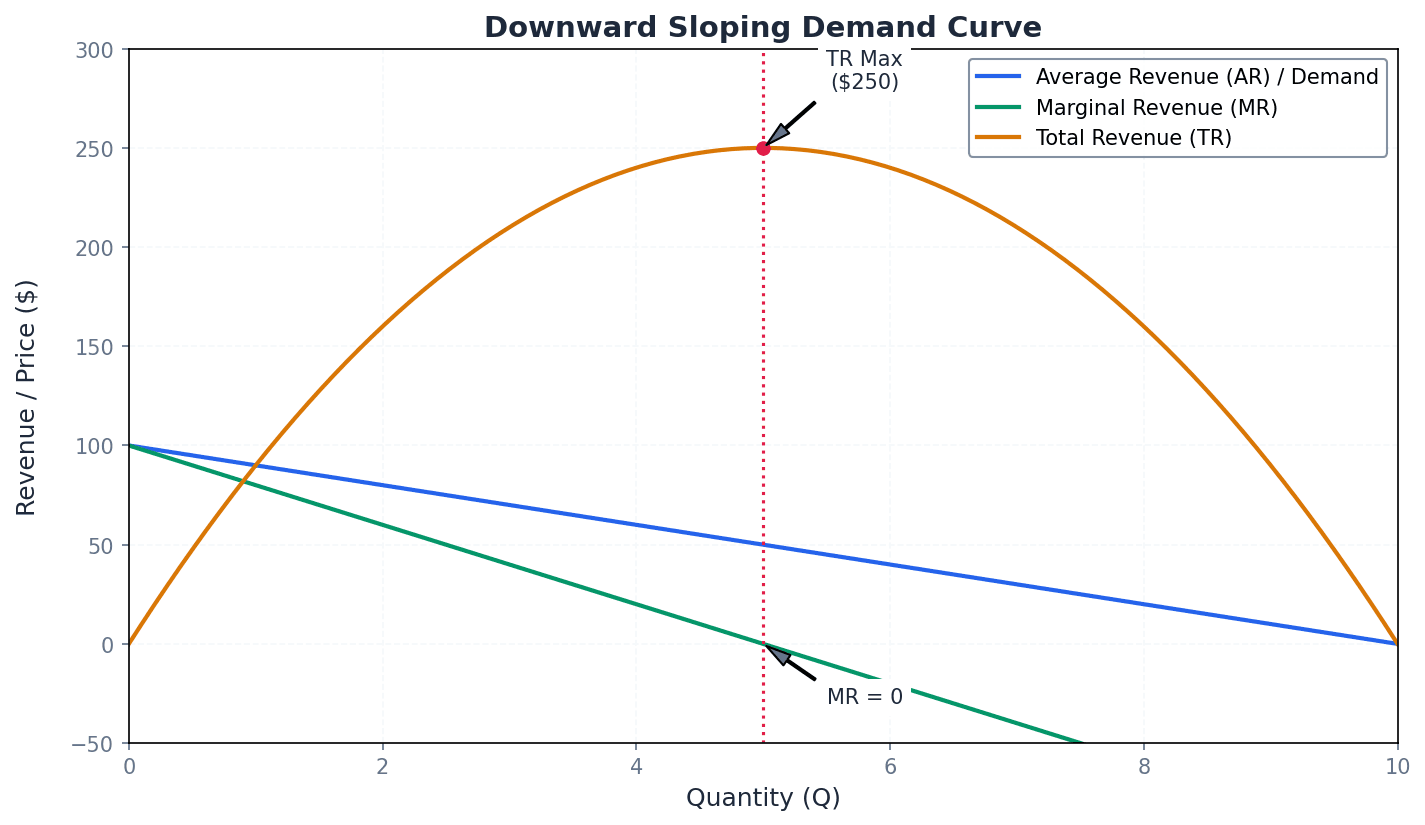
Cost-plus pricing — Cost-plus pricing is a technique where a firm works out the average total cost and then adds on a standard profit margin to determine the selling price.
This method is a practical approach to setting prices but is unlikely to result in maximum profit because it doesn't directly consider demand elasticity or marginal revenue. It's often used due to the difficulty in identifying the profit-maximising output, similar to a builder adding a fixed percentage to material and labour costs to set a house price.
Price discrimination — Price discrimination is a pricing policy used by firms to increase profits by reducing consumer surplus and converting this into producer surplus, by charging different prices to different consumers for the same product.
This policy requires the firm to have some control over price (a downward-sloping demand curve) and to be able to segment the market and prevent resale. It is not possible under perfect competition, much like an airline charging different prices for the same seat based on booking time or fare type.
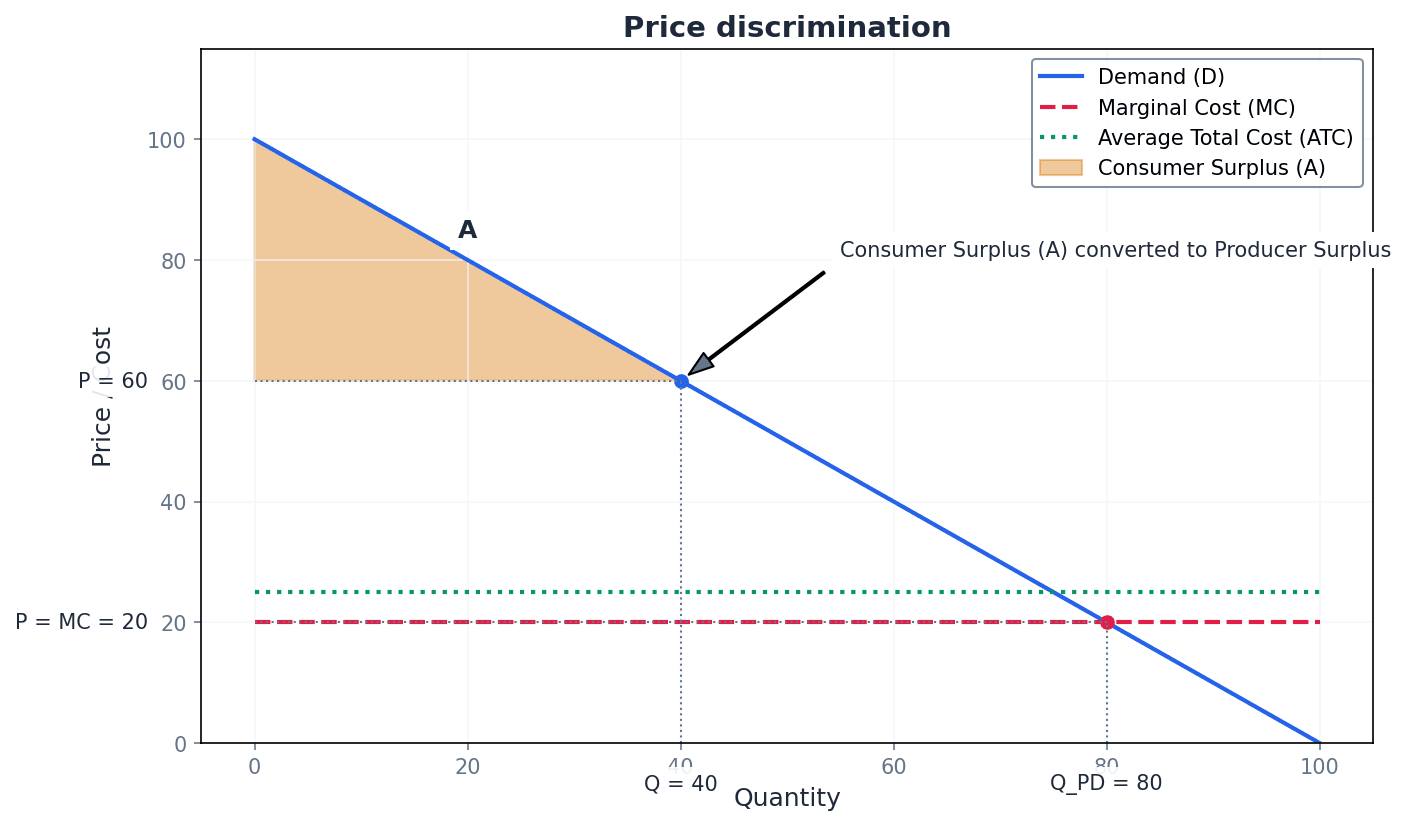
For price discrimination to be effective, three conditions must be met: the firm must have some market power (a downward-sloping demand curve), it must be able to segment the market into groups with different price elasticities of demand, and it must be able to prevent resale of the product between these different groups.
Students often think price discrimination is always illegal or exploitative, but actually it's a common business practice that can sometimes lead to increased output or allow a firm to operate profitably when it otherwise couldn't.
First degree price discrimination — First degree price discrimination is a situation where the firm sells each unit of a product to a different consumer, charging each the maximum price that they are willing to pay.
This is the most extreme form, where the firm extracts all consumer surplus. It is difficult to implement in practice and is most commonly seen in service sectors where prices are unique to each transaction and resale is impossible, like a private tutor charging personalised rates based on a student's ability to pay.
Students often think first-degree price discrimination is common, but actually it's rare because it requires perfect information about each consumer's willingness to pay, making it difficult to implement.
Second degree price discrimination — Second degree price discrimination is where consumers are only willing to purchase more of a product if price falls as more and more units are bought, meaning a higher price is charged for the first unit followed by a lower price as successive units are purchased.
This type involves quantity-based discounting, where the price per unit decreases as the quantity purchased increases. It benefits both consumers (lower average price for more units) and the firm (increased output, revenue, and profit), similar to buying a single can of soda for 10.
Third degree price discrimination — Third degree price discrimination is the most common form, requiring firms to actively discriminate between groups of consumers based on their different price elasticities of demand for the product.
Consumers with inelastic demand are charged a higher price, while those with elastic demand are charged a lower price. This requires the firm to segment the market and prevent resale between groups, such as a cinema offering student discounts where students have more elastic demand.
When analysing price discrimination, ensure you discuss the three conditions for it to be effective (market power, market segmentation, prevention of resale) and its consequences for both consumers and producers.
Beyond price discrimination, firms, particularly in non-perfectly competitive markets, employ various other strategic pricing policies. These include limit pricing, predatory pricing, and price leadership, each designed to achieve specific market objectives such as deterring entry or avoiding price wars.
Limit pricing — Limit pricing is a pricing policy applied in monopolies and oligopolies, involving firms setting a lower short-run price to deter new firms from entering their market.
This strategy sacrifices short-run profit maximisation to create a barrier to entry. The established firm increases output or services to a level that makes it unprofitable for potential new entrants to compete, much like an established internet provider temporarily dropping prices when a new competitor enters.
Predatory pricing — Predatory pricing occurs when an established firm responds to a new entrant by setting a price so low that the new firm cannot make a profit and is forced out of the market.
Once the rival is eliminated, the established firm raises its prices back to their former level. This practice is often illegal due to its anti-competitive nature and can also be used by established firms against each other to gain market share, similar to a large supermarket slashing prices below cost to force a smaller rival out.
Students often confuse predatory pricing with limit pricing, but actually predatory pricing involves deliberately making losses to force rivals out, while limit pricing aims to deter entry by making the market less attractive, not necessarily by incurring losses.
Highlight the illegality and anti-competitive nature of predatory pricing, distinguishing it from other pricing strategies like limit pricing by its intent to eliminate competition through unsustainable low prices.
Price leadership — Price leadership is a common feature of oligopolistic markets where all firms accept the price set by the leading firm, which is often the firm with the largest market share or is the brand leader.
This policy helps firms avoid price competition, allowing them to maximise total profits for all firms while focusing on non-price competition. Other firms quickly follow the leader's price changes, whether increases or decreases, much like major petrol companies following a price increase by one leading firm.
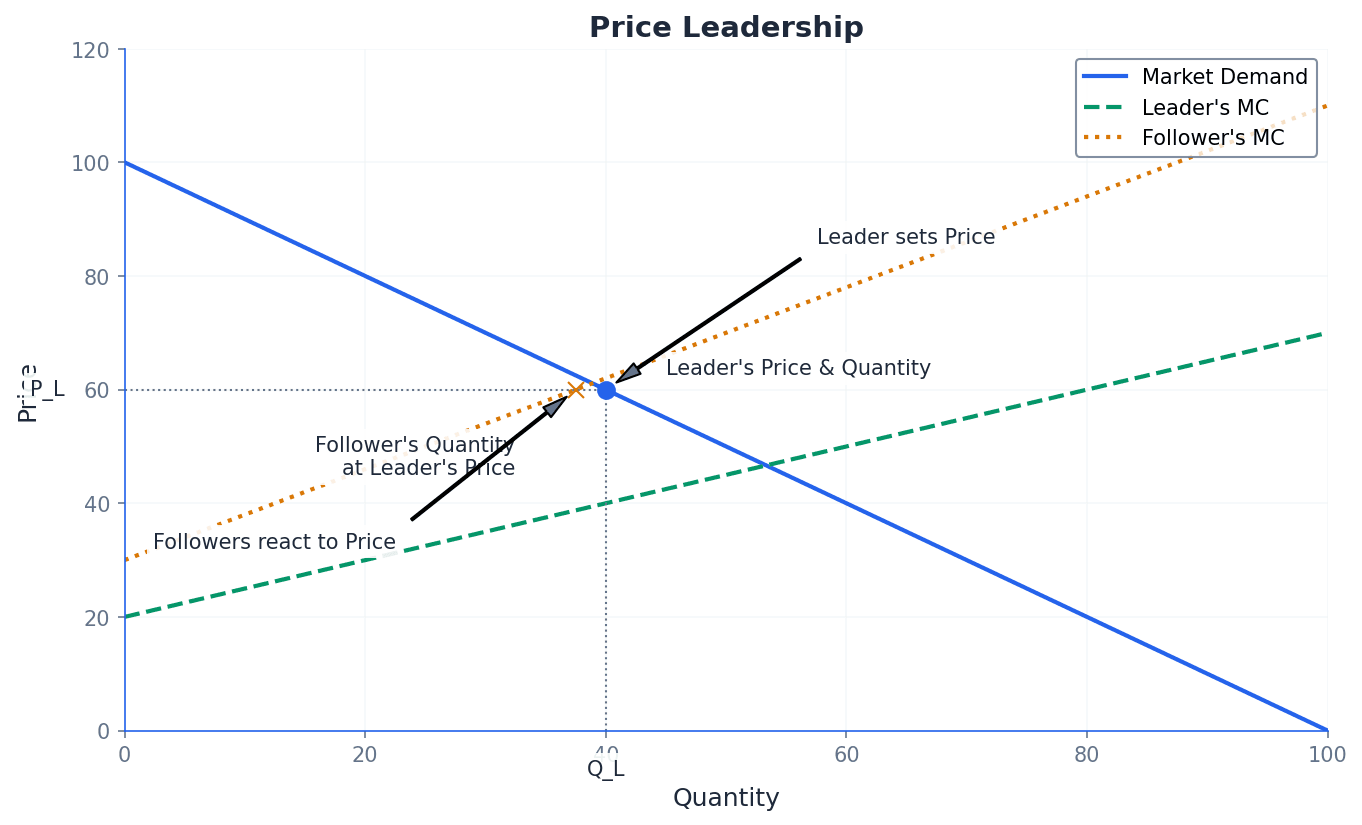
Always use diagrams to illustrate different firm objectives. Clearly label the output levels for profit max (MC=MR), revenue max (MR=0), and sales max (TR=TC).
When discussing objectives beyond profit maximisation, explicitly link your reasoning to the principal-agent problem to explain the divorce of ownership from control.
In your analysis of pricing policies, always connect the firm's decision to the Price Elasticity of Demand (PED) of its consumers.
Advantages & Disadvantages
Profit Maximisation
Price Discrimination
Evaluation Starters
Essay Structure Guide
Introduction
Begin by defining the traditional profit-maximising objective (MC=MR) and briefly stating that firms often pursue other objectives due to various factors, such as the principal-agent problem or market conditions. Outline the key objectives and pricing policies you will discuss.
Conclusion
Summarise the main arguments, reiterating that firms operate with a complex set of objectives and employ diverse pricing strategies. Conclude by emphasising that while profit maximisation is a powerful theoretical tool, real-world firms often balance multiple goals, influenced by internal and external factors.
This chapter explores various government policies designed to correct market failures, such as externalities and public goods, and achieve efficient resource allocation. It also defines government failure, examining how well-intentioned interventions can lead to economic inefficiency due to factors like imperfect information and unintended consequences.
Government failure — A situation where government policies to correct market failures do not work out as planned, leading to economic inefficiency.
Government failure occurs when intervention leads to a misallocation of resources, often due to imperfect information, unintended consequences, or policy conflict. It means that the government's attempt to improve market outcomes actually makes things worse or fails to achieve its objectives, much like a doctor prescribing the wrong medicine despite good intentions.
Pigouvian tax — An indirect tax designed to internalise the externality, meaning firms pay the cost of the externalities they have caused to third parties.
This tax is ideally set equal to the marginal external cost to make producers account for the social costs of their actions, thereby moving the market towards a socially efficient output. It aims to correct market failure by making the polluter pay, similar to a factory paying a fee for every unit of pollution it releases.
Students often think a Pigouvian tax is just any tax on a polluting activity, but it is specifically designed to equal the marginal external cost to achieve allocative efficiency.
Regulations — Rules or laws set by the government that restrict or control certain activities, often to overcome market failures.
Regulations can set standards, limits, or prohibitions on production or consumption activities that generate negative externalities, such as restricting the amount of waste a company can dump or setting emission limits for vehicles. Enforcement by regulatory bodies is crucial for their effectiveness, similar to speed limits on roads reducing accidents.
When evaluating regulations, consider both their potential benefits (e.g., direct control over pollution) and their drawbacks (e.g., enforcement costs, lack of flexibility, potential for government failure).
Students often think regulations are always effective, but they can be difficult to enforce, costly to monitor, and may not be set at the optimal level.
Deregulation — The removal of regulations that act as barriers to entry for new firms seeking to enter a market.
The purpose of deregulation is to encourage competition, which can lead to greater efficiency, lower prices, and potentially force less efficient or polluting firms to exit the industry. It is often applied in industries where existing regulations are seen as stifling innovation or competition, like removing strict licensing rules for taxi companies to allow new entrants.
When discussing deregulation, ensure you explain its intended effect (increased competition, efficiency) but also acknowledge potential negative consequences if competition does not materialise or if social welfare is compromised.
Property rights — The term used to indicate how owners can use their assets.
In the context of externalities, establishing or extending property rights can create a market-based solution by allowing owners to prevent others from imposing costs on their property or to charge them for doing so. This can internalise externalities by giving individuals or firms a legal basis to negotiate or seek compensation, much like a garden owner suing a factory for pollution damage.
Students often think property rights can always be established for all resources, but it is difficult or impossible to establish property rights for common resources like air or the open sea, limiting this solution's applicability.
Pollution permits — Tradable permits provided to polluting firms that allow them to produce a given level of pollution, which can be bought and sold.
Also known as 'cap and trade' systems, these permits set a cap on total allowable pollution and then allow firms to trade permits. Firms that reduce emissions below their allowance can sell spare permits, providing an incentive for environmental efficiency and investment in cleaner technologies, similar to 'pollution coupons' that can be traded.
Students often think pollution permits are just another form of regulation, but they are a market-based solution because they create a market for the right to pollute, allowing prices to incentivise emission reductions.
When analysing pollution permits, explain both the 'cap' (government sets total limit) and 'trade' (firms buy/sell permits) aspects, and discuss how the price mechanism incentivises firms to reduce emissions.
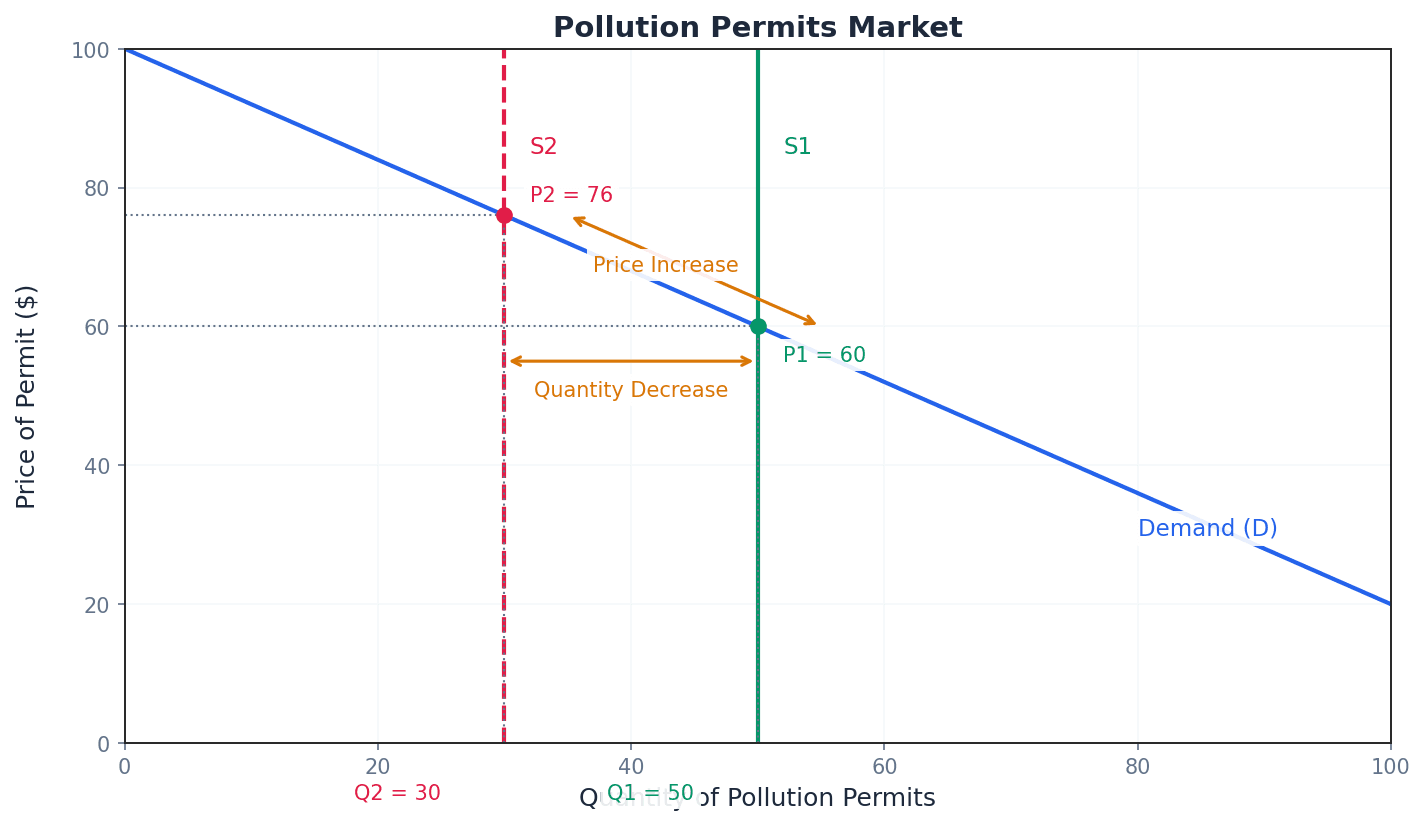
Nudge theory — A way of presenting choices in a better way to encourage people to make better decisions, without removing their freedom to choose.
Nudge theory uses behavioural insights to achieve beneficial economic and social outcomes by subtly influencing behaviour, often through the provision of information or changes in default options, rather than through regulations or taxes. It is a form of paternalism with individuals' best interests in mind, like placing healthy food at eye level in a canteen.
When discussing nudge theory, emphasise its non-coercive nature and how it works by altering the 'choice architecture' to guide individuals towards socially desirable outcomes, often alongside other policies.
Nationalisation — The process by which a government takes an industry into public ownership as a means of correcting market failure.
Nationalisation is argued to be suitable for industries not run in the public interest, especially natural monopolies or those generating significant externalities, allowing the government to manage them for wider social benefits rather than private profit. It aims to ensure provision of essential services and manage externalities more effectively, such as a government taking control of a failing railway system.
Privatisation — The process whereby there is a change of ownership from the nationalised public sector to the private sector.
Privatisation is advocated for its perceived benefits of increased efficiency, lower costs, and greater accountability to shareholders, driven by competition in the market. It aims to improve resource allocation by introducing market forces into previously state-controlled industries, for example, selling an inefficient state-owned telecommunications company to a private firm.
Governments employ a range of tools to address both negative and positive externalities. For negative externalities, such as pollution from production or consumption, policies aim to internalise the external cost. This can involve specific and ad valorem indirect taxes, regulations, property rights, or pollution permits. Conversely, for positive externalities, like those from production (e.g., R&D) or consumption (e.g., vaccines), policies seek to encourage their provision and consumption through subsidies, direct government provision, or information campaigns.
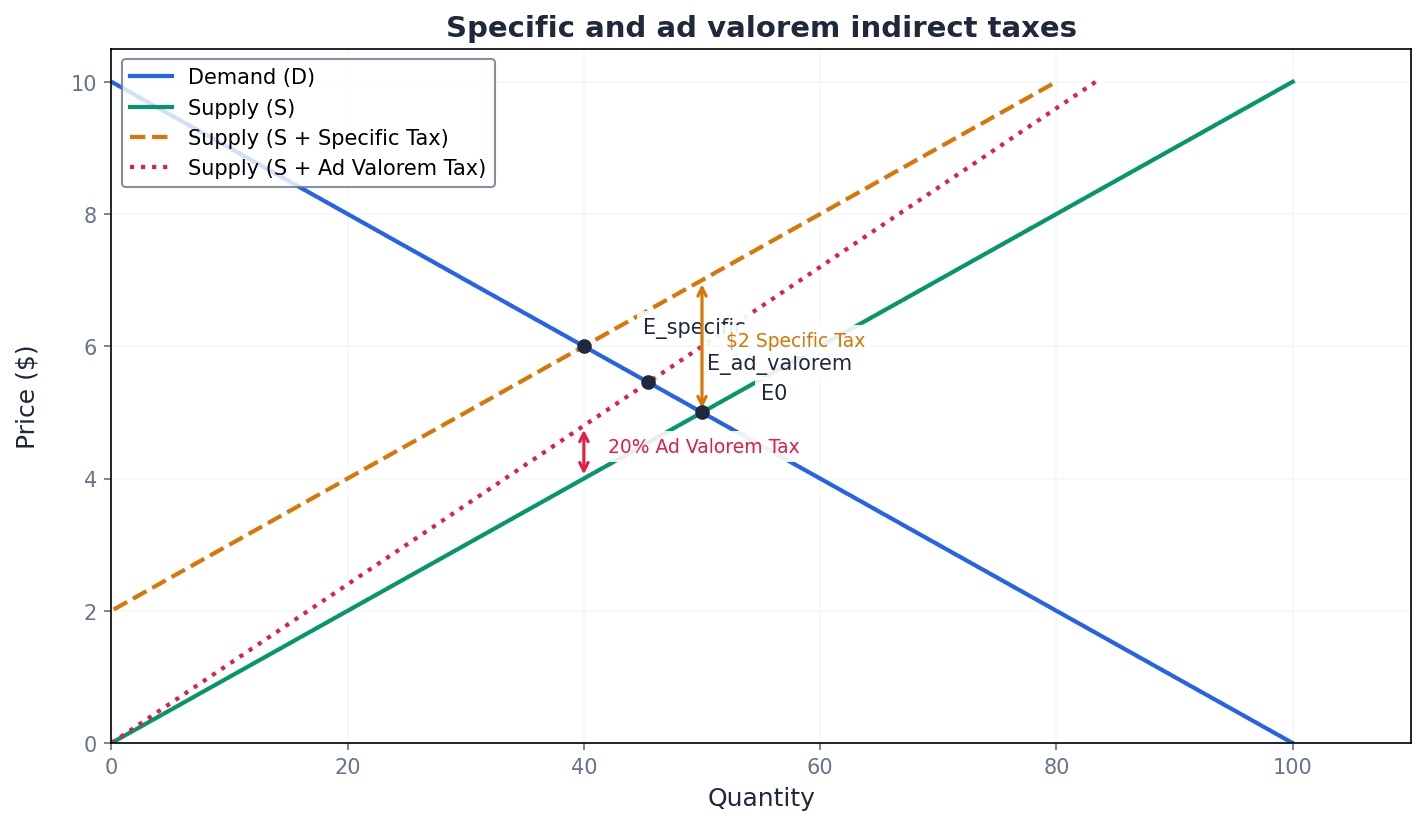
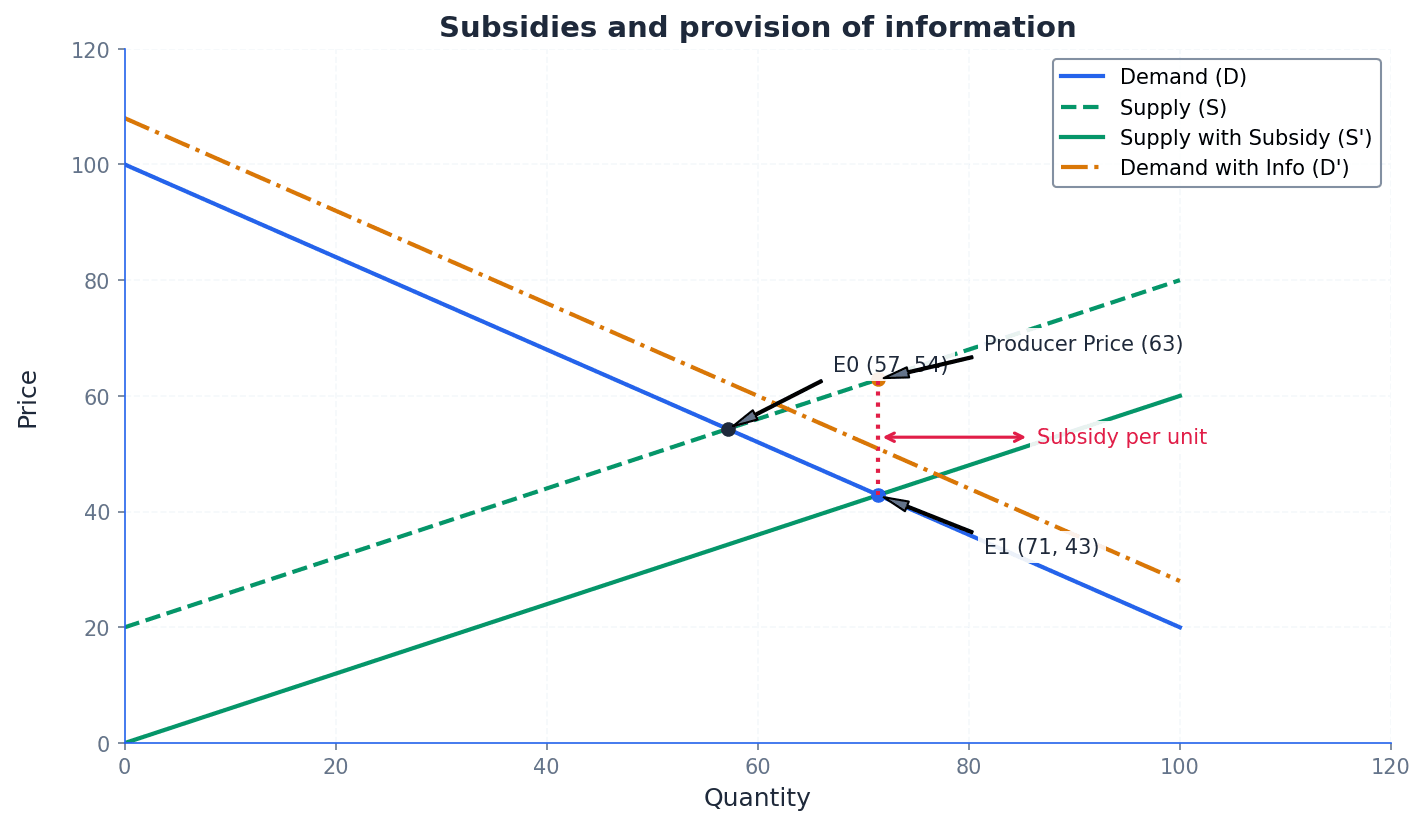

Beyond taxes and subsidies, governments use various other methods. Price controls, production quotas, prohibitions, and licences can directly influence market outcomes. The direct provision of goods and services is common for public goods, which suffer from the free-rider problem due to their non-rivalrous and non-excludable nature. Behavioural insights and 'nudge' theory offer less intrusive ways to guide choices, while nationalisation and privatisation represent fundamental shifts in ownership and control of industries to address market failures.
Government failure occurs when intervention to correct market failure leads to a misallocation of resources. This can stem from imperfect information, where governments lack accurate data to design effective policies, or from unintended consequences, which are unforeseen negative side effects of policies. Policy conflict also contributes, arising when different government objectives or policies work against each other, leading to suboptimal outcomes or increased inequality.
Imperfect information — A cause of government failure where governments have inaccurate or incomplete information, leading to the introduction of policies that result in economic inefficiency.
Governments need accurate data on costs, benefits, and demand to design effective policies. If this information is lacking or flawed, policies like taxes, subsidies, or direct provision may be set at the wrong level, leading to a misallocation of resources and failing to correct market failure efficiently, much like a chef trying to bake a cake without exact measurements.
Students often think imperfect information only affects consumers, but it is a significant cause of government failure, as policymakers also struggle to obtain complete and accurate data.
Unintended consequences — Undesirable outcomes that arise from government intervention, creating inefficiencies.
These are unforeseen side effects of policies that can undermine their effectiveness or create new problems. Examples include disincentives to work due to high benefits, or politicians avoiding unpopular but efficient policies to retain power, leading to suboptimal resource allocation, similar to accidentally breaking a pipe while trying to fix a leaky tap.
Policy conflict — A situation where different government policies, or the effects of a single policy, work against each other, leading to suboptimal outcomes or increased inequality.
This occurs when a policy designed to achieve one objective (e.g., environmental protection) negatively impacts another objective (e.g., social equality or economic growth), or when multiple policies have contradictory effects. It highlights the trade-offs inherent in policymaking, like pressing the accelerator and brake at the same time in a car.
Students often think government failure means the government did nothing, but it refers to situations where government intervention itself causes or exacerbates inefficiencies.
Always use accurately labelled diagrams (MSC/MSB/MPC/MPB) to illustrate the market failure and the impact of the policy. Clearly show the welfare loss triangle before intervention and the welfare gain after.
For any policy question, evaluate its effectiveness. Discuss the practical difficulties, such as the problem of accurately measuring and valuing the externality to set the perfect tax or subsidy.
Use government failure as your key evaluation point. Argue that even with a clear market failure, intervention may not work due to imperfect information, administrative costs, or unintended consequences.
Advantages & Disadvantages
Pigouvian Taxes
Regulations
Evaluation Starters
Essay Structure Guide
Introduction
Begin by defining market failure and government failure. Briefly state the purpose of government intervention (to achieve efficient resource allocation) and acknowledge that such intervention can sometimes lead to government failure.
Conclusion
Summarise your main arguments, reiterating that while government intervention is necessary to correct market failures, it is not without its own challenges and potential for failure. Conclude with a nuanced judgment on the overall effectiveness of government policies in achieving efficient resource allocation, perhaps suggesting that a combination of policies or careful design is often required.
This chapter explores the fundamental concepts of equity, equality, and efficiency, examining their roles in income and wealth distribution. It defines different forms of poverty and the 'poverty trap', before evaluating various government policies designed to achieve greater equity and reduce poverty.
Equity — Equity occurs if a society distributes its resources fairly among its people.
This distribution can be of income, government benefits, or wealth, ensuring everyone gets a fair share based on their hunger or dietary needs, not necessarily an equal slice. It has two aspects: horizontal equity (same circumstances, same tax) and vertical equity (fair apportionment of taxes between rich and poor).
Equality — Equality is about treating everyone in the same way.
If everyone in the pizza example got an identical slice, regardless of hunger, that would be equality. It aims to promote fairness but only works if everyone starts from the same position and needs the same help, representing the ideal of everyone being truly equal.
Students often confuse equity and equality, thinking they mean the same thing. Remember that equity means fair distribution based on circumstances or need, while equality means identical treatment.
When asked to 'explain equity', ensure you distinguish between horizontal and vertical equity and provide examples for each to achieve higher marks.
Efficiency — Efficiency is where scarce resources are being used to produce maximum output.
Think of a factory producing cars; efficiency means producing the most cars possible with the least amount of materials, time, and labor, and ensuring those cars are what customers actually want. Economic efficiency requires firms to produce at the lowest possible cost and to produce goods and services most wanted by consumers.
Students often think efficiency only means low cost, but actually it also includes producing what consumers desire most, reflecting allocative efficiency.
When discussing 'efficiency', ensure you specify whether you are referring to productive efficiency (lowest cost) or allocative efficiency (producing what consumers want) and how government intervention might impact both.
Government failure — Government failure occurs when policies used to promote efficiency do so, but also increase inequality.
Imagine a doctor prescribing a medicine that cures one illness but causes a severe side effect. This situation can arise in markets with negative production and consumption externalities, such as a road pricing charge that reduces congestion (efficiency) but is regressive, increasing inequality.
The concepts of equity, equality, and efficiency are central to understanding income and wealth distribution. While equality focuses on identical treatment, equity aims for fair distribution based on individual circumstances. Governments often face a trade-off between achieving efficiency in resource allocation and promoting equity in society, as policies designed to improve one may negatively impact the other.
Absolute poverty — Absolute poverty is defined by economists as being when household income is below a certain level that makes it impossible for a person or family to meet the basic needs of life such as food, housing, water, healthcare and education.
Living in absolute poverty is like trying to survive without a basic survival kit – no food, no shelter, no clean water, regardless of what others around you have. Those affected are unable to benefit from economic growth and rising living standards, often trapped in a cycle of poverty.
Students often think absolute poverty has a fixed global income value, but actually the specific income threshold varies from one country to another based on local costs of basic needs.
Relative poverty — Relative poverty compares the income of a household with the average income for their country, typically where this is 50% or less than the average.
Living in relative poverty is like being able to afford basic clothes and food, but not being able to participate in activities or afford items that most other people in your society consider normal, like a car or a holiday. Households in relative poverty have money for basic needs but cannot enjoy the same standard and quality of life as the rest of the population.
When discussing poverty, clearly distinguish between 'absolute' and 'relative' poverty, as the policies to address each will differ significantly and examiners look for this precision.
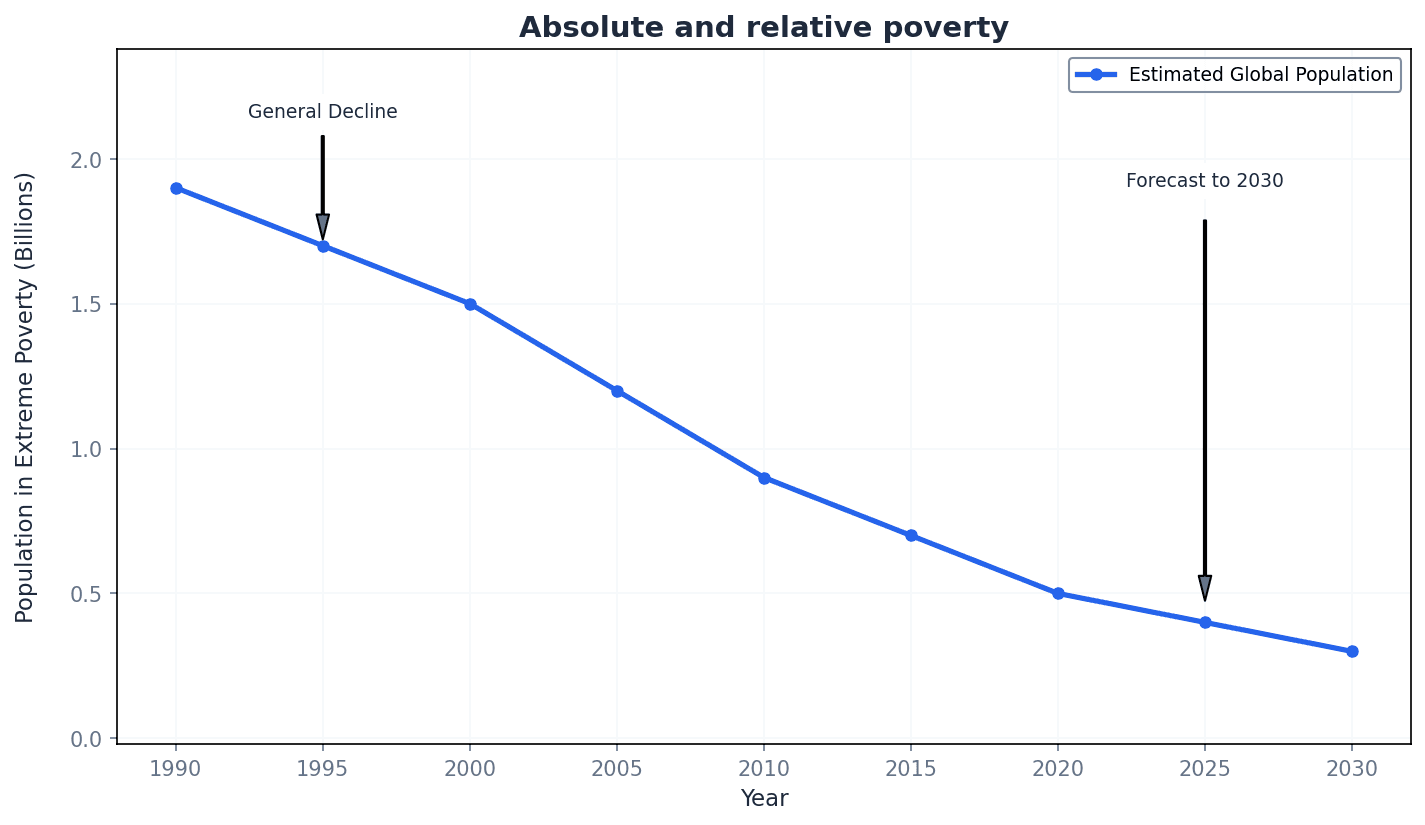
Poverty can be understood in two distinct ways: absolute and relative. Absolute poverty refers to a lack of basic necessities for survival, while relative poverty describes a situation where individuals have significantly less income than the average in their society, limiting their participation in typical living standards. Economic growth and better jobs can help households move out of relative poverty, but specific policies are needed to address both forms.
Poverty trap — The poverty trap is where a person or family is financially worse off when one or more of members are working rather than living off the range of benefits available to them.
Imagine trying to climb out of a pit, but every time you take a step up, the ground beneath you crumbles, making it harder to get out than to stay at the bottom. This situation can occur when there is a low income tax threshold paired with generous means-tested benefits up to a certain level of income, creating a disincentive to work.
Students often think the poverty trap is just about being poor, but actually it's a specific disincentive where increased earnings lead to a net financial loss due to benefit withdrawal and tax increases.
Means-tested benefits — Means-tested benefits are only paid to those on low incomes, targeted directly at those who are seen to be most in need.
It's like a charity giving food only to those who can prove they are hungry and cannot afford food themselves, rather than giving food to everyone. Examples include income support or unemployment benefit. While they target need, they can create a disincentive to work (the poverty trap) and are not always claimed by those eligible.
When evaluating means-tested benefits, always discuss the potential for the 'poverty trap' as a significant unintended consequence, explaining the mechanism of disincentive to work.
Universal benefits — Universal benefits are paid out to everyone in certain categories, often age-related, regardless of their income or wealth.
It's like a school giving a free lunch to every student, regardless of their family's income, simply because they are students. Examples include universal state pensions and child benefit. They overcome the problems of means-tested benefits (poverty trap, non-take-up) but are expensive as they pay money to many who do not need it.
Students often think universal benefits are always fair, but actually they can be seen as inefficient because they provide money to individuals who do not necessarily need it.
Universal basic income — Universal basic income is an unconditional cash payment made at regular intervals by the government, regardless of earnings or employment status.
Imagine the government giving every adult citizen a fixed monthly allowance, no questions asked, just for being a citizen. It aims to reduce poverty and income inequality while encouraging employment and recognising care roles. Critics argue it gives money to those who don't need it, depriving others.
Students often think universal basic income is only for the unemployed, but actually it is an unconditional payment to everyone, regardless of their employment status or income.
Negative income tax — Negative income tax is a system where if the tax paid on earnings is less than a fixed annual benefit, the person receives the difference from the government.
Think of it as a tax system where if you earn below a certain amount, the government effectively pays you a 'reverse tax' to bring your income up to a minimum level. It involves a flat tax rate and a fixed annual benefit, with high-income earners paying tax and low-income earners receiving a payment.
Students often think negative income tax is a separate benefit system, but actually it's an integrated tax system where low earners receive payments and high earners pay taxes within the same framework.
Governments employ various policies to address income and wealth inequality and reduce poverty. These include means-tested benefits, which target specific needs but can create disincentives to work, and universal benefits, which avoid the poverty trap but are costly. Universal Basic Income and Negative Income Tax represent alternative approaches, aiming to provide a safety net while potentially encouraging work, though each has its own set of challenges and criticisms regarding implementation and cost.
When evaluating redistribution policies, always consider the equity-efficiency trade-off. Does making income distribution fairer reduce the incentive to work?
For any policy (UBI, NIT, means-tested benefits), structure your evaluation by analysing its costs, effectiveness in targeting poverty, and impact on work incentives.
In 'discuss' or 'evaluate' questions, build a balanced argument with points for and against a policy before reaching a justified conclusion.
Advantages & Disadvantages
Means-tested benefits
Universal benefits
Evaluation Starters
Essay Structure Guide
Introduction
Begin by defining key terms relevant to the question, such as equity, equality, absolute poverty, or relative poverty. Briefly outline the scope of your essay, indicating the policies you will evaluate and the main arguments you will present regarding their effectiveness and trade-offs.
Conclusion
Summarise your main arguments, reiterating the strengths and weaknesses of the policies discussed. Provide a reasoned judgment on which policies might be most effective or under what conditions, always linking back to the question asked. Avoid introducing new information.
This chapter explores labour market dynamics, examining the derived demand for labour and its supply at various levels. It contrasts wage determination in perfect and imperfect markets, considering the impact of trade unions, government minimum wages, and monopsony employers. Finally, it explains wage differentials, transfer earnings, and economic rent.
derived demand — The demand for labour is due to a firm’s decision to produce certain goods or services, meaning labour is demanded not for its own sake but because it is essential for production.
This concept highlights that the demand for a factor of production, like labour, is dependent on the demand for the final goods or services it helps produce. For example, the demand for car mechanics is derived from the demand for cars and car repairs.
Students often think demand for labour is direct, but actually it's indirect, stemming from the demand for the output labour produces.
When asked to explain derived demand, ensure you clearly link the demand for labour to the demand for the final product or service it helps create, using examples.
marginal revenue product (MRP) — The extra revenue earned by the firm when it employs one more worker.
MRP is calculated by multiplying the marginal product of an additional worker by the price of the product. A profit-maximising firm will hire workers up to the point where the MRP equals the wage rate, as beyond this point, the additional worker adds more to costs than to revenue. Imagine a baker hiring an extra assistant: if that assistant bakes 10 more loaves of bread, and each loaf sells for 50.
Students often think MRP is just the extra output, but actually it's the extra revenue generated by that output, which includes the product's price.
Be prepared to calculate MRP from given data and use it to determine the optimal number of workers a firm should hire. Clearly state the profit-maximising condition: MRP = Wage Rate.
Wage rate — A type of price that determines the quantity of labour demanded by a firm.
A higher wage rate increases labour costs for a firm, typically leading to a fall in the quantity of labour demanded, assuming other factors remain constant. Conversely, a lower wage rate makes labour more affordable, increasing the quantity demanded. Just like the price of a product influences how much consumers buy, the wage rate influences how much labour firms are willing to 'buy' (employ).
When analysing movements along the demand curve for labour, remember that a change in the wage rate is the cause, leading to a change in the quantity of labour demanded.
The demand for labour is a derived demand, meaning it stems from the demand for the goods and services that labour produces. A firm's demand for labour is determined by the marginal revenue product (MRP) of the worker. A profit-maximising firm will employ workers up to the point where the Marginal Cost of Labour (MCL) equals the Marginal Revenue Product (MRP).
labour supply curve — A curve that mainly slopes upwards, representing the positive relationship between labour supply and the wage rate for an individual worker.
As the wage rate increases, more people are generally willing to offer their services to employers. However, beyond a certain point, individuals may prefer more leisure over additional work, even with higher wages, leading to a backward-sloping portion. Imagine offering to pay someone more for extra hours of work: initially, they'll likely agree, but past a certain point, they might say no, preferring their free time.
Students often assume all individual labour supply curves are always upward-sloping, but actually they can become backward-sloping at very high wage rates due to the income effect outweighing the substitution effect.
When drawing an individual's labour supply curve, ensure you show the initial upward slope and, if relevant, the backward-bending portion, explaining the trade-off between work and leisure.
elasticity of supply of labour — The extent to which labour supply responds to a change in the wage rate.
If labour supply is inelastic, a large change in the wage rate leads to only a small change in the quantity of labour supplied, often due to specific skills or training requirements. If it's elastic, a small wage change causes a large change in supply. Think of highly specialised surgeons (inelastic supply) versus general labourers (elastic supply).
Students often think elasticity only applies to product markets, but actually it's a fundamental concept that applies to factor markets like labour as well.
When comparing labour markets, use elasticity to explain why some occupations experience greater wage fluctuations or shortages than others in response to demand changes.
long-run supply of labour — The total number of hours that labour is able and willing to work for a particular wage rate over an extended period, influenced by wider economic factors.
This considers factors like population size, labour participation rates, tax and benefits levels, and immigration/emigration. These factors can cause the entire long-run supply curve to shift, affecting the overall availability of labour in an economy. In the short run, a country's workforce is fixed, but over decades, birth rates, retirement ages, and migration policies can significantly expand or shrink it.
Students often confuse short-run and long-run labour supply, but actually the long-run considers demographic and policy changes that alter the total pool of available workers, not just individual responses to wage changes.
When discussing long-run labour supply, focus on macro-level factors that cause shifts in the entire supply curve, rather than just movements along it due to wage changes.
Labour supply can be analysed at the individual, firm/industry, and economy-wide levels. An individual's labour supply curve typically slopes upwards but can become backward-bending at high wage rates. The elasticity of labour supply measures its responsiveness to wage changes, while the long-run supply of labour is influenced by broader demographic and policy factors.
equilibrium wage rate — The wage rate at which the quantity of labour demanded equals the quantity of labour supplied in a competitive labour market.
At this point, the market clears, meaning there is no excess demand or supply of labour. Workers receive the value of their marginal contribution to production, as the wage equals the marginal revenue product of labour. It's like the 'sweet spot' in a dating market: the wage where the number of people looking for jobs perfectly matches the number of jobs available.
Students often think the equilibrium wage is 'fair' or 'ideal', but actually it's simply the market-clearing price determined by the forces of supply and demand, which may or may not align with social equity goals.
When analysing changes in labour markets, always identify the initial and new equilibrium wage rates and employment levels, clearly explaining the shifts in demand or supply curves.
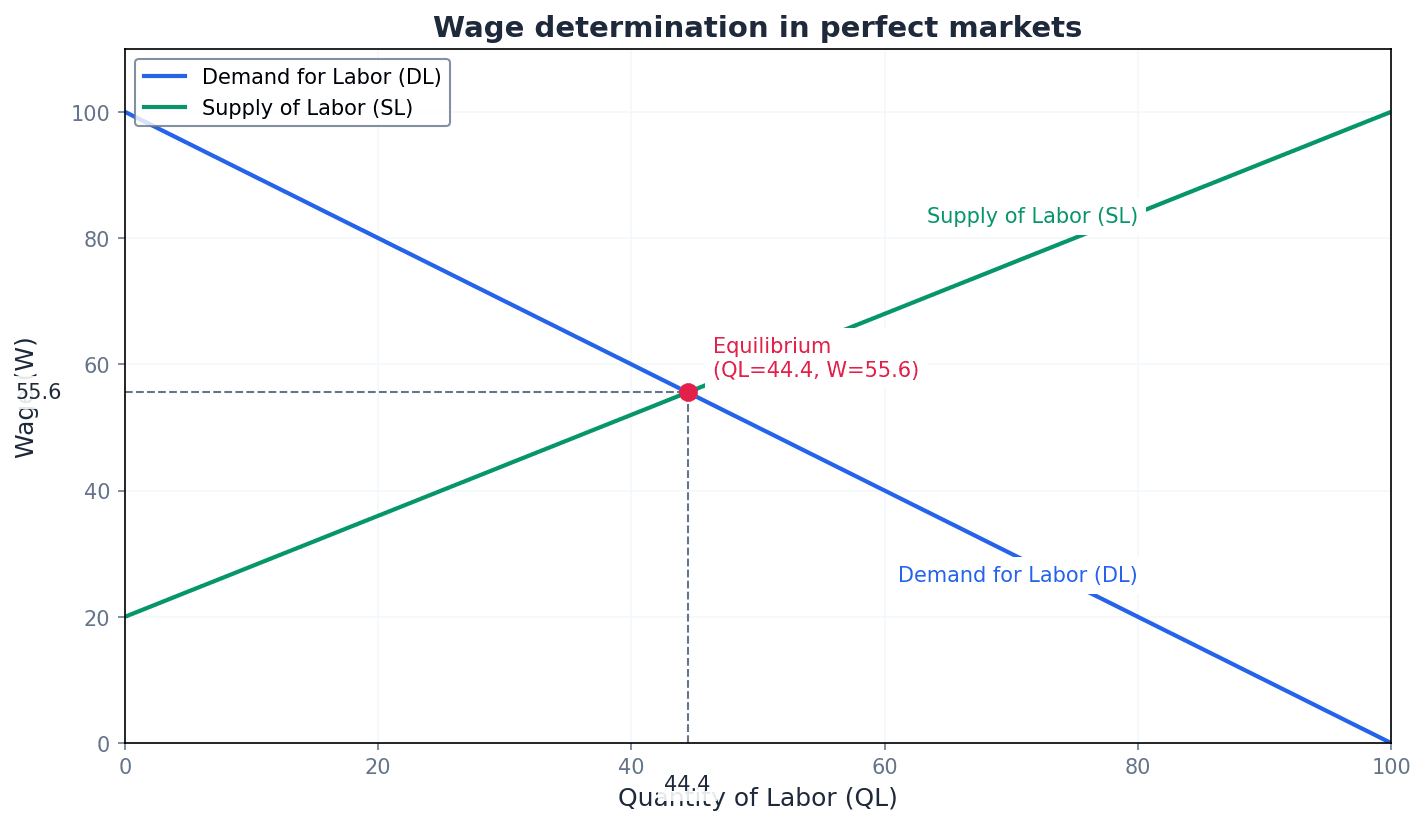
In a perfectly competitive labour market, the equilibrium wage rate and employment level are determined by the intersection of the market demand and supply curves for labour. At this equilibrium, the quantity of labour demanded by firms equals the quantity of labour supplied by workers, and there is no excess demand or supply.
trade unions — Organisations that seek to represent labour in their place of work, aiming to increase wages, improve working conditions, and protect members' interests.
Trade unions use collective bargaining to negotiate with employers on behalf of their members. In competitive markets, strong unions can push wages above the equilibrium, potentially leading to job losses or an excess supply of labour. Imagine a group of students negotiating with a teacher for a later deadline: individually, they have little power, but as a united front, they have more leverage.
Students often think trade unions always benefit all workers, but actually while they can secure higher wages for members, this might come at the cost of reduced employment or higher prices for consumers.
When evaluating the impact of trade unions, consider both the potential benefits (higher wages, better conditions) and drawbacks (potential job losses, reduced competitiveness for firms).
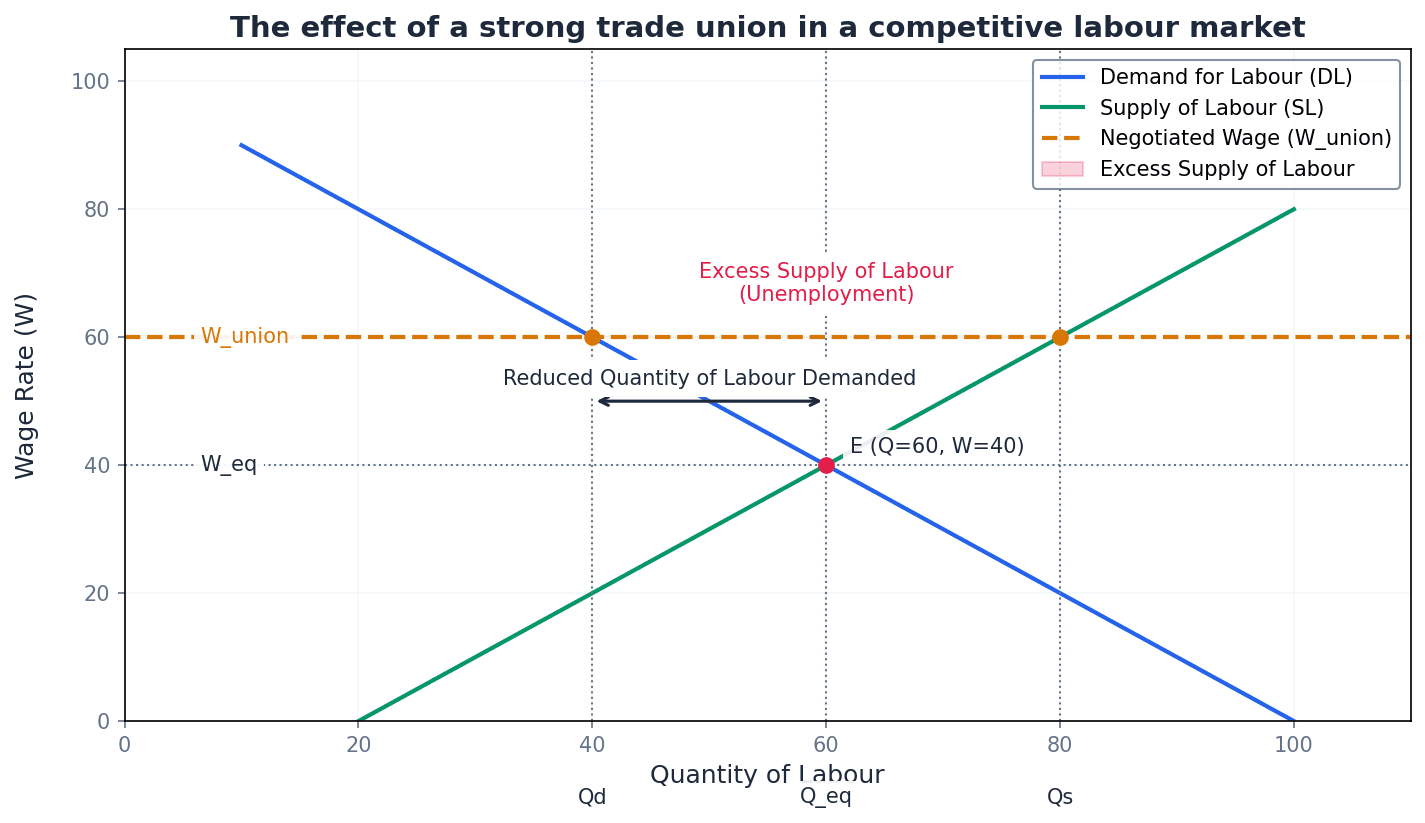
minimum wage — A government-mandated lowest hourly wage that employers are legally allowed to pay their workers.
Introduced to reduce poverty and worker exploitation, a minimum wage set above the equilibrium can lead to an excess supply of labour (unemployment) and may cause cost-push inflation. Its impact depends on the elasticities of demand and supply for labour. It's like a price floor for labour: if the floor is set above the natural market price, some people who want to sell their labour at that price won't find buyers.
Students often assume a minimum wage always helps the poor, but actually while it benefits those who retain their jobs, it can lead to job losses for others, especially in industries with elastic labour demand.
When analysing minimum wage, use demand and supply diagrams to show the impact on employment and unemployment, and discuss the importance of demand and supply elasticities.
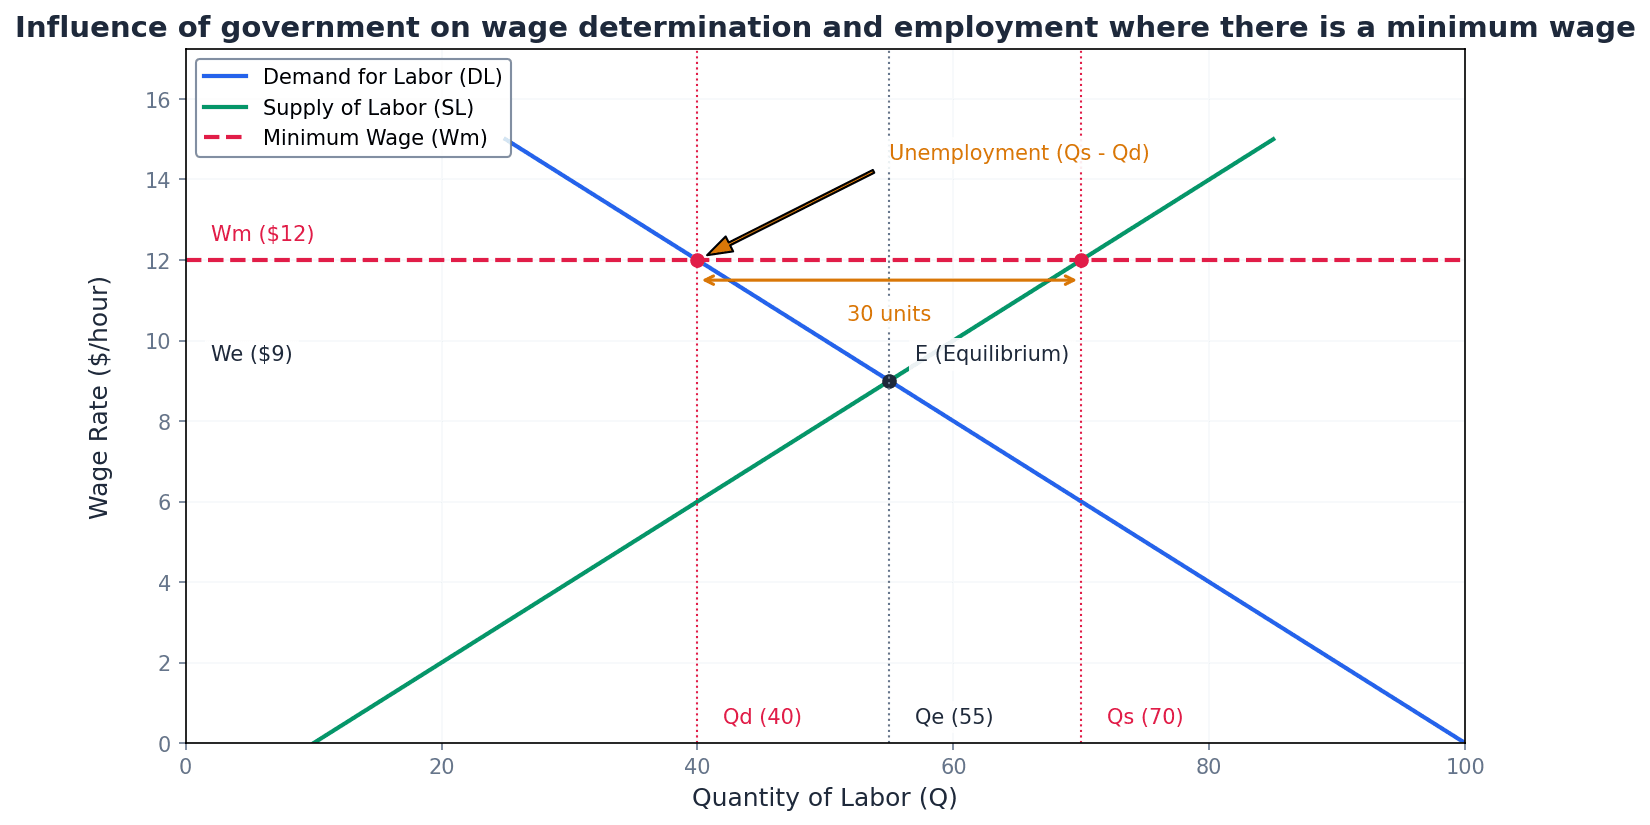
monopsony — A market situation where there is a single or dominant buyer of labour, enabling them to determine the wage paid to workers.
A monopsonist hires workers by equating the marginal cost of labour with the marginal revenue product, resulting in a wage rate and employment level that are lower than what would occur in a competitive labour market. Imagine a small town with only one major factory: that factory is the only buyer of labour, so it can dictate the wages it pays because workers have few other local options.
Students often confuse monopsony with monopoly, but actually a monopsony is a single buyer, whereas a monopoly is a single seller.
When explaining monopsony, clearly differentiate between the wage paid by the monopsonist and the wage that would be paid if workers received the full value of their marginal revenue product.
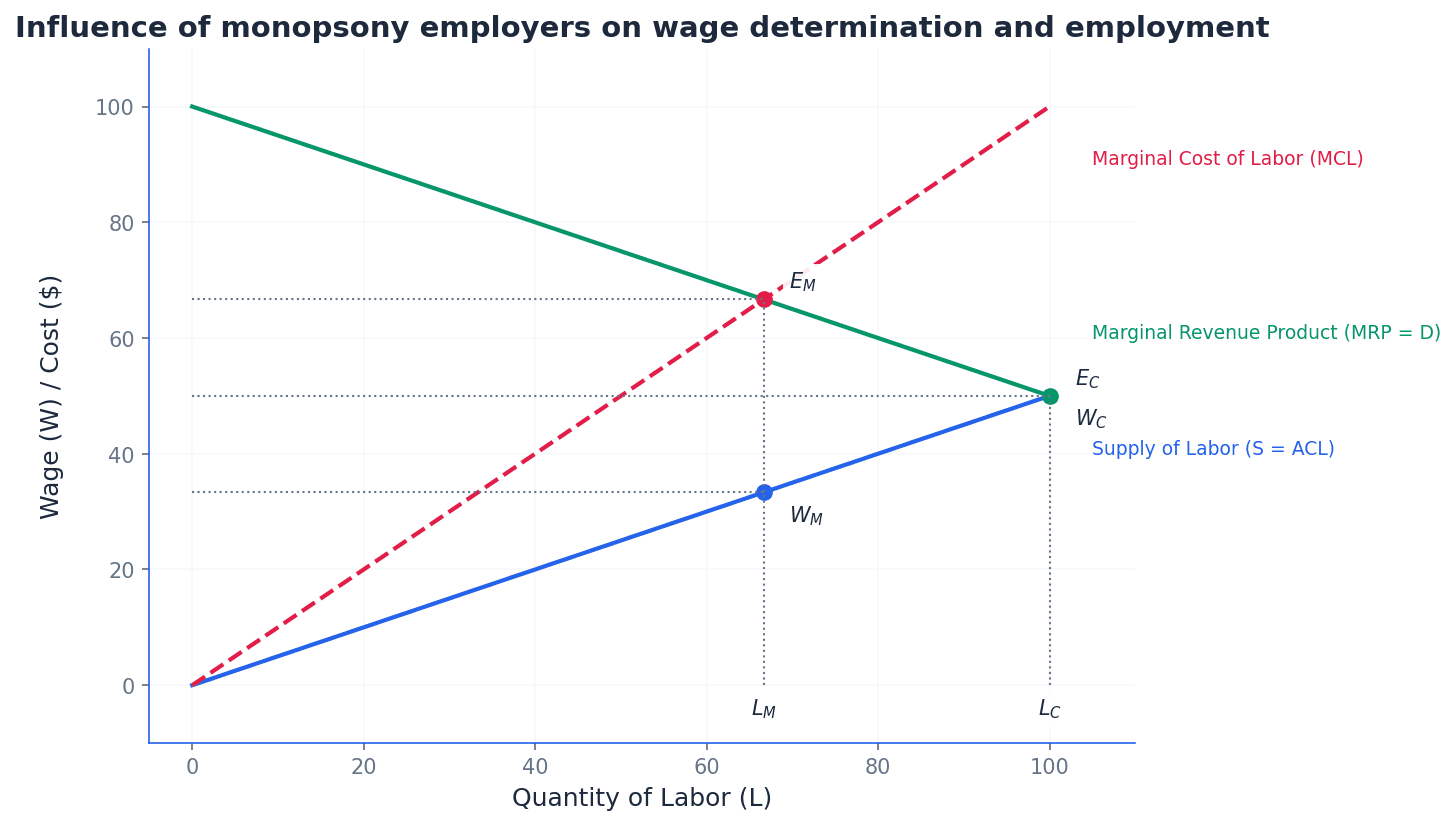
In imperfect labour markets, wage determination is influenced by factors beyond simple supply and demand. Trade unions can use collective bargaining to raise wages, potentially leading to unemployment. Governments can impose a minimum wage to protect workers, which may cause unemployment in competitive markets but can increase both wages and employment in monopsonistic markets. Monopsony employers, as single buyers of labour, can depress wages and employment below competitive levels.
transfer earnings — The minimum payment necessary to keep labour in its present use.
These are the earnings a worker could receive in their next best alternative employment. Any payment above this minimum is considered economic rent. Workers with many alternative job opportunities tend to have higher transfer earnings. If a teacher could easily become a well-paid tutor, their transfer earnings as a teacher would be high because that's the minimum needed to stop them from switching to tutoring.
Students often think transfer earnings are just the lowest possible wage, but actually it's the opportunity cost of staying in the current job, reflecting the value of the next best alternative.
When asked to explain transfer earnings, link it directly to the concept of opportunity cost and the worker's next best alternative employment.
economic rent — Any payment to labour which is over and above transfer earnings.
Economic rent represents the surplus earnings a worker receives beyond what is necessary to induce them to supply their labour to a particular occupation. Workers with unique or scarce talents often earn a high proportion of their income as economic rent. If a superstar footballer earns millions, but would still play professionally for a much lower (but still high) wage, the difference is their economic rent.
Students often confuse economic rent with 'rent' in the everyday sense (e.g., paying for an apartment), but actually in economics, it refers to a surplus payment to a factor of production.
When discussing economic rent, ensure you clearly distinguish it from transfer earnings and explain how it relates to the scarcity and uniqueness of a worker's skills or talent.
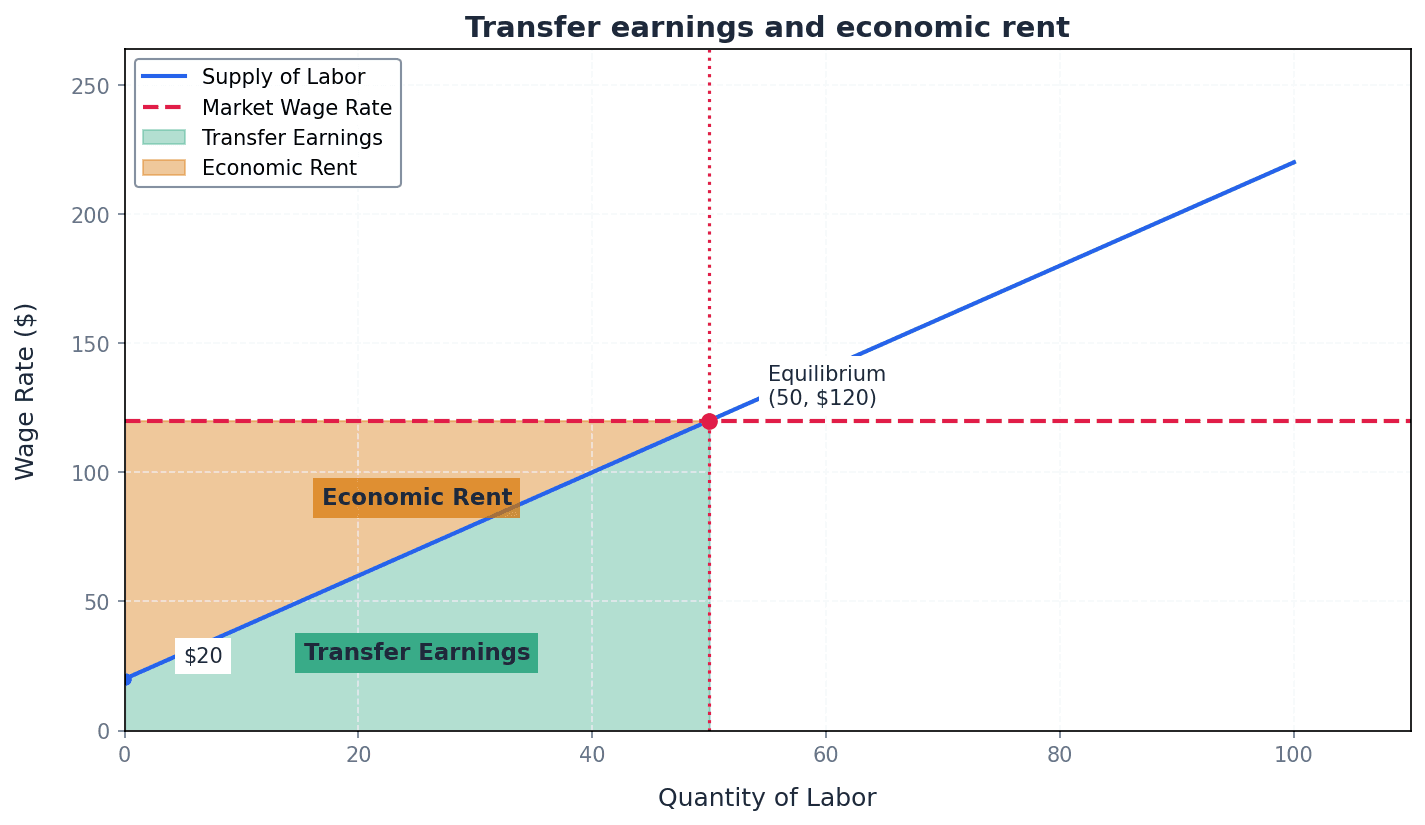
Wage differentials arise from various labour market forces, including differences in MRP, skills, and the influence of unions or government. A worker's total earnings comprise transfer earnings, which is the minimum payment required to keep them in their current job, and economic rent, which is any payment received above these transfer earnings. The proportion of economic rent is higher for workers with unique or highly demanded skills.
Always draw and correctly label diagrams for labour market questions. Key labels: Wage Rate, Quantity of Labour, D=MRP, S, MCL.
For evaluation, consider the effects of an intervention (e.g., union, minimum wage) on multiple stakeholders: employed workers, unemployed workers, firms, and consumers.
Define key terms like 'derived demand', 'monopsony', and 'MRP' precisely at the start of your answer to show understanding.
Advantages & Disadvantages
Trade Unions
Minimum Wage
Evaluation Starters
Essay Structure Guide
Introduction
Begin by defining key terms relevant to the question, such as derived demand, MRP, equilibrium wage, or the specific intervention (e.g., minimum wage, trade union). Briefly outline the scope of your essay, indicating the main arguments you will present regarding the impact of labour market forces or government intervention.
Conclusion
Summarise your main arguments, reiterating the complex interplay of labour market forces and interventions. Avoid introducing new information. Offer a final, nuanced judgment on the overall effectiveness or desirability of the interventions discussed, acknowledging the trade-offs involved and the context-specific nature of their impacts.
This chapter explores the circular flow of income, focusing on how an initial change in spending can lead to a larger final change in national income, known as the multiplier effect. It details the calculation of the multiplier in various economic models and examines the determinants of aggregate demand components. Finally, it covers how national income is determined at equilibrium and the concepts of inflationary and deflationary gaps.
multiplier — The multiplier shows the relationship between an initial change in spending and the final rise in GDP.
The multiplier effect occurs because an initial rise in expenditure creates incomes, some of which are then spent, creating further incomes. This process continues until the total increase in income is a multiple of the initial injection, and the change in injections is matched by the change in withdrawals. Imagine a ripple effect in a pond: dropping a pebble (initial spending) creates a small splash, but the ripples spread out, affecting a much larger area (final rise in GDP) than the initial splash itself.
aggregate expenditure — Aggregate expenditure is the total amount that will be spent at different levels of GDP in a given time period.
It is made up of consumption (C), investment (I), government spending (G), and net exports (X − M). Equilibrium national income occurs where aggregate expenditure equals output. Think of it as the total shopping list for an entire country. It includes everything households buy, businesses invest in, the government spends, and what foreigners buy from us minus what we buy from them.
consumption function — The consumption function indicates how much will be spent at different levels of income.
It is given by the equation C = a + bY, where 'a' is autonomous consumption (spending independent of income) and 'bY' is induced consumption (spending dependent on income), with 'b' being the marginal propensity to consume. It's like a personal spending rule: you'll always spend a certain minimum amount (autonomous consumption) even if you have no income, plus a fraction of any income you do earn (induced consumption).
savings function — The savings function indicates how much households will save at different income levels.
It is given by the equation S = –a + sY, where 'S' is saving, 's' is the marginal propensity to save, 'Y' is income, and '–a' is autonomous dissaving (the amount drawn from savings when income is zero). 'sY' is induced saving. It's like a personal saving rule: you might have to dip into savings by a certain amount (autonomous dissaving) if you have no income, but you'll save a fraction of any income you do earn (induced saving).
accelerator — The accelerator theory states that investment depends on the rate of changes in income (and therefore consumer demand), and that a change in GDP will cause a greater proportionate change in investment.
It focuses on induced investment and explains the volatility of investment. If GDP is rising at an increasing rate, investment will rise significantly; if the rate of growth slows, investment may fall, even if GDP is still growing. Imagine a car's accelerator pedal: a small push (change in GDP growth) can lead to a much larger change in speed (investment). If the car is already speeding up, even a slight increase in the rate of acceleration can require a big jump in engine power.
Multiplier (general)
Used to calculate the multiplier after an injection has occurred.
Multiplier (using marginal propensity to withdraw)
Used to estimate the multiplier in advance of a change in spending.
Multiplier (closed economy)
Applies to a two-sector economy (households and firms) with only saving as a withdrawal and investment as an injection.
Multiplier (closed economy, alternative)
Applies to a two-sector economy (households and firms) where income is either spent or saved.
Multiplier (closed economy with government sector)
Applies to a three-sector economy (households, firms, government) with saving and taxation as withdrawals, and investment and government spending as injections.
Multiplier (open economy with government sector)
Applies to a four-sector economy (households, firms, government, foreign trade) with saving, taxation, and imports as withdrawals, and investment, government spending, and exports as injections.
Marginal Propensity to Consume (mpc)
Measures the proportion of extra income that is spent.
Marginal Propensity to Save (mps)
Measures the proportion of extra income that is saved.
Marginal Rate of Tax (mrt)
Measures the proportion of extra income that is paid in tax.
Marginal Propensity to Import (mpm)
Measures the proportion of extra income that is spent on imports.
Consumption Function
Indicates how much will be spent at different levels of income.
Savings Function
Indicates how much households will save at different income levels.
The multiplier effect describes how an initial change in spending, such as an injection of investment or government spending, leads to a larger final change in national income. This occurs through successive rounds of spending and income generation. For example, an initial injection creates income for some individuals, who then spend a proportion of that income, creating further income for others, and so on. This process continues, with the total increase in income being a multiple of the initial injection, until the change in injections is matched by the change in withdrawals.
Students often think the multiplier only applies to government spending, but actually it applies to any initial change in spending, including investment or exports.
When asked to 'explain the meaning of the multiplier', ensure you describe the process of successive rounds of spending and income generation, not just state the formula. Use a numerical example to illustrate the concept clearly.
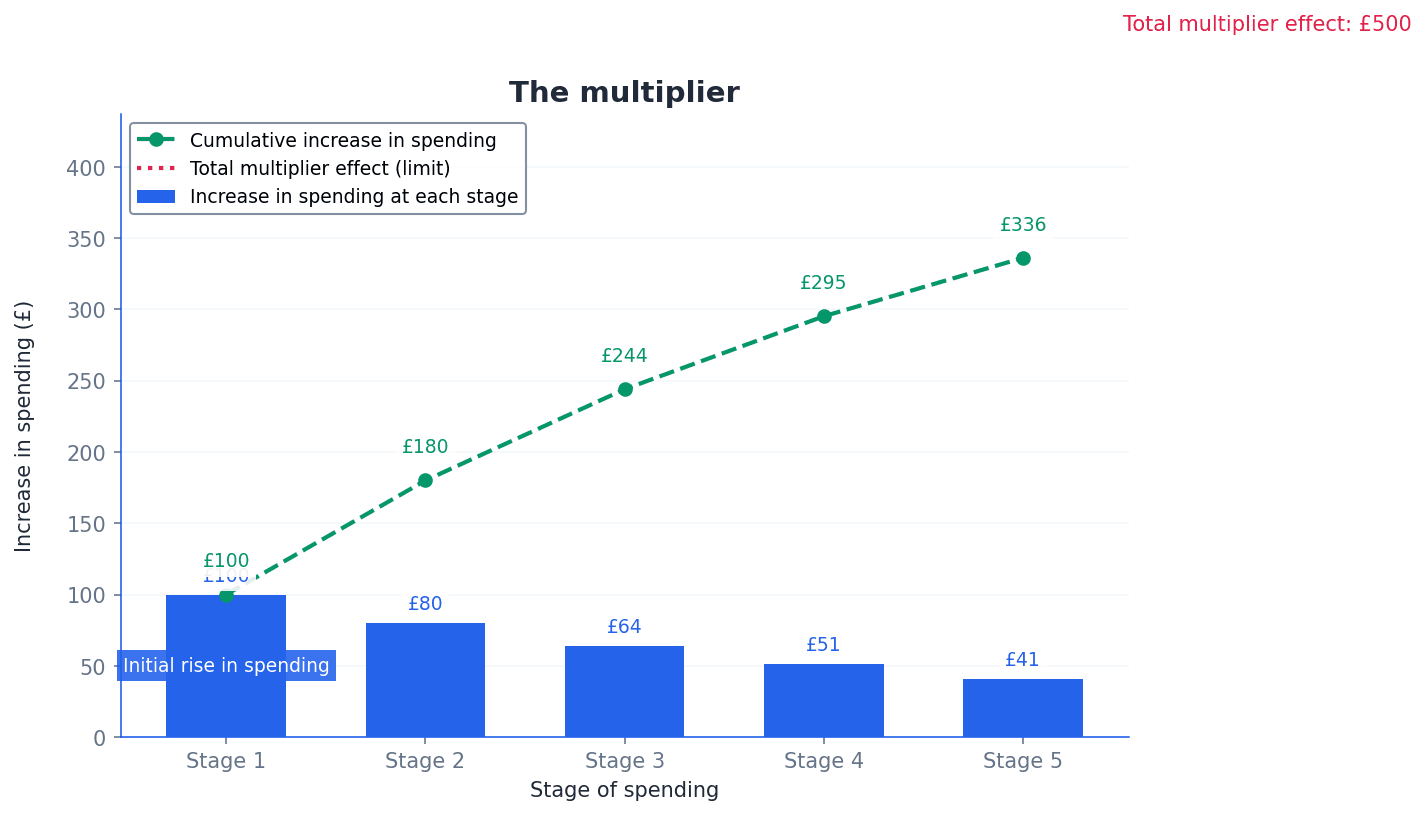
marginal propensity to save — The marginal propensity to save (mps) is the proportion of extra income that is saved.
It is calculated as the change in saving divided by the change in income. In a simple closed economy, mps + mpc = 1, as income is either spent or saved. A higher mps leads to a smaller multiplier because more income is withdrawn from the circular flow in each round. If you get an extra 20 of it into your savings account, your mps is 0.2. It's the fraction of any new money you receive that you choose not to spend immediately.
marginal propensity to consume — The marginal propensity to consume (mpc) is the proportion of extra income that is spent.
It is calculated as the change in consumption divided by the change in income. In a simple closed economy, mpc + mps = 1. A higher mpc leads to a larger multiplier because more income is re-spent in the circular flow in each round. If you get an extra 80 of it on goods and services, your mpc is 0.8. It's the fraction of any new money you receive that you choose to spend.
marginal rate of tax — The marginal rate of tax (mrt) is the proportion of extra income which is taxed.
It is also sometimes called the marginal propensity to tax. A higher mrt means a larger proportion of any additional income is withdrawn from the circular flow as tax, thereby reducing the size of the multiplier. If you earn an extra 15 of that extra income goes to the government as tax, your mrt is 0.15. It's the tax rate applied to the next dollar you earn.
marginal propensity to import — The marginal propensity to import (mpm) is the proportion of extra income that is spent on imports.
It is calculated by dividing the change in spending on imports by the change in income. A higher mpm means a larger proportion of any additional income is withdrawn from the circular flow as spending on foreign goods, thereby reducing the size of the multiplier. If your income increases by 10 of that extra income on imported goods, your mpm is 0.1. It's the fraction of any new money you receive that 'leaks' out of the domestic economy.
Students often confuse average propensities (apc, aps, apm, art) with marginal propensities (mpc, mps, mpm, mrt). Marginal propensities are used for multiplier calculations.
When calculating the multiplier, ensure you use the correct marginal propensity (mpc) or marginal propensity to withdraw (mps, mrt, mpm) based on the economic model specified in the question.
National income is determined at equilibrium where aggregate expenditure equals output. This can be analysed using aggregate demand and income approaches. The equilibrium level of national income is influenced by the components of aggregate demand and the multiplier effect. Changes in aggregate demand components, such as consumption, investment, government spending, or net exports, will lead to a multiplied change in national income.
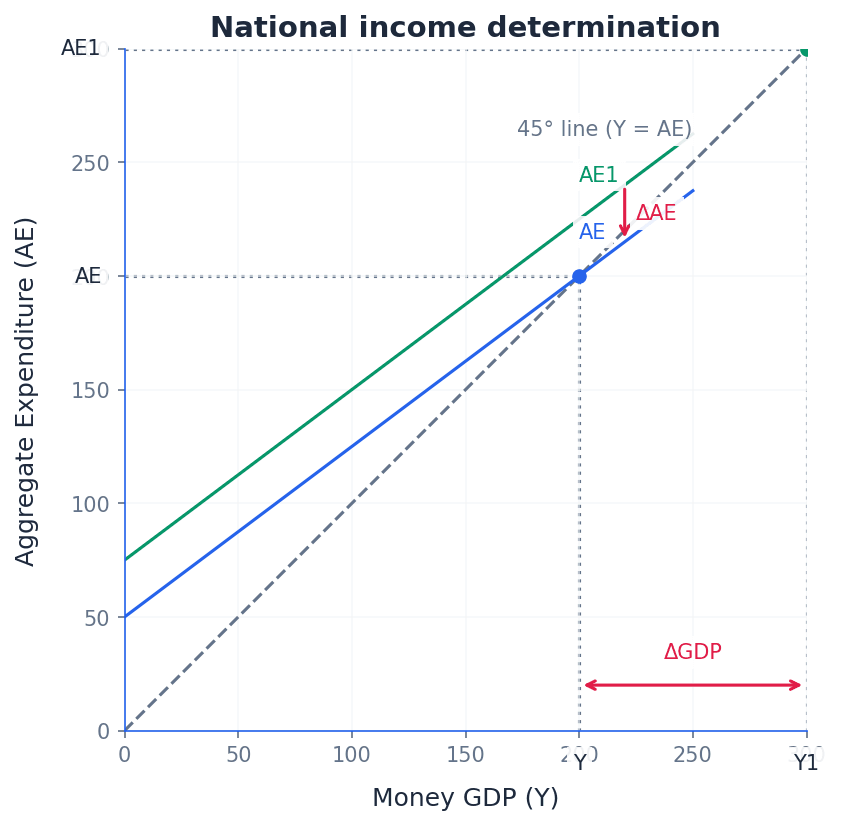
autonomous consumption — Autonomous consumption is the amount spent even when income is zero and which does not vary with income.
This spending is financed by drawing on past savings or borrowing (dissaving). It represents the basic level of consumption necessary for survival, independent of current income levels. Even if you lose your job and have no income, you still need to buy food and pay rent. That essential spending, which you cover by using savings or borrowing, is autonomous consumption.
induced consumption — Induced consumption is spending that is dependent on income.
It is represented by the 'bY' term in the consumption function (C = a + bY), where 'b' is the marginal propensity to consume and 'Y' is disposable income. As income rises, induced consumption increases. If you get a bonus at work, the extra spending you do because of that bonus – perhaps buying a new gadget or going out more – is induced consumption.
dissaving — Dissaving refers to a situation where consumption exceeds income, with people or countries drawing on past savings or borrowing.
This typically occurs when income is very low, and individuals or countries need to spend more than they earn to meet current needs. It implies a negative saving rate. If you earn 600, you are dissaving $100. You're either dipping into your savings account or borrowing money to cover the difference.
autonomous dissaving — Autonomous dissaving is how much of their savings people will draw on when their income is zero; this amount does not change as income changes.
It is represented by '-a' in the savings function (S = -a + sY) and is the negative of autonomous consumption. It signifies the need to spend beyond current income to meet basic needs when income is absent. If you have no income, you might still need to spend 100 from your existing savings. That $100 is autonomous dissaving.
induced saving — Induced saving is saving that is determined by the level of income.
It is represented by the 'sY' term in the savings function (S = -a + sY), where 's' is the marginal propensity to save and 'Y' is income. As income rises, induced saving increases. If your income increases, and you decide to save a portion of that extra income, that additional saving is induced saving.
Students often think all consumption is induced, but actually there is a component of consumption (autonomous consumption) that occurs even when income is zero, financed by dissaving or past savings.
When discussing the savings function, be prepared to explain how dissaving is represented, particularly at low income levels where autonomous consumption exceeds income.
autonomous investment — Autonomous investment is investment that is undertaken independently of changes in income.
This type of investment is influenced by factors such as business optimism, interest rates, or technological advancements, rather than current income levels. It causes a shift in the aggregate expenditure line. A company decides to build a new factory because it's very optimistic about future sales, even if current sales haven't changed yet. This decision is autonomous investment.
induced investment — Induced investment is investment that is influenced by changes in income.
If income and hence demand increases, firms are likely to buy more capital equipment to expand output. It is illustrated by a movement along the expenditure line, as it is dependent on the level of income. If a restaurant sees a huge increase in customers, it might buy more ovens and tables to keep up with demand. This investment, driven by increased income and demand, is induced investment.
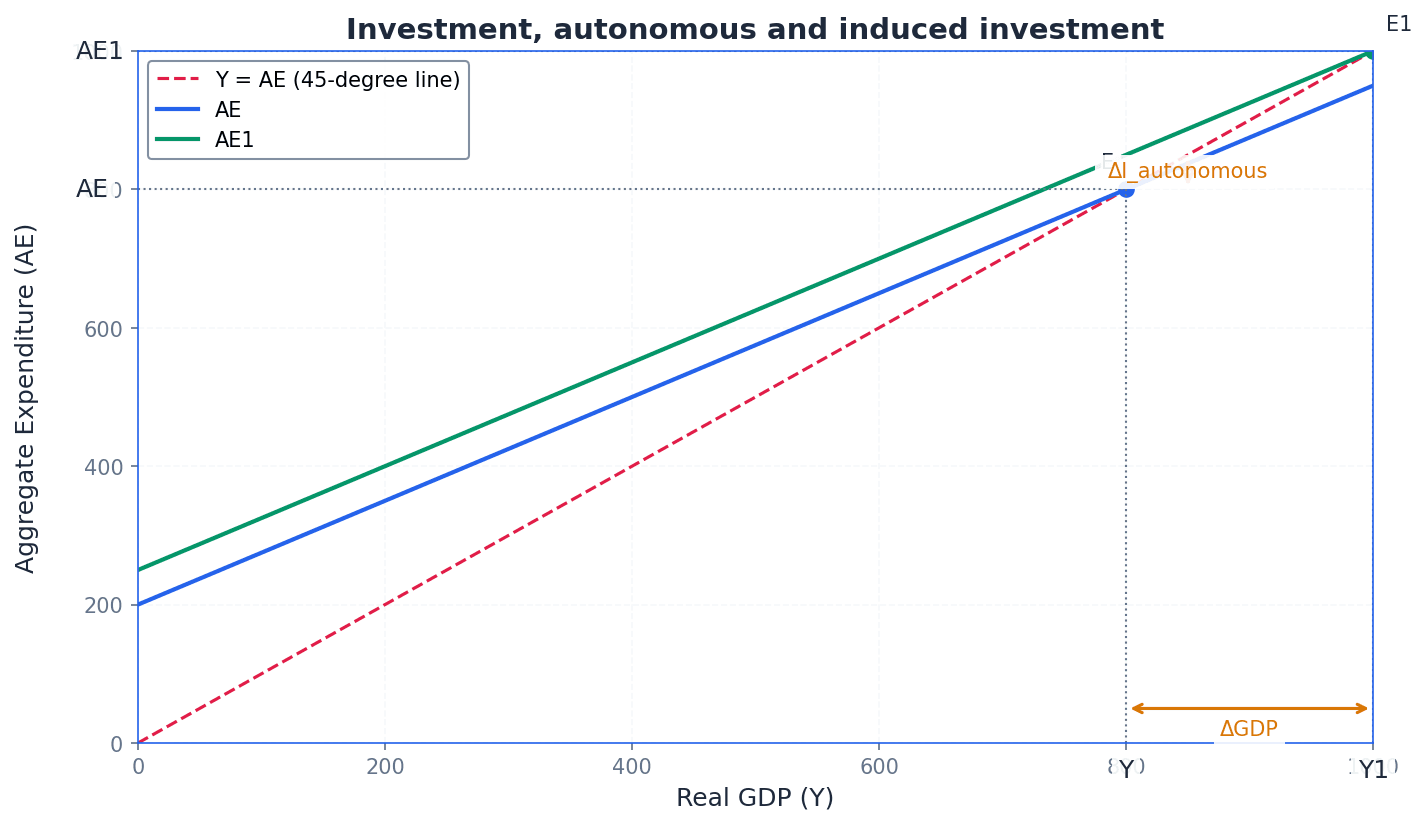
Students often think the accelerator means investment increases when GDP increases, but actually it means investment increases when the *rate of change* of GDP increases, and can fall if the rate of growth slows, even if GDP is still rising.
When discussing the accelerator, emphasize the 'rate of change' of income as the key determinant, not just the level of income. Link it to the multiplier to explain economic fluctuations.
The equilibrium level of national income may not always coincide with the full employment level of national income. An inflationary gap occurs if aggregate expenditure exceeds the potential output of the economy, leading to excess demand and rising prices. Conversely, a deflationary gap arises when aggregate expenditure is too low to achieve full employment, resulting in unused resources and unemployment. Understanding these gaps is crucial for analysing macroeconomic stability and policy interventions.
inflationary gap — An inflationary gap will occur if aggregate expenditure exceeds the potential output of the economy.
In this situation, not all demand can be met due to insufficient resources, leading to excess demand that drives up the price level. It represents an economy operating beyond its full employment potential in the short run. Imagine a small bakery that can only make 100 loaves of bread a day. If 150 people want to buy bread, the bakery can't meet all the demand, so the price of bread will go up. The extra 50 loaves of demand represent the inflationary gap.
deflationary gap — A deflationary gap occurs when aggregate expenditure is too low to achieve full employment.
In this case, the equilibrium level of GDP is below the full employment level, indicating unused resources and unemployment. The Keynesian solution often involves increased government spending to boost aggregate expenditure. Imagine a factory that can produce 1000 cars a month, but only 700 cars are being bought. The factory will produce less, lay off workers, and have spare capacity. The difference of 300 cars represents the deflationary gap.
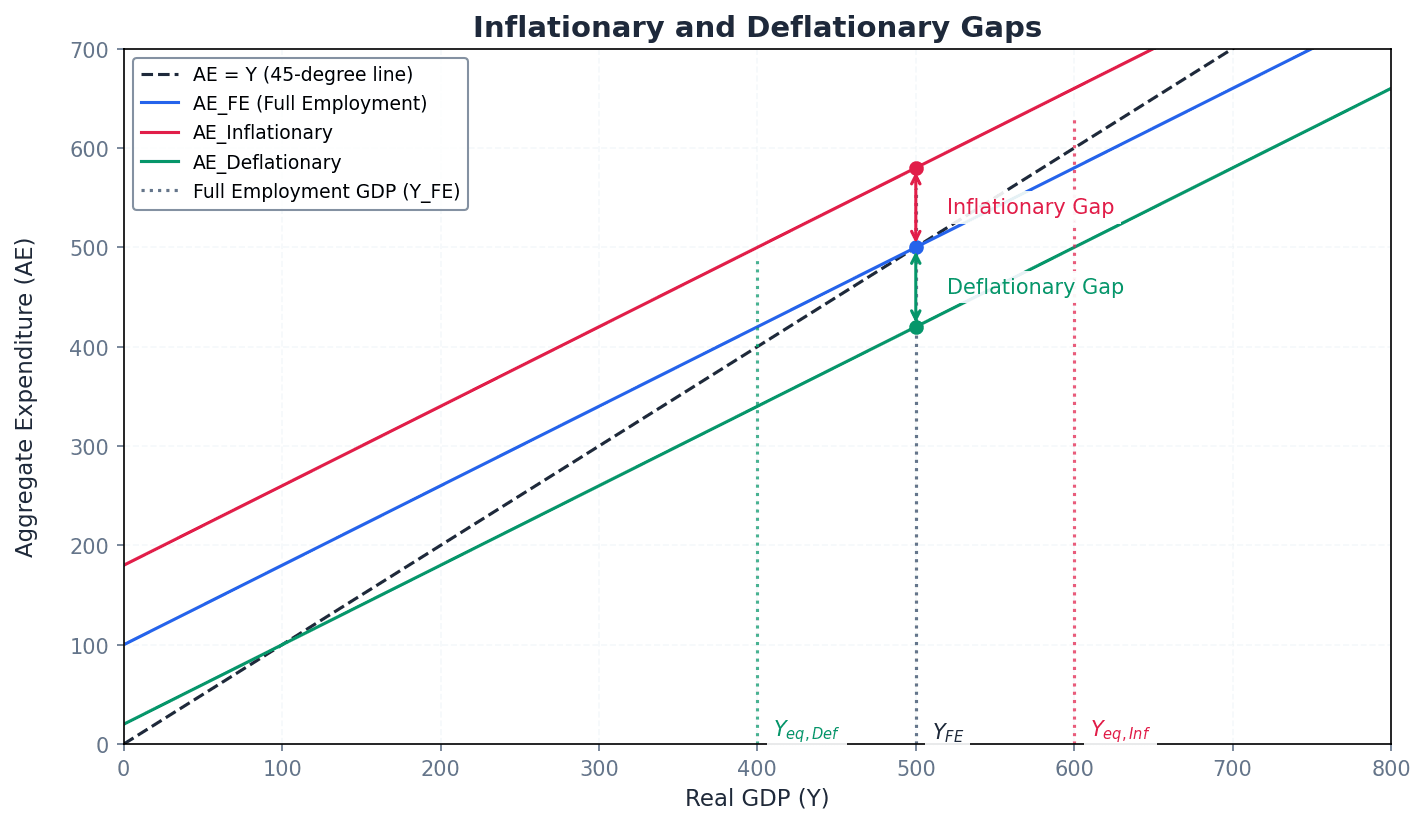
Students often think an inflationary gap means inflation is simply present, but actually it specifically refers to a situation where aggregate expenditure is *above* the full employment level of output, causing demand-pull inflation.
Students often think a deflationary gap means prices are falling, but actually it means there is insufficient aggregate demand to reach full employment, which can lead to falling prices or persistent unemployment.
When drawing Keynesian cross diagrams, clearly label the 45-degree line as Y=AE and show how an initial vertical shift in the AE curve (the injection) causes a larger horizontal change along the x-axis (the change in income).
When asked to calculate a change in national income, first calculate the multiplier (k), then multiply it by the initial change in the injection (ΔY = k * ΔJ).
Always state the multiplier formula you are using before substituting numbers. This can earn you method marks even if your final calculation is wrong.
Advantages & Disadvantages
Government spending to close a deflationary gap
The multiplier effect in an open economy
Evaluation Starters
Essay Structure Guide
Introduction
Begin by defining the circular flow of income and the multiplier effect. Briefly state the main components of aggregate demand and how they interact to determine national income. Outline the scope of your essay, for example, by mentioning the different economic models (closed, open, with government) and the concepts of inflationary/deflationary gaps.
Conclusion
Summarise the key findings regarding the determination of national income and the significance of the multiplier effect. Reiterate the challenges faced by policymakers in managing aggregate demand to achieve full employment and price stability. Offer a final thought on the dynamic nature of the circular flow and the interplay of various economic factors.
This chapter explores economic growth, differentiating between actual and potential growth, and analysing output gaps and the business cycle. It evaluates policies to promote growth, including inclusive and sustainable approaches, and discusses their impact on equity, equality, and the environment.
Actual economic growth — Actual economic growth occurs when output increases, sometimes referred to as short run economic growth.
This can be achieved by greater utilisation of existing resources or by using more resources. It is often shown as a movement towards the PPC or an increase in real GDP on an AD/AS diagram when there is spare capacity. Imagine a factory that has machines sitting idle. Actual economic growth is like turning on those idle machines to produce more goods with the existing factory setup.
Students often think actual economic growth means the economy's capacity has grown, but it refers to using existing capacity more fully or using more resources, not necessarily an increase in the maximum potential output.
Potential economic growth — Potential economic growth is an increase in the maximum output the economy is capable of producing, sometimes called long-run economic growth.
This involves an increase in the quantity or quality of resources, or improvements in technology, shifting the PPC outwards or the LRAS curve to the right. For this to lead to higher output, the rise in productive potential must be utilised. If actual economic growth is turning on idle machines, potential economic growth is like building a bigger, more efficient factory or inventing new, faster machines, increasing the total possible output.
When asked to 'explain actual economic growth', ensure you distinguish it from potential growth and use diagrams (PPC or AD/AS) to illustrate the concept, clearly labelling the axes and shifts/movements.
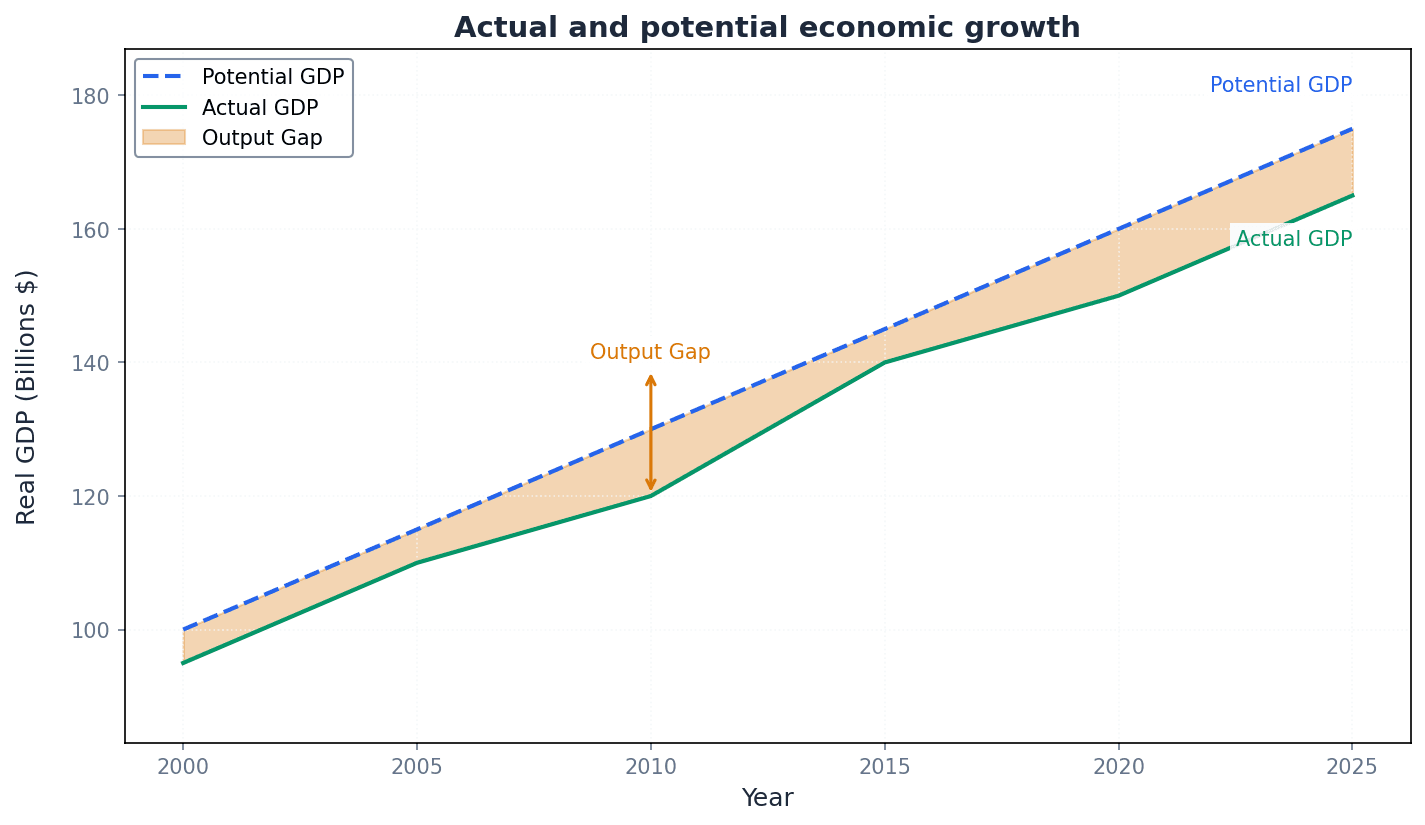
Output gap — The output gap is the difference between actual and potential output.
A negative output gap indicates unemployed resources and output below potential, while a positive output gap occurs when output temporarily exceeds maximum potential due to high aggregate demand. Think of a car's speedometer. The maximum speed it can reach is its potential output. If you're driving at 60 mph but the car can go 100 mph, there's a negative output gap. If you temporarily push it to 110 mph (beyond its sustainable limit), that's a positive output gap.
Negative output gap — A negative output gap is caused by a lack of aggregate demand, resulting in unemployed resources and actual output being below the economy's full potential.
When there is a negative output gap, the economy is not producing the full amount it is capable of producing, leading to unemployment and underutilised capacity. This typically occurs during a downturn or trough in the business cycle. It's like a restaurant with many empty tables and staff waiting around because not enough customers are coming in. They have the capacity to serve more, but demand is too low.
Students often confuse a negative output gap with negative economic growth, but it means output is below potential, even if it's still growing, just not fast enough.
Positive output gap — A positive output gap occurs when an economy is producing more than its maximum potential.
This can happen temporarily due to high aggregate demand, where machinery is worked continuously and workers do long hours of overtime. However, it is unsustainable as machines require maintenance and workers need rest, leading to inflationary pressures. This is like a factory running 24/7 without maintenance and workers doing triple shifts. Production is very high for a short time, but it's not sustainable and will eventually lead to breakdowns and burnout.
Students often think a positive output gap is always good, but it is unsustainable and can lead to inflation and resource depletion, as machines are overworked and workers work excessive overtime.
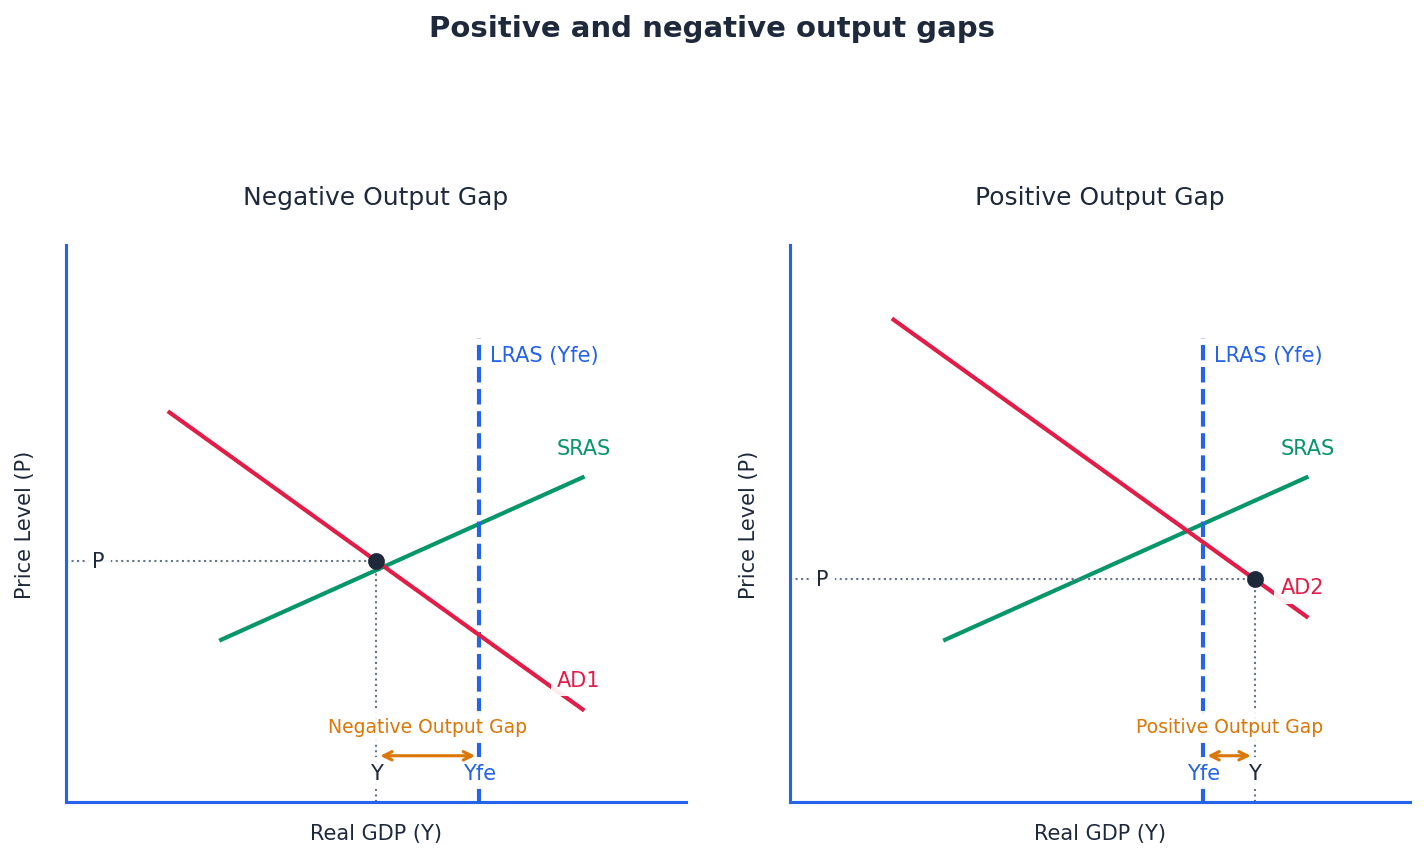
When discussing 'changes in economic activity', always refer to output gaps to explain whether the economy is operating above or below its full capacity, and link this to inflationary or deflationary pressures.
Business cycle — Fluctuations in the growth of actual output around the trend growth in productive potential are known as the business cycle.
Also referred to as the trade cycle or economic cycle, it typically comprises four phases: upturn, peak, downturn, and trough, reflecting periods of faster or slower economic growth. Think of a rollercoaster ride. It goes up (upturn), reaches a high point (peak), goes down (downturn), and hits a low point (trough), but over time, the track itself is generally rising (trend growth).
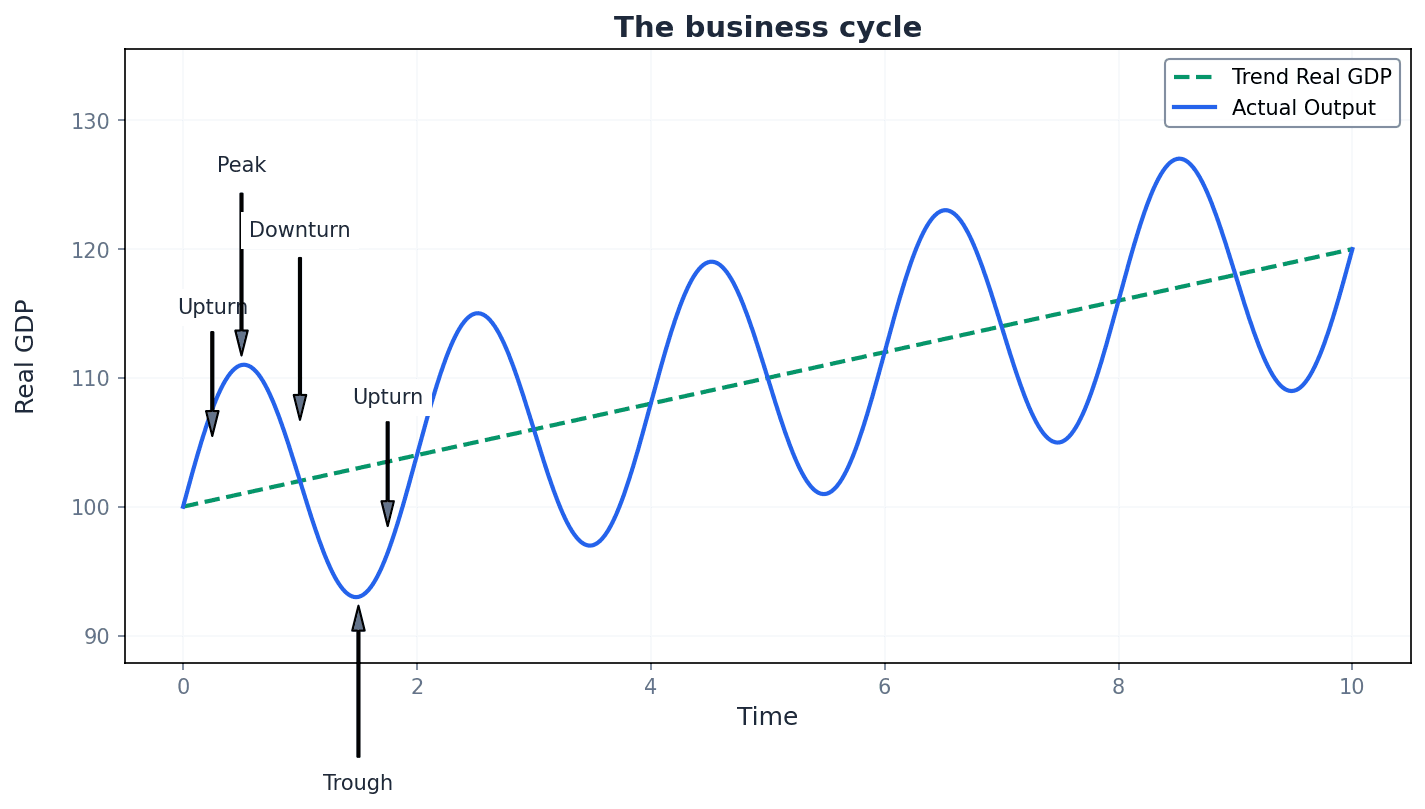
Upturn — The upturn is a phase of the business cycle during which the economy is growing at a faster rate, also called expansion.
During this phase, households and firms are optimistic, consumption and investment rise, and employment is likely to increase. Rapid growth in this period can be described as an economic boom. It's like a car accelerating after a stop sign. The speed is increasing, and everything feels positive and moving forward.
Peak — The peak is the top point of the business cycle and a turning point, where the economy experiences a positive output gap.
At the peak, aggregate demand is high, which is likely to result in inflation and balance of payments difficulties. It marks the end of the expansion phase and the beginning of a downturn. This is the very top of the rollercoaster ride, just before it starts to descend. Everything is at its highest, but it can't go any higher.
Downturn — During the downturn phase of the business cycle, the economic growth rate decreases, and negative economic growth may occur.
Households and firms become less optimistic, saving rises, high-risk firms may fail, and net investment falls. This phase leads towards the trough. This is the part of the rollercoaster where it starts to go down. The excitement fades, and things begin to slow or decline.
Trough — The trough is the lowest point of the trade cycle, where the economy experiences a lack of aggregate demand and a negative output gap.
At this point, an economy may experience a recession or, more seriously, a depression, characterised by high unemployment and underutilised resources. This is the very bottom of the rollercoaster ride, where it pauses before starting to climb again. It's the lowest point of activity.
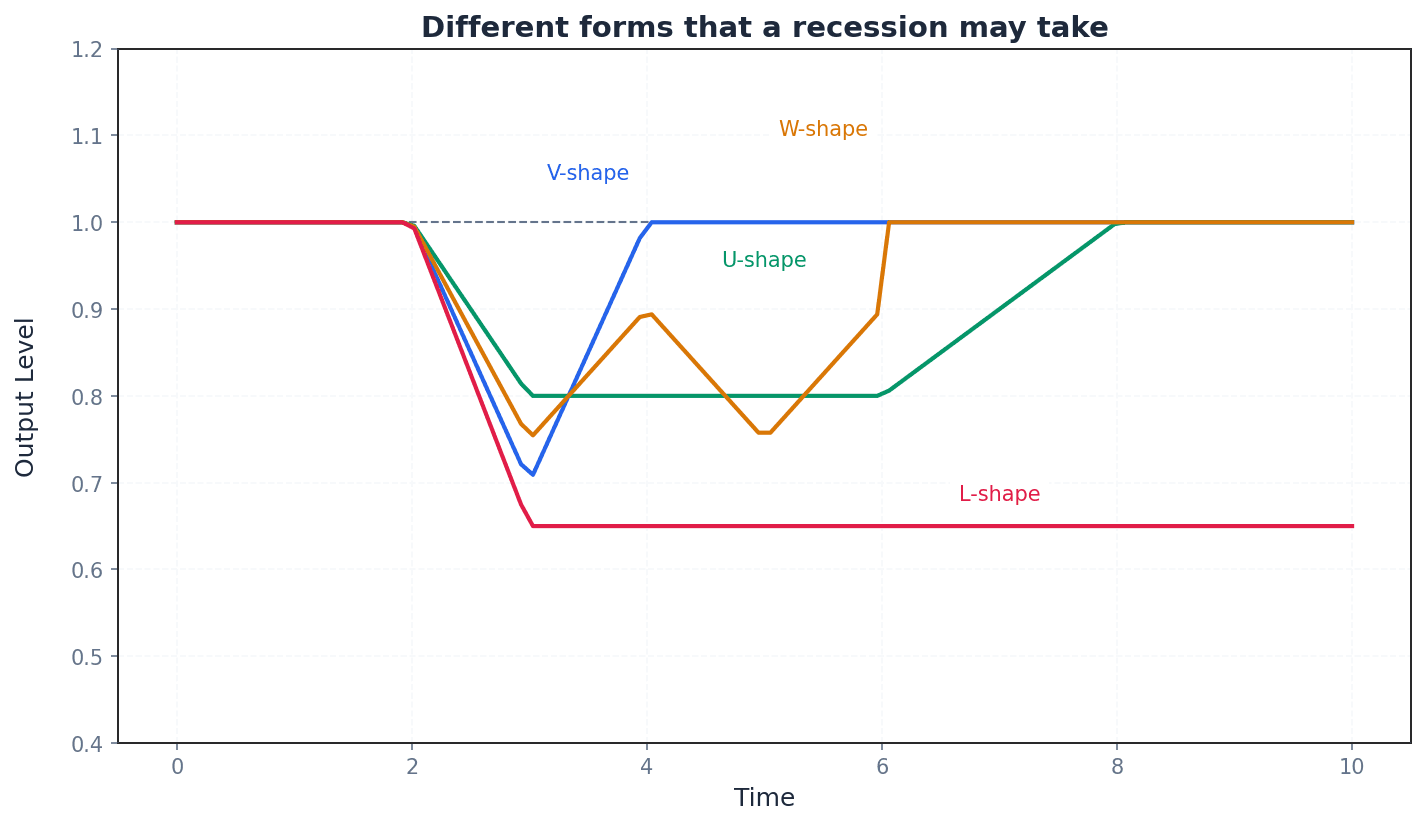
When asked to 'describe the phases of the business cycle', ensure you clearly define each phase and link it to changes in economic indicators like consumption, investment, employment, and inflation.
Automatic stabilisers — Automatic stabilisers are forms of government spending and taxation that reduce the rise in GDP during an economic boom and reduce the fall in GDP during a recession.
They work by reducing the growth in aggregate demand during an upturn and increasing aggregate demand during a downturn, thereby flattening out the business cycle without explicit government intervention. Think of cruise control in a car. It automatically adjusts the engine power to maintain a steady speed, smoothing out the bumps and hills on the road, just as stabilisers smooth out economic fluctuations.
Students often think automatic stabilisers are active government policies, but they are pre-existing government programs (like progressive taxes and welfare benefits) that automatically adjust with economic activity.
Policies to promote economic growth can include expansionary fiscal and monetary policies, particularly effective in addressing negative output gaps by stimulating aggregate demand. Supply-side policies, which focus on increasing the quantity or quality of resources and improving technology, are crucial for promoting potential economic growth by shifting the LRAS curve to the right.
When analysing 'policies to promote potential economic growth', focus on supply-side policies that increase productive capacity and use diagrams to show the outward shift of the PPC or the rightward shift of the LRAS curve.
Inclusive economic growth — Inclusive economic growth is economic growth that is distributed fairly across society and creates opportunities for all.
This means everyone benefits from economic growth in both monetary (income) and non-monetary (healthcare, working conditions) terms, and has access to job opportunities and a safe living environment. Imagine a rising tide that lifts all boats, not just the yachts. Inclusive growth ensures that everyone, from small fishing boats to large ships, benefits from the economic 'tide'.
Students often think economic growth automatically leads to inclusive growth, but growth can often exacerbate inequality if not accompanied by specific policies to ensure fair distribution and opportunities.
While economic growth can raise overall living standards, it does not automatically guarantee equitable distribution of benefits. Without specific policies, growth can widen income disparities and limit opportunities for certain segments of society, impacting equity and equality. Policies to promote inclusive growth aim to mitigate these negative impacts.
When analysing 'policies to promote inclusive economic growth', provide specific examples like progressive taxes, improved education access, and anti-discrimination legislation, explaining how each addresses equity and equality.
Sustainable economic growth — Sustainable economic growth is economic growth that can continue over time, requiring a deliberate effort to balance economic, social, and environmental objectives.
This ensures that current generations can meet their needs without compromising the ability of future generations to meet their own needs, by conserving resources and mitigating environmental damage. It's like managing a forest: you can cut down trees for timber (economic growth), but you must also replant them and protect the ecosystem to ensure the forest can continue to provide timber and other benefits for future generations.
Students often think sustainable economic growth means no growth, but it means growth that is environmentally and socially responsible, allowing for long-term progress.
Sustainable economic growth involves a critical trade-off between using resources for immediate economic benefit and conserving them for future generations. This balance is essential to ensure long-term prosperity without depleting natural capital or causing irreversible environmental harm. The challenge lies in finding ways to grow economically while simultaneously protecting the environment.
Economic growth, particularly when driven by industrialisation and consumption, can have significant negative impacts on the environment, including increased pollution, resource depletion, and contributions to climate change. Issues like rising sea levels, which put regions such as St Kitts and Nevis at risk, are direct consequences of unsustainable growth patterns. Mitigating these impacts requires deliberate policy interventions.
Polluter pays principle — The polluter pays principle is an economic principle where firms that create pollution are taxed, turning external costs into private costs.
This principle aims to internalise the external costs of pollution, moving a market closer to its socially optimum level of output. The finance raised can also be used to compensate those who have suffered from pollution. If you spill a drink in a restaurant, you're expected to pay for the clean-up. Similarly, if a factory pollutes, it should pay for the environmental damage it causes.
When evaluating 'policies to achieve sustainable economic growth', discuss the trade-offs between using resources for short-term growth and conserving them for long-term sustainability, considering both economic and environmental impacts.
When evaluating growth policies, always consider the potential conflicts and trade-offs, such as growth vs. sustainability or growth vs. equity.
Advantages & Disadvantages
Policies to promote actual economic growth (e.g., expansionary fiscal/monetary policy)
Policies to promote potential economic growth (e.g., supply-side policies)
Evaluation Starters
Essay Structure Guide
Introduction
Begin by defining the key terms in the question, such as 'economic growth', 'inclusive growth', or 'sustainable growth', and briefly outline the scope of your argument, stating the main points you will cover.
Conclusion
Summarise your main arguments, re-emphasise the key trade-offs and complexities, and offer a final reasoned judgment or recommendation based on your analysis, avoiding new information.
This chapter explores the concepts of employment and unemployment, distinguishing between various forms such as equilibrium and disequilibrium, and voluntary and involuntary unemployment. It defines full employment and the natural rate of unemployment, examining factors affecting labour mobility and evaluating policies designed to reduce unemployment.
Full employment — Full employment is the highest level of employment possible.
It is often considered to be achieved when the unemployment rate falls to 3%, not 0%, because some people are always in between jobs. An economy operating with full employment is productively efficient and on its production possibility curve. Imagine a busy restaurant where all tables are usually full, but there's always a brief moment when one table clears before new customers arrive. That brief gap is like the unavoidable unemployment even at 'full' capacity.
Students often think full employment means 0% unemployment, but actually it means the lowest sustainable unemployment rate, accounting for frictional and structural unemployment.
Equilibrium unemployment — Equilibrium unemployment is unemployment which exists when the aggregate demand for labour equals the aggregate supply of labour.
At this point, there is no pressure for the real wage rate to change, and those willing and able to work at the current wage rate have a job. However, some people are still unemployed because they are unwilling to accept current wages, lack information, skills, or geographical mobility. Think of a market for apples where the number of apples buyers want at a certain price equals the number sellers offer. Even so, some people might not buy apples because they want a different type, don't know where to find them, or can't afford the current price.
Students often think equilibrium unemployment means everyone who wants a job has one, but actually it means the market is clearing at the prevailing wage, but some people are still voluntarily or frictionally unemployed.
When drawing diagrams for equilibrium unemployment, ensure you include the Aggregate Labour Force (ALF) curve in addition to ADL and ASL to clearly show the gap representing unemployment.
Disequilibrium unemployment — Disequilibrium unemployment arises from the aggregate supply of labour exceeding the aggregate demand for labour.
This type of unemployment is equivalent to cyclical unemployment and occurs when the wage rate stays above the equilibrium level, often due to factors like workers resisting wage cuts, trade union action, or national minimum wage legislation. It can last for long periods. Imagine a concert ticket market where the price is set too high. Many people want to sell their tickets (supply), but fewer people are willing to buy at that high price (demand), leading to unsold tickets (unemployment).
Students often think disequilibrium unemployment is always short-term, but actually it can persist for long periods if wages are sticky downwards or if a wage reduction further depresses aggregate demand.
Voluntary unemployment — Voluntary unemployment occurs when workers choose not to accept jobs at the current wage rate.
These individuals could be employed but prefer to remain unemployed until they can secure a job with a higher wage rate. Some frictional unemployment, particularly search unemployment, can be voluntary. It's like someone who has job offers but decides to wait for a better-paying or more suitable position, even if it means being temporarily without work.
Students often think all unemployment is involuntary, but actually some individuals choose to remain unemployed while searching for better opportunities or if benefits are close to low wages.
Involuntary unemployment — Involuntary unemployment arises when workers are willing to work at the current wage but cannot find a job.
Most structural and cyclical unemployment falls into this category. It means individuals are actively seeking employment at the prevailing wage but there are no suitable vacancies available for them. Imagine a factory closing down, leaving many skilled workers without jobs, even though they are eager and able to work at their previous wage. They are willing, but the jobs simply aren't there.
When discussing the causes of unemployment, distinguish clearly between voluntary and involuntary reasons, as this impacts the type of policy response required.
Natural rate of unemployment — The natural rate of unemployment exists when the labour market is in equilibrium with the aggregate demand for labour equalling the aggregate supply of labour.
This is the rate to which new classical economists believe the economy will return in the long run, consistent with a constant inflation rate. It is determined by supply-side factors such as unemployment benefits, education quality, labour mobility, and labour market flexibility. Think of a healthy human body having a 'natural' resting heart rate. Even if you exercise (stimulate the economy), your heart rate will eventually return to its natural resting rate. Similarly, the economy tends to return to its natural rate of unemployment.
Students often think the natural rate of unemployment is fixed, but actually it can change over time due to shifts in supply-side factors like education, training, and labour market flexibility.
When discussing the natural rate, ensure you link it to supply-side factors and long-run equilibrium, and explain why demand-side policies only have a temporary effect on it.
Hysteresis — Hysteresis refers to the phenomenon where unemployment continues to exist after the initial cause of unemployment has disappeared.
This often occurs when workers experience long periods of unemployment, leading to a loss of confidence, outdated skills, and a reluctance by firms to employ them. It can make long-term unemployment a persistent problem. Imagine a path through a field that gets overgrown if not used. Even if the reason for not using the path disappears, it takes effort to clear it again. Similarly, long-term unemployment can make it harder for people to re-enter the workforce.
Labour mobility — Labour mobility is the ability of workers to move from one occupation to another occupation or from one location to another location.
It encompasses both occupational mobility (changing jobs or industries) and geographical mobility (moving to a different area for work). High labour mobility is crucial for an efficient allocation of labour and reducing structural unemployment. Think of water flowing easily through pipes to where it's needed. If the pipes are blocked (low mobility), water can't get to thirsty areas. Similarly, if workers can't move, jobs go unfilled while people remain unemployed.
Students often think labour mobility only refers to moving between countries, but actually it also includes movement between different jobs or regions within the same country.
Occupational mobility — Occupational mobility is the ability of workers to move from one occupation to another occupation.
This is influenced by factors such as the quality of education and training, the availability of information about job opportunities, barriers to entry in certain professions, and the time available for workers to acquire new skills. Higher occupational mobility helps reduce structural unemployment. Imagine a multi-tool with many different functions. A worker with high occupational mobility is like that multi-tool, able to adapt to various job requirements, whereas a single-purpose tool has low occupational mobility.
Geographical mobility — Geographical mobility is the ability of workers to move from one location to another location.
Factors influencing this include the price and availability of housing, information about job vacancies, personal ties, immigration controls, language barriers, cultural differences, and differences in pay and cost of living. Low geographical mobility can exacerbate regional unemployment disparities. Think of a chess piece that can only move one square at a time. It has low geographical mobility. A piece that can move across the board quickly has high geographical mobility, allowing it to reach opportunities faster.
Understanding patterns and trends in employment and unemployment involves observing how these rates change over time and across different demographics or regions. These trends can reveal underlying economic conditions, such as periods of economic growth or recession, and highlight specific challenges like structural shifts in industries or regional disparities in job availability.
Labour mobility, encompassing both occupational and geographical movement, is crucial for an efficient labour market. Occupational mobility is affected by the quality of education and training, access to job information, and the time required to acquire new skills. Geographical mobility is influenced by housing costs, personal ties, language barriers, and differences in the cost of living between regions.
Policies to reduce unemployment must be targeted to the specific type of unemployment. Demand-side policies, such as expansionary fiscal or monetary policy, are effective for cyclical unemployment. Supply-side policies, including education, training, and measures to improve labour market flexibility, are crucial for reducing structural and frictional unemployment, thereby lowering the natural rate of unemployment.
In essays, always link specific policies to the specific type of unemployment they are designed to reduce. For example, link retraining schemes directly to tackling structural unemployment.
When evaluating policies, consider time lags, costs, and potential unintended consequences. For example, cutting unemployment benefits to reduce voluntary unemployment could increase poverty.
To show higher-level analysis, discuss the concept of hysteresis and how a short-term rise in cyclical unemployment can lead to a long-term increase in the Natural Rate of Unemployment (NRU).
Advantages & Disadvantages
Demand-side policies to reduce disequilibrium (cyclical) unemployment
Supply-side policies to reduce equilibrium (structural/frictional) unemployment
Evaluation Starters
Essay Structure Guide
Introduction
Begin by defining key terms such as full employment, equilibrium and disequilibrium unemployment, and the natural rate of unemployment. Briefly outline the different types of unemployment and the scope of your essay.
Conclusion
Summarise your main arguments, reiterating the importance of correctly identifying the type of unemployment to apply effective policies. Conclude with a reasoned judgment on the overall challenges and potential solutions for reducing unemployment in an economy.
This chapter defines money by its functions and characteristics, explaining how the money supply is measured and the quantity theory of money. It details the roles of commercial and central banks, including credit creation and quantitative easing, and evaluates anti-inflationary policies. Finally, it explores interest rate determination through the liquidity preference and loanable funds theories.
Money — Money is an item which people use to buy and sell goods and services and carries out a number of other functions.
Beyond being a medium of exchange, money also serves as a store of value, a unit of account, and a standard of deferred payment. Its general acceptability is its most crucial characteristic, much like a universal token in an arcade that can be used for any game, saved, or borrowed.
Students often think money is only physical cash, but actually money in bank deposits, transferred electronically, is the main form of money.
Medium of exchange — Money acts as a medium of exchange by allowing people to sell goods and services for money and then use that money to buy other goods and services, overcoming the need for a double coincidence of wants.
This function simplifies transactions by eliminating the need for direct bartering, where two parties must each desire what the other possesses. For example, a farmer can sell onions for money and then use that money to buy curtains, rather than needing to find a curtain maker who specifically wants onions.
To score well, explain how money as a medium of exchange 'overcomes the need for the double coincidence of wants' and provide a clear example.
Store of value — Money enables people to save by keeping any money they receive from selling goods and services for future use.
This function allows economic agents to defer consumption, transferring purchasing power from the present to the future. However, its effectiveness can be eroded by inflation, meaning its purchasing power might decrease over time, unlike saving money in a piggy bank for a future purchase which assumes stable value.
Students often think money is a perfect store of value, but actually its value can be eroded by inflation, meaning it buys less in the future.
Unit of account — Money enables the value of different items to be compared as prices are expressed in money terms.
Also known as a measure of value, this function provides a common denominator for valuing goods, services, and assets, simplifying economic calculations and comparisons. Just as a ruler measures length, money measures economic value, allowing you to compare a 2 soft drink and say the book is worth 15 times more.
Standard of deferred payment — Money enables people, firms and the government to borrow and lend and to buy and sell in the future.
This function facilitates credit transactions, allowing agreements for future payments to be made in a stable and generally accepted unit, which is crucial for investment and economic growth. When you take out a loan for a car, the agreement specifies repayment in money over time, making money the standard for that future payment.
Cryptocurrencies — Cryptocurrencies are also called digital money and electronic money, allowing people to make and receive payments online, person to person, without the need for a commercial bank and are not regulated by central banks.
While some people use cryptocurrencies like bitcoin for payments and saving, their general acceptability is still debated, limiting their full function as money in many economies. They are like a private digital currency used within a specific online community, working for transactions within that community but not widely accepted by mainstream shops or banks.
Students often think cryptocurrencies are universally accepted as money, but actually the majority of shops and firms do not accept them as a way of paying for products.
Money supply — The money supply is the total amount of money in an economy, consisting of currency in circulation plus relevant deposits.
Governments measure the money supply to understand aggregate demand and financial market trends, using various measures due to the evolving nature of what constitutes 'money'. Think of the money supply as the total volume of water in a country's financial system; it includes the water in rivers (cash) and the water in reservoirs (bank deposits).
Narrow money — Narrow money is money that is used as a medium of exchange and consists of notes in circulation and cash held in banks and in balances held by commercial banks at the central bank.
This measure focuses on the most liquid forms of money, primarily used for transactions, and is sometimes referred to as the monetary base. Consider narrow money as the readily available cash in your wallet and your checking account balance, immediately usable for purchases.
Broad money — Broad money consists of the items in narrow money plus a range of items that are concerned with money’s functions as a store of value, such as money in savings accounts.
This is a wider measure of the money supply, encompassing less liquid assets that still serve as a store of value, providing a more comprehensive view of an economy's total purchasing power. Broad money is like including not just the cash in your wallet but also your savings account, which can be converted to cash but isn't immediately spent.
Quantity theory of money — The quantity theory of money is a theory which seeks to explain how changes in the money supply can have an impact on the economy, based on the Fisher equation MV = PT.
Monetarists assume that the velocity of circulation (V) and transactions/output (T or Y) are constant, implying that a change in the money supply (M) causes an equal percentage change in the price level (P). Keynesians dispute this assumption. Imagine a fixed number of goods in a market and people spending money at a constant rate; if you double the amount of money, prices will simply double because there's more money chasing the same goods.
Fisher equation (Quantity Theory of Money)
Used to explain how changes in money supply impact the economy. Monetarists assume V and T are constant.
Students often think the quantity theory always holds true, but actually Keynesians argue that V and T can change, making predictions about P less certain.
When explaining the quantity theory, always state the Fisher equation (MV=PT or MV=PY), define each variable, and clearly state the monetarist assumptions (V and T are constant) and the resulting conclusion (M directly affects P).
Commercial banks — Commercial banks, also called high street banks and retail banks, carry out a range of functions including providing deposit accounts, lending money, and holding various assets.
They are profit-making institutions that facilitate financial transactions, provide credit, and manage customer deposits, playing a crucial role in money creation. Think of commercial banks as financial supermarkets; they offer various services like checking accounts, savings accounts, and loans to individual customers and businesses.
Demand deposit account — A demand deposit account, also known as a current account or sight account, provides easy and quick access to the money in the account and is used mainly to receive and make payments.
This type of account is highly liquid, allowing customers to withdraw cash or make electronic payments readily, making it central to everyday transactions. Your everyday checking account is a demand deposit account; you can access your money instantly for bills, purchases, or cash withdrawals.
Savings deposit account — A savings deposit account is a type of account used mainly as a way of saving.
These accounts typically offer interest on deposits and may have some restrictions on withdrawals, encouraging customers to hold money for longer periods. A savings deposit account is like a dedicated jar for money you're putting aside for a big purchase or future goal, earning a little extra money while it sits there.
Overdraft — An overdraft allows customers to spend more than is in their deposit accounts, often used for unexpected differences in spending and income, with interest charged on the amount overdrawn.
It is a short-term borrowing facility provided by commercial banks, offering flexibility but typically at a higher interest rate than a loan. An overdraft is like having a small, pre-approved credit line directly linked to your bank account, allowing you to temporarily go into negative balance when needed.
Loan — A loan has to be agreed with a commercial bank, is usually for a particular purpose and a set amount of time, with interest paid on the full value of the loan.
Loans are a form of credit provided by banks for specific purposes and fixed durations, generally carrying lower interest rates than overdrafts but requiring repayment of the full amount regardless of usage. A loan is like borrowing a specific amount of money for a specific project, like buying a car, with a clear plan to pay it back over a set period.
When asked about commercial banks, ensure you cover their core functions (deposit accounts, lending) and their key objectives (profitability, liquidity, security), noting the potential conflicts between them.
Commercial banks play a crucial role in creating money through the process of credit creation. When a bank receives a deposit, it is only required to keep a proportion of it as liquid assets, known as the reserve ratio. The remaining funds can be lent out, which then often gets redeposited in the banking system, leading to a multiple expansion of the initial deposit. This mechanism allows banks to create new money, rather than just lending out existing funds.
Students often think commercial banks only lend money they already have, but actually they create money through the process of credit creation by lending out a multiple of their liquid assets.
Reserve ratio — The proportion of liquid assets to total deposits that commercial banks keep is known as the reserve ratio.
This ratio, which can be set by a central bank, determines how much a commercial bank can lend; a lower ratio allows for more lending but increases the risk of a bank run. Imagine a restaurant keeping a certain percentage of its daily earnings in a cash register (liquid assets) to cover immediate expenses, while the rest can be invested or used for other purposes.
Bank credit multiplier — The bank credit multiplier shows how much money a commercial bank can create by lending, calculated as the value of new assets created divided by the value of change in liquid assets, or 1 divided by the reserve ratio.
This mechanism explains how an initial deposit can lead to a multiple expansion of the money supply through successive rounds of lending and redepositing within the banking system. If a bank only needs to keep 10% of deposits as reserves, every 90 being lent, then redeposited, then $81 lent again, and so on, multiplying the initial deposit.
Bank credit multiplier (after loans have been made)
Calculates the multiplier based on observed changes in assets and liquid assets.
Bank credit multiplier (in advance)
Calculates the potential multiplier based on the bank's reserve ratio.
Potential increase in total liabilities (deposits)
Used to determine the maximum possible increase in deposits given a change in liquid assets and the multiplier.
Potential increase in bank lending (advances)
Calculates the maximum amount a bank can lend after accounting for the initial liquid asset increase.
For calculation questions involving the bank credit multiplier, always state the formula (1 / Reserve Ratio) and show your workings clearly to gain method marks.
Students often think the multiplier is always fully realised, but actually factors like a lack of credit-worthy borrowers or changes in cash preferences can limit its actual impact.
Capital ratio — The capital ratio is a commercial bank’s available financial capital expressed as a percentage of its riskier assets, including retained profits and newly issued shares.
This ratio is designed to protect bank customers and promote banking sector stability by ensuring banks have sufficient capital to absorb unexpected losses from risky loans, discouraging excessive risk-taking. Think of the capital ratio as a bank's financial safety net; it's the amount of its own money (capital) it has set aside to cover potential losses from its riskier investments, like a personal emergency fund.
Students often think the capital ratio is the same as the reserve ratio, but actually the capital ratio focuses on a bank's ability to absorb losses from risky assets, while the reserve ratio focuses on liquidity to meet deposit withdrawals.
Central bank — The central bank of a country carries out a range of functions including issuing bank notes, authorising coin minting, acting as the bank of commercial banks, and implementing government monetary policy.
It is the primary monetary authority, responsible for maintaining financial stability, controlling the money supply, and acting as a lender of last resort to commercial banks and the government. The central bank is like the conductor of an orchestra; it sets the tempo (interest rates), ensures harmony (financial stability), and provides guidance to all the individual musicians (commercial banks).
When describing the central bank's role, ensure you cover its key functions: issuing currency, banker to commercial banks, banker to the government, and implementing monetary policy.
Quantitative easing — Quantitative easing involves a central bank buying both government and private securities, of different maturities, from financial institutions, including commercial banks, to increase aggregate demand when interest rates are very low.
This policy aims to increase the money supply and reduce long-term interest rates by crediting commercial bank accounts, hoping to encourage more lending, investment, and consumer expenditure. Imagine the central bank buying up a large amount of financial assets from banks, like a vacuum cleaner sucking up old papers, to inject fresh cash into the banking system, hoping banks will then lend more.
Monetary transmission mechanism — The monetary transmission mechanism is the process by which a change in monetary policy works through the economy via a change in aggregate demand to the price level and the real GDP.
This mechanism describes the chain of events, such as changes in interest rates affecting investment and consumption, that link a central bank's policy actions to their ultimate impact on economic variables like inflation and output. Think of it like a domino effect: the central bank pushes the first domino (monetary policy change), which then knocks over a series of other dominos (interest rates, investment, consumption) until the final dominos (price level, GDP) are affected.
When asked to explain the monetary transmission mechanism, outline the sequence of events, for example, 'increase in money supply → lower interest rate → increased aggregate demand → higher output/price level'.
Liquidity preference — Liquidity preference is the demand for money, explained by three main motives for households and firms to hold part of their wealth in a money form: transactions, precautionary, and speculative.
This Keynesian concept suggests that individuals prefer to hold liquid assets (money) rather than less liquid assets (like bonds) for various reasons, influencing the demand for money and thus the interest rate. It's like deciding how much cash to keep in your pocket versus how much to put in a long-term savings account; you need some for daily spending, some for emergencies, and some you might hold if other investments seem risky.
Transactions motive — The transactions motive is the desire to hold money to make everyday purchases and meet everyday payments.
The amount held for this motive is influenced by income and the frequency of income payments; higher income and less frequent payments generally lead to higher holdings. This is the cash you keep in your wallet or the balance in your checking account for daily expenses like groceries, transport, or coffee.
Precautionary motive — The precautionary motive is the desire to hold money to meet unexpected expenses and take advantage of unforeseen bargains.
This involves holding money beyond immediate transaction needs as a buffer against uncertainty, and like the transactions motive, it is relatively interest inelastic. This is the emergency fund you keep in an easily accessible account for unexpected car repairs, medical bills, or a sudden sale on something you've wanted.
Speculative motive — The speculative motive is the desire to hold money balances, sometimes called idle balances, when households and firms believe that the returns from holding financial assets are low.
This motive is highly interest elastic; people hold money when bond prices are high (and interest rates low) and expected to fall, to avoid capital losses and because the opportunity cost of holding money is low. It's like holding onto cash instead of buying stocks when you think stock prices are too high and likely to fall, waiting for a better buying opportunity.
Ensure you explain all three motives for holding money (transactions, precautionary, speculative) and note that the speculative motive is interest elastic, while the others are relatively interest inelastic.
Rate of interest — The rate of interest is the cost of borrowing money or the return on saving money, expressed as a percentage.
It is determined by the interaction of the demand for and supply of money (Keynesian theory) or loanable funds (loanable funds theory), influencing investment, consumption, and economic activity. Think of the interest rate as the 'rental price' of money; if you rent money (borrow), you pay this price, and if you let others rent your money (save), you earn this price.
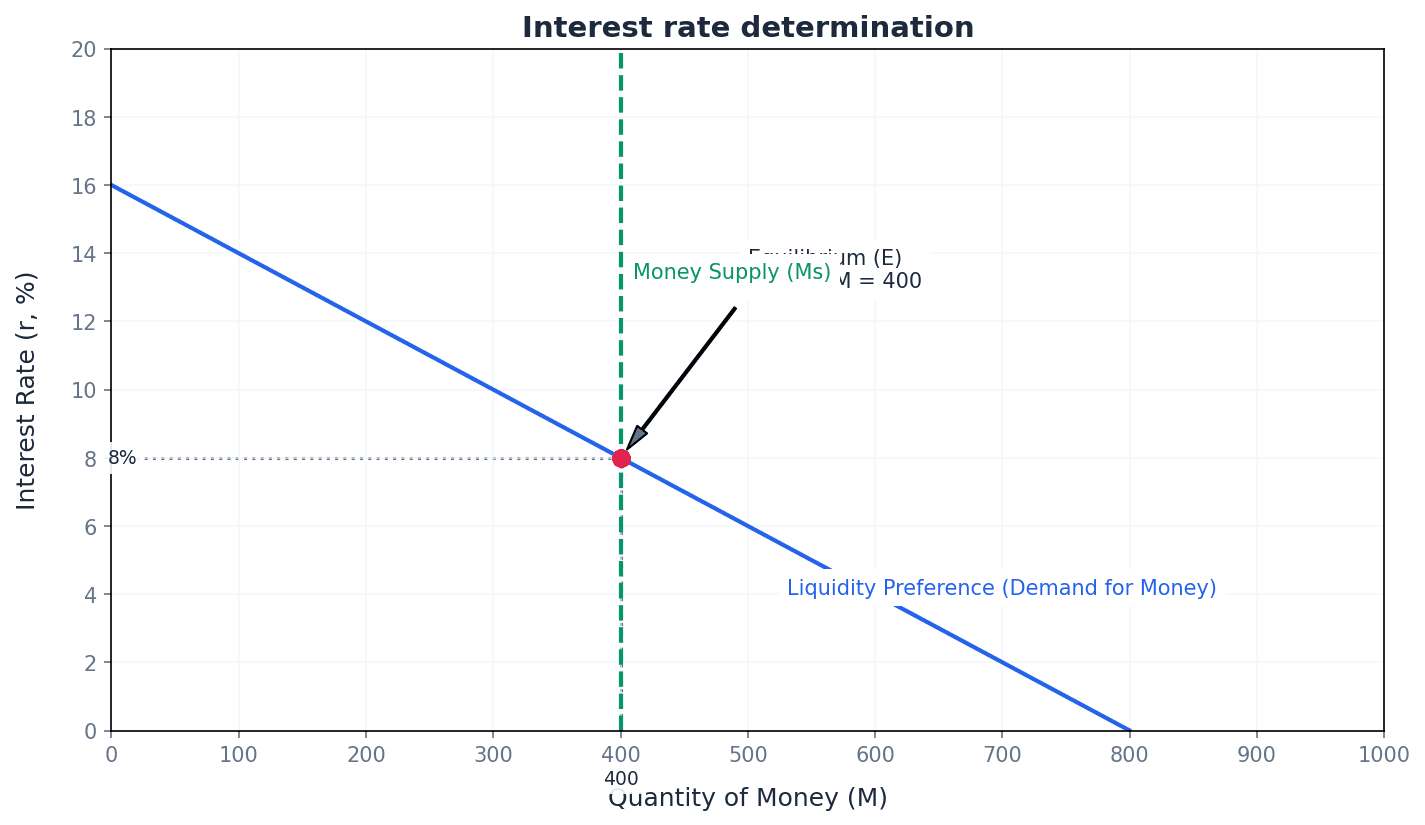
Liquidity trap — The liquidity trap is a situation, described by Keynes, where an increase in the money supply would not be able to drive down the rate of interest further because speculators would expect bond prices to fall and would hold all extra money.
This occurs when interest rates are very low and the demand for money becomes perfectly elastic, rendering conventional monetary policy ineffective as people prefer to hold cash rather than invest in bonds. Imagine trying to push a string; once interest rates are extremely low, injecting more money is like pushing the string – it just piles up (held as cash) without moving the interest rate further down.
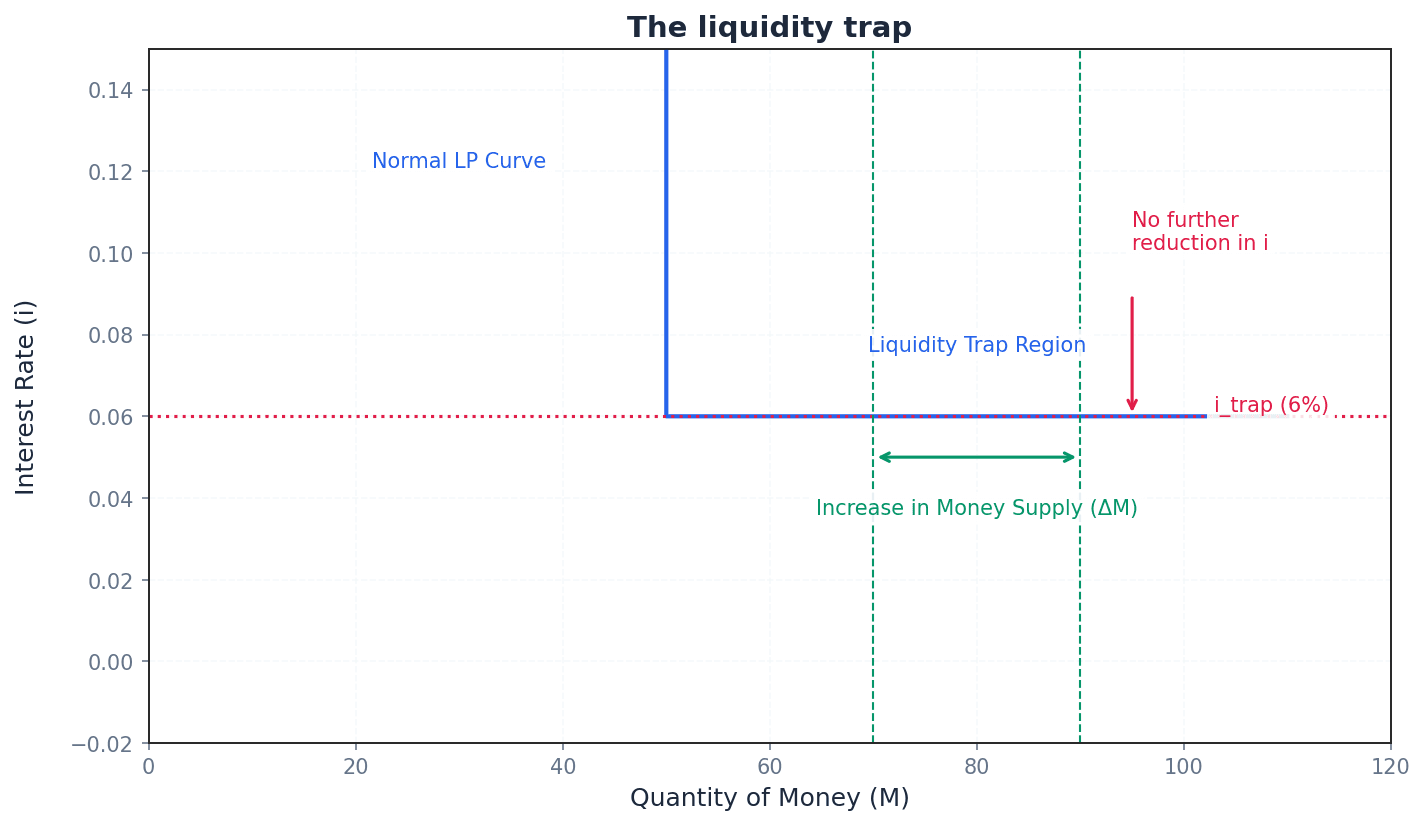
When explaining the liquidity trap, draw the perfectly elastic demand for money curve at a very low interest rate and explain why monetary policy becomes ineffective in this scenario.
Loanable funds theory — The loanable funds theory suggests that the rate of interest is determined by the demand for and supply of loanable funds.
The demand for loanable funds comes from borrowing by households, firms (for investment), and government (for budget deficits), while the supply comes from savings; their interaction sets the equilibrium interest rate. Think of a market for borrowing and lending money; the interest rate is the price that balances the amount people want to borrow with the amount people are willing to save and lend.
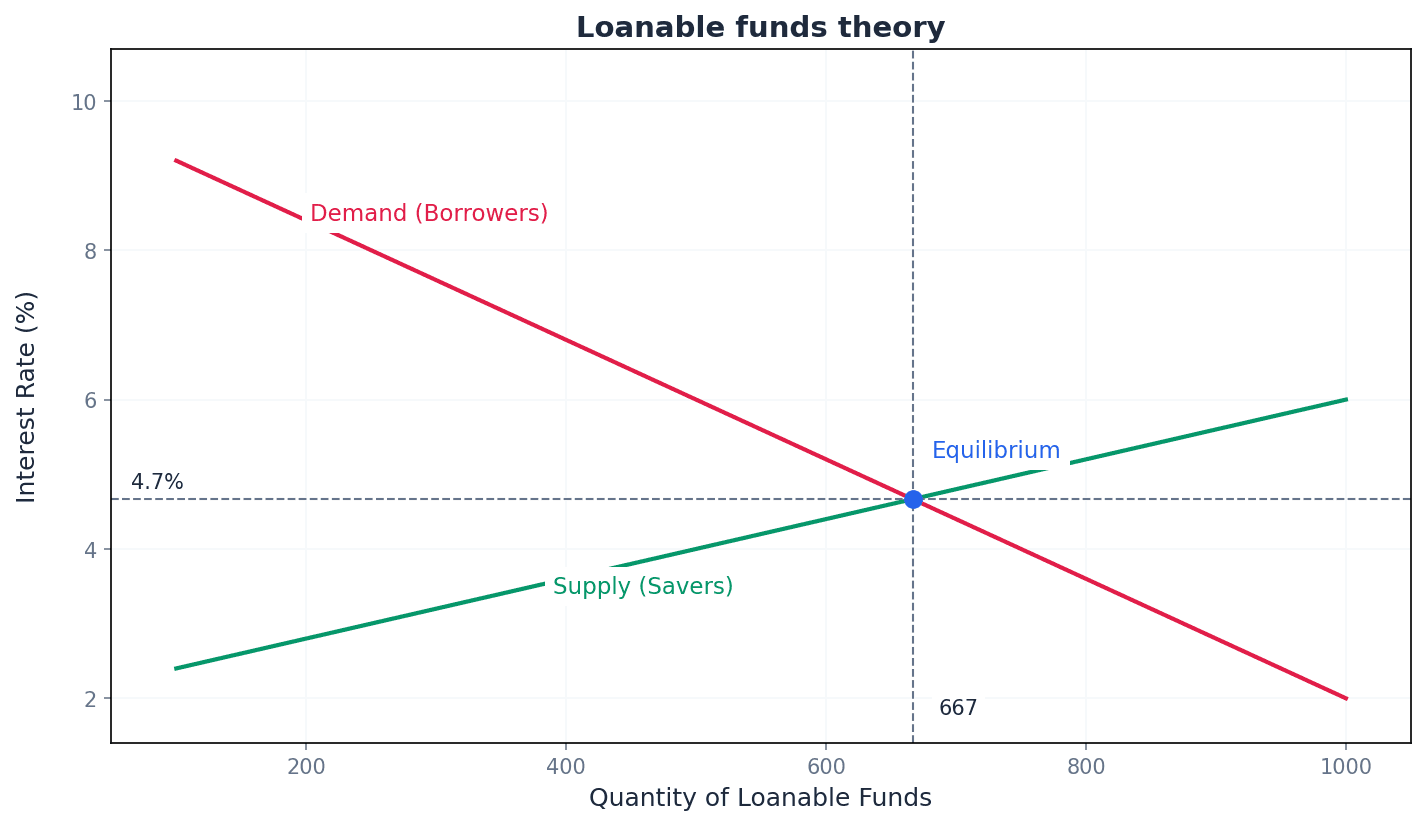
When discussing interest rate determination, clearly state whether you are applying the Keynesian (liquidity preference) or Loanable Funds theory, as their underlying assumptions differ.
In evaluation questions, use concepts like the 'liquidity trap' to argue why monetary policy might be ineffective in certain economic conditions.
Advantages & Disadvantages
Quantitative Easing (QE)
Monetary Policy to Reduce Inflation
Evaluation Starters
Essay Structure Guide
Introduction
Begin by defining key terms such as money, money supply, and inflation. Briefly outline the main theories of money and interest rate determination that will be discussed, setting the context for your analysis.
Conclusion
Summarise the main arguments, reiterating the complexities and challenges in managing money and banking. Offer a final judgment on the relative effectiveness of different policies or theories, acknowledging their limitations and real-world applicability.
This chapter outlines the primary macroeconomic policy objectives of governments, including achieving low and stable inflation, balance of payments stability, low unemployment, and sustainable economic growth. It also explores broader goals such as economic development, sustainability, and the redistribution of income and wealth, highlighting their interconnectedness and potential trade-offs.
Economic development — Development is a multidimensional process to improve the quality of life, encompassing not just higher incomes but also better education, health, nutrition, less poverty, a cleaner environment, more equality of opportunity, greater individual freedom and a rich cultural life.
Economic development is a broader concept than mere economic growth, which is simply an increase in GDP. It focuses on a holistic improvement in a country's social and economic fabric, aiming to move the entire social system towards a materially and spiritually better condition of life. This is like a student becoming a better all-round student, improving in all subjects, participating more, and feeling happier, rather than just getting a higher score on one test.
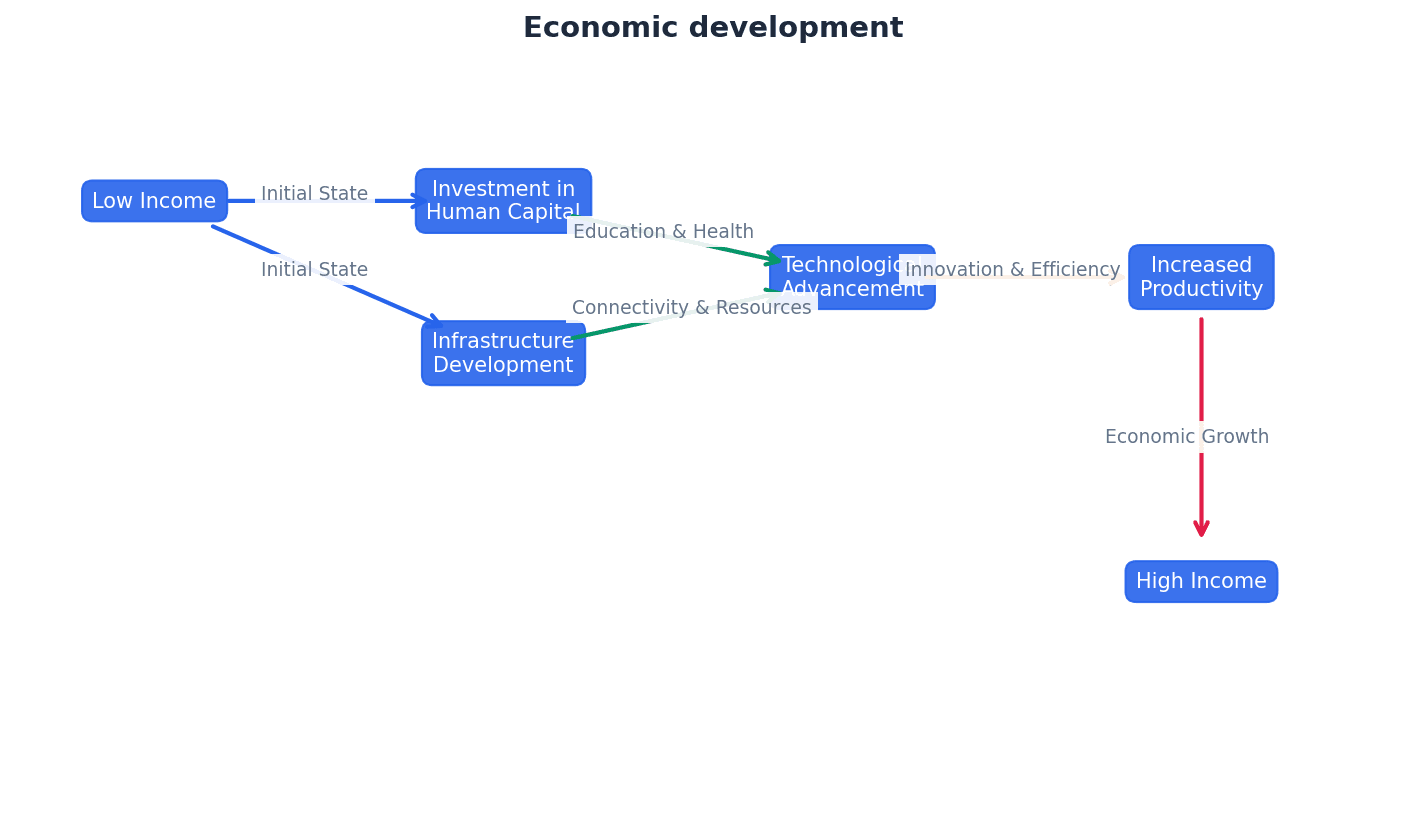
Students often think that a country with high economic growth is automatically a developed country. But actually, high income is not sufficient to ensure a rise in the quality of life; development is a much broader concept.
In exam questions, distinguish clearly between economic growth and economic development. Use the 'Key Concept Link' from the text: 'Economic growth means a country’s real GDP has increased but development means it has progressed in a wider sense.' Use indicators beyond GDP per capita, like those mentioned in the World Bank definition, to support your analysis of development.
Sustainable development — Sustainable development occurs when output increases in a way that does not harm the needs of future generations.
This concept emphasizes that economic growth should not be achieved at the expense of future living standards. It involves practices like recycling, using renewable resources, and adopting technology that reduces pollution. This is similar to a farmer who uses crop rotation and natural fertilizers to get a good harvest this year without depleting the soil, ensuring future harvests, unlike a farmer who uses harsh chemicals for a massive one-time yield but leaves the land barren.
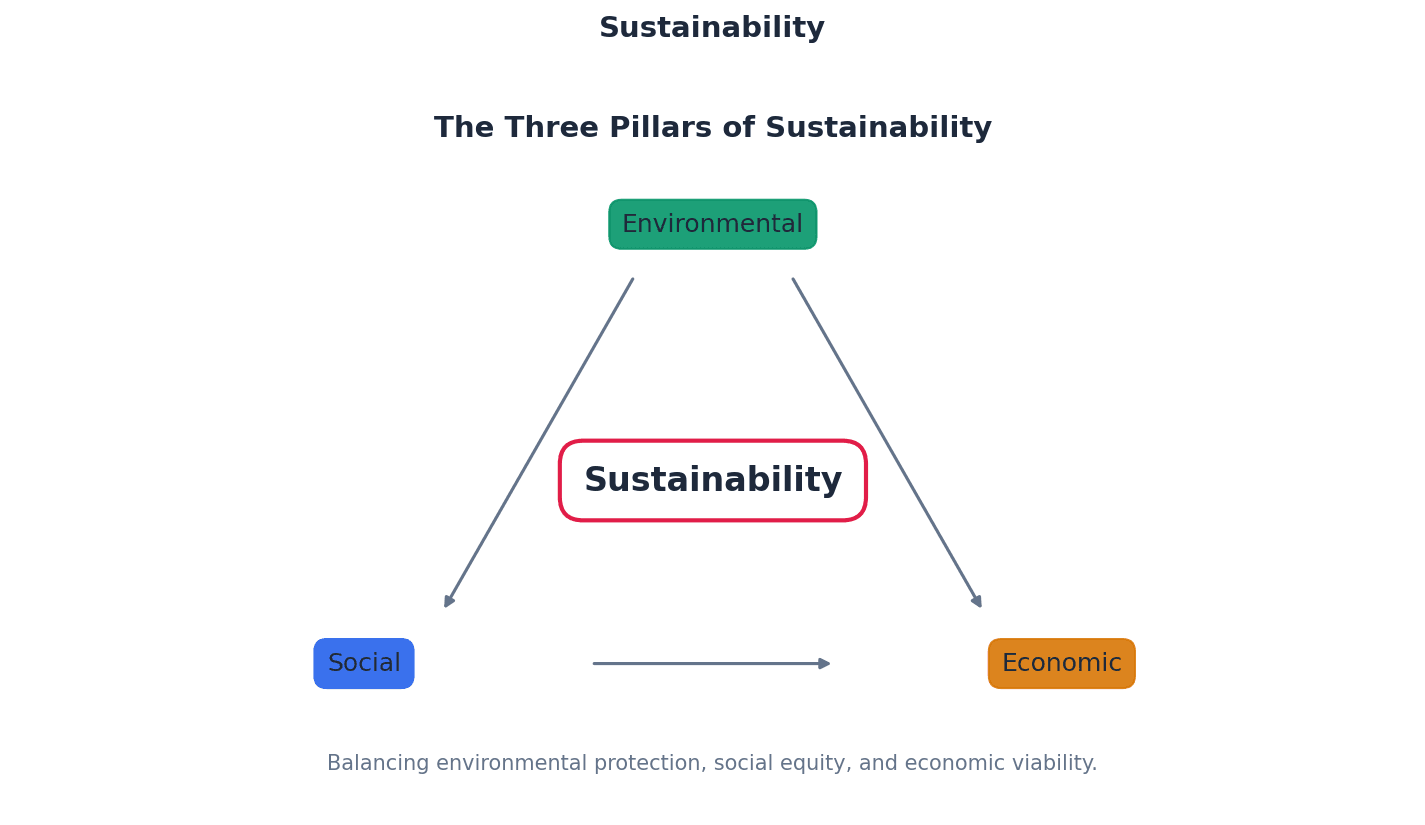
Students often think economic growth and sustainability are mutually exclusive. But actually, improvements in technology can both increase output and reduce pollution, allowing for sustainable growth.
When asked to evaluate economic growth, always consider its sustainability. A strong answer will discuss whether the growth is depleting non-renewable resources or causing environmental damage, thereby linking the concepts of growth and sustainable development.
Balance of payments stability — A government objective to have the total of the credit items in the current account of the balance of payments equal the total of the debit items in the long run.
This objective aims to avoid persistent current account deficits or surpluses, as both can have negative consequences. A deficit can reduce aggregate demand and lead to external debt, while a surplus can be inflationary and represents an opportunity cost of forgone imports. This is like managing a personal monthly budget, aiming for income to roughly match spending over time to avoid debt or unused funds.
Students often think that a current account surplus is always a sign of a healthy economy and a primary policy goal. But actually, a surplus can be inflationary and involves an opportunity cost of forgone imports.
When analysing the balance of payments, don't just focus on deficits. Explain the potential negative consequences of a surplus as well, such as inflationary pressure. Also, link fluctuations in the current account to exchange rate instability and its impact on investment.
Redistribution of income and wealth — A government policy of taking some money from the rich and using it to help those on low incomes either in the form of cash benefits or in the form of the provision of goods and services.
This policy is often justified on grounds of fairness (equity), as some individuals may have low incomes due to factors beyond their control. It is also based on the idea that an extra dollar provides more benefit (utility) to a low-income person than to a rich person. This is like sharing a pizza, where someone who hasn't eaten all day gets more satisfaction from an extra slice than someone who is already full, making the overall experience fairer.
Students often think that redistribution of income through taxes and benefits is purely an economic drain. But actually, it can be justified on grounds of fairness and that those on low incomes receive more benefit from the extra money, which can also boost aggregate demand.
When discussing redistribution, provide a balanced argument. Acknowledge the aim of achieving equity and helping those in need, but also consider the potential conflict with other objectives, such as the possible disincentive effect on work and enterprise from high progressive taxes.
Government macroeconomic policy objectives, including low and stable inflation, balance of payments stability, low unemployment, and sustainable economic growth, are often interconnected. Achieving one objective may support another, but frequently, there are potential trade-offs involved in policy implementation. For example, policies aimed at stimulating economic growth might lead to higher inflation or a worsening of the current account balance.
Beyond the core macroeconomic objectives, governments also pursue broader goals such as economic development and sustainability. Economic development encompasses a holistic improvement in quality of life, extending beyond just income to include education, health, and equality. Sustainability ensures that current economic activities do not deplete resources or damage the environment, thereby safeguarding the needs of future generations.
When evaluating a policy, always consider its impact on multiple government objectives and identify potential conflicts or trade-offs.
Define key terms precisely at the start of your answer. For example, clearly distinguish between 'economic growth' (increase in real GDP) and 'economic development' (improvement in living standards).
Advantages & Disadvantages
Redistribution of income and wealth
Achieving a current account surplus
Evaluation Starters
Essay Structure Guide
Introduction
Begin by defining the key macroeconomic policy objectives relevant to the question, such as inflation, unemployment, balance of payments, and economic growth. Briefly state the government's overall aim to achieve these objectives for economic stability and welfare.
Conclusion
Summarise the main arguments, reiterating the importance of a balanced approach to macroeconomic policy. Conclude by emphasising that governments face complex challenges in balancing competing objectives and that policy success often depends on careful consideration of trade-offs and dynamic economic conditions.
This chapter explores the complex interconnections between key macroeconomic problems: inflation, unemployment, economic growth, and the balance of payments. It details how the internal and external values of money are linked, and how these problems influence each other, particularly focusing on the short-run and long-run relationship between inflation and unemployment.
depreciation — A fall in the external value of a country's currency.
This occurs when the demand for a country's currency falls and/or the supply of its currency rises on the foreign exchange market. Imagine a popular toy that suddenly becomes less desirable; its price (value) in the market will fall because fewer people want to buy it and more people might want to sell theirs.
When asked to explain depreciation, ensure you link it to changes in demand and supply for the currency in the foreign exchange market, and its impact on exports and imports.
Students often think depreciation means the currency is worthless, but actually it just means its value has fallen relative to other currencies, making it cheaper for foreigners to buy domestic goods and more expensive for domestic consumers to buy foreign goods.
Phillips curve — A curve showing the inverse relationship between the rate of unemployment and the rate of inflation.
The traditional Phillips curve suggests that a government can choose a trade-off between unemployment and inflation, meaning lower unemployment can be achieved at the cost of higher inflation, and vice versa, due to changes in aggregate demand and wage pressure. Think of it like a seesaw: if one side (unemployment) goes down, the other side (inflation) tends to go up, implying a choice between the two.
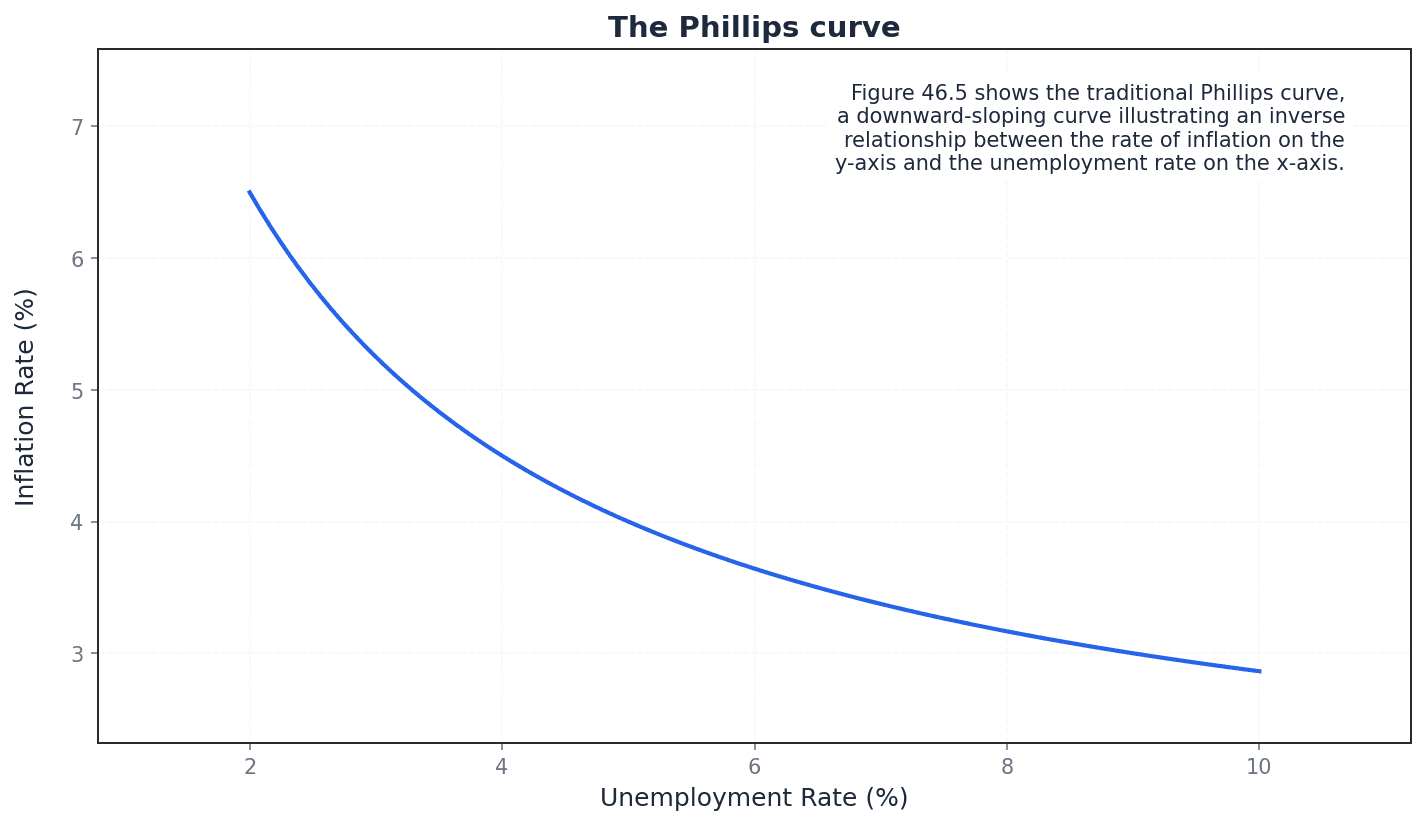
When analysing the traditional Phillips curve, discuss its downward-sloping shape, its implications for government policy (trade-off), and factors that can cause it to shift.
Students often think the Phillips curve is a fixed relationship, but actually it can shift due to factors like supply-side improvements or changes in inflation expectations.
natural rate of unemployment — The rate of unemployment that exists when the labour market is in equilibrium and there is no cyclical unemployment.
This rate includes frictional and structural unemployment, representing the lowest sustainable unemployment rate an economy can achieve without accelerating inflation. Think of a swimming pool that always has some water evaporating or splashing out, even when it's full. The 'natural rate' is like the unavoidable amount of water loss, even if you keep refilling it. You can't get to zero loss without changing the pool itself.
When discussing the natural rate of unemployment, ensure you explain its components (frictional, structural) and its significance in the context of the long-run Phillips curve, where attempts to push unemployment below this rate lead only to inflation.
Students often think the natural rate of unemployment means zero unemployment, but actually it's the unemployment rate that persists even when the economy is at full employment, accounting for unavoidable job search and structural mismatches.
expectations-augmented Phillips curve — A model that incorporates the role of inflation expectations into the relationship between inflation and unemployment, suggesting no long-run trade-off.
Developed by monetarists, this model argues that while there may be a short-run trade-off between inflation and unemployment, in the long run, government policies to increase aggregate demand only lead to higher inflation, with unemployment returning to its natural rate. Imagine trying to trick a dog with a treat: in the short run, it might follow your hand, but once it realizes there's no treat (or the treat isn't as good as expected), it won't be fooled again. Similarly, workers and firms adjust their expectations, negating the long-run trade-off.
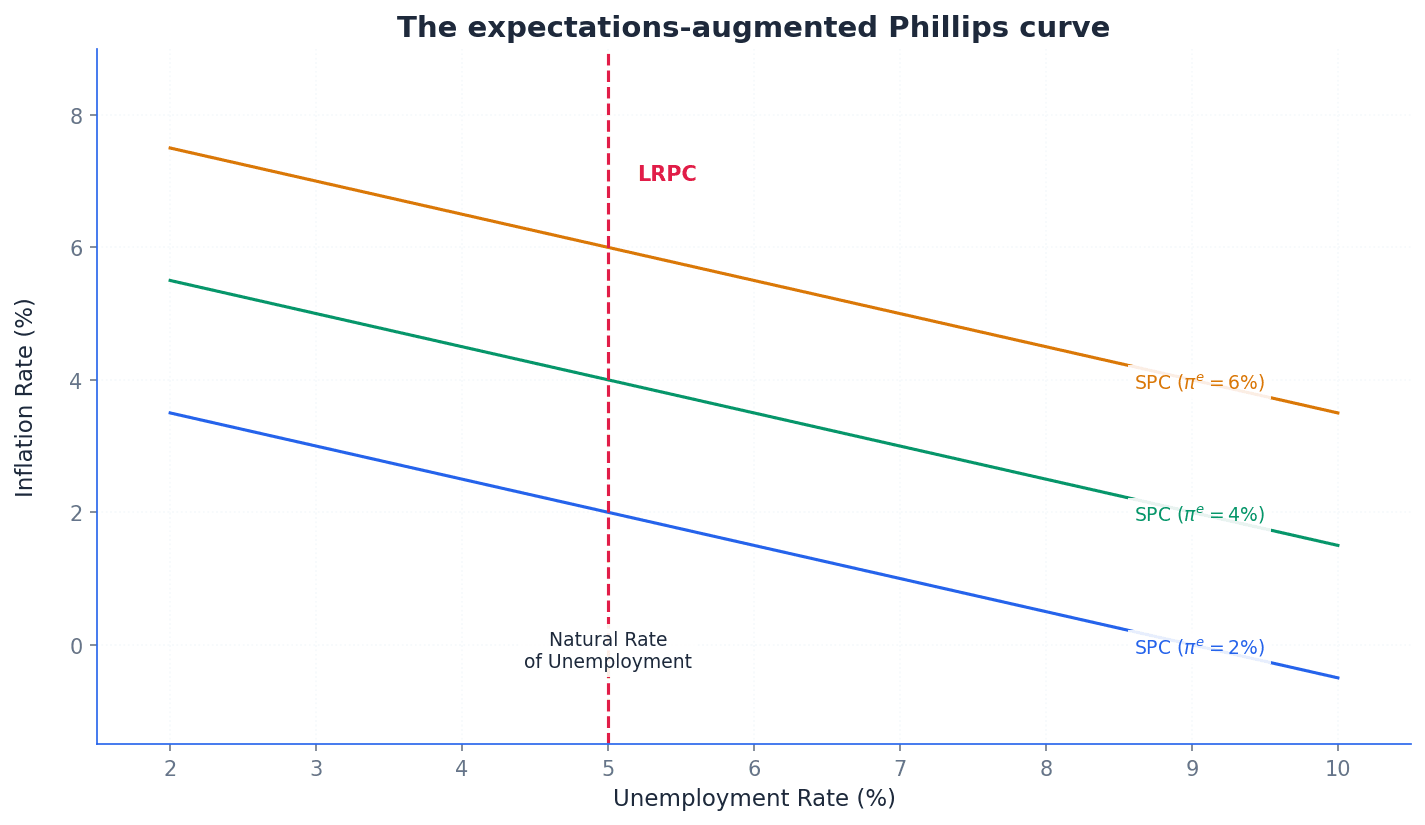
When comparing the Phillips curve and the expectations-augmented Phillips curve, clearly differentiate between the short-run and long-run implications, and attribute the latter to monetarist views and the concept of the natural rate of unemployment.
Students often think the expectations-augmented Phillips curve implies no relationship between inflation and unemployment at all, but actually it distinguishes between a short-run trade-off and a long-run vertical curve where unemployment is at its natural rate regardless of inflation.
The internal value of money refers to its purchasing power within a country, while the external value refers to its value relative to other currencies. A fall in the internal value of money, meaning inflation, typically leads to a fall in its external value, or depreciation, as domestic goods become less price-competitive internationally. However, this connection is not always direct, especially under fixed exchange rates or if a country's inflation rate is lower than its rivals'.
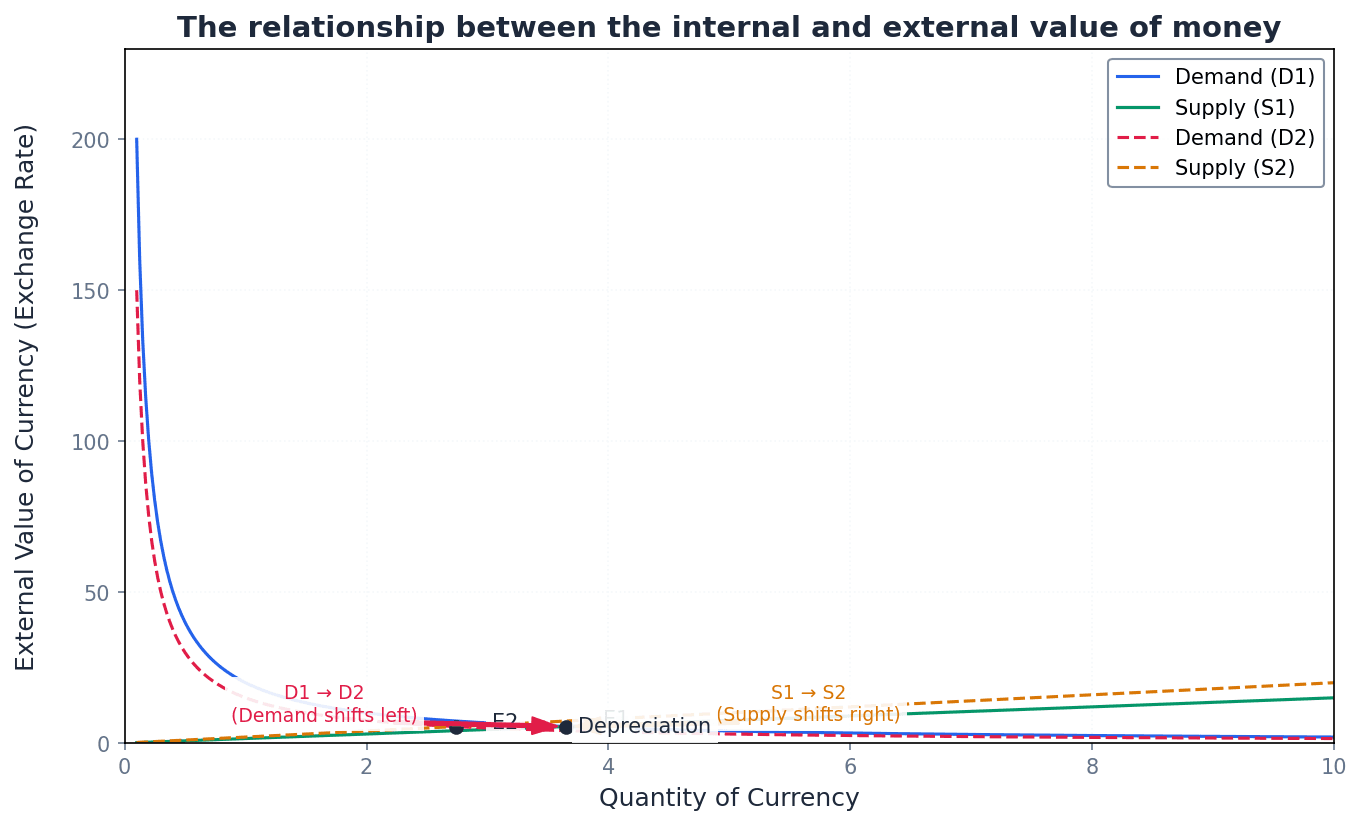
Students often think that the internal and external values of a currency are always directly connected, but this may not be the case if a country has a fixed exchange rate or its inflation rate is below that of rival countries.
High inflation within a country can significantly impact its balance of payments, particularly the current account. When domestic prices rise faster than those in rival countries, exports become more expensive and less competitive, while imports become relatively cheaper and more attractive. This typically leads to a fall in net exports and a worsening of the current account balance.
Explain the transmission mechanism. Don't just state 'inflation worsens the current account'; explain *how* (e.g., exports become less price-competitive, imports become relatively cheaper, leading to a fall in net exports).
The relationship between economic growth and inflation is complex. While rapid demand-led economic growth can be inflationary if aggregate demand outstrips aggregate supply, potential economic growth (driven by supply-side improvements) can actually reduce inflation. This is because an increase in an economy's productive capacity allows aggregate demand to increase without pushing up prices and can also reduce production costs.
Students often think that economic growth always leads to inflation, but potential economic growth can reduce inflation by enabling aggregate demand to increase without pushing up prices and by reducing production costs.
Rapid economic growth often has implications for the balance of payments. As national income rises, consumers typically increase their demand for both domestic and imported goods and services. This increase in imports, driven by higher incomes, can lead to a worsening of the current account balance, as the country spends more on foreign goods.
Forgetting the link between growth and the balance of payments; higher incomes from growth increase the marginal propensity to import, often worsening the current account.
The traditional Phillips curve illustrates a short-run inverse relationship between inflation and unemployment, suggesting a trade-off for policymakers. However, the expectations-augmented Phillips curve, developed by monetarists, argues that this trade-off only exists in the short run. In the long run, as workers and firms adjust their inflation expectations, unemployment returns to its natural rate, and attempts to reduce unemployment below this rate through expansionary policies only lead to higher inflation.
Students often think that government expansionary policies can permanently reduce unemployment, but monetarists argue that in the long run, such policies only lead to higher inflation, with unemployment returning to its natural rate.
Always distinguish between the short-run and long-run Phillips curve in your analysis. Use a diagram to show the vertical long-run curve at the Natural Rate of Unemployment (NRU).
When discussing a policy's impact on one objective (e.g., growth), always consider its potential trade-offs with other objectives (e.g., inflation, balance of payments).
Use the concept of 'expectations' to explain why the short-run Phillips curve might shift and why the long-run trade-off may not exist.
In evaluation, question the assumed relationships. For example, does growth *always* harm the balance of payments? Not if the growth is export-led.
Advantages & Disadvantages
Achieving lower unemployment through demand-side policies (short-run Phillips Curve)
Economic Growth
Evaluation Starters
Essay Structure Guide
Introduction
Begin by defining the key macroeconomic problems (inflation, unemployment, growth, balance of payments) and briefly stating that they are intricately linked, often presenting trade-offs for policymakers. Outline the main relationships you will explore in your essay.
Conclusion
Summarise the main interconnections and trade-offs between the macroeconomic problems. Reiterate that policymakers face difficult choices and that achieving one objective often comes at the expense of another, especially in the short run. Emphasise the dynamic nature of these relationships and the importance of considering long-run implications and expectations.
This chapter evaluates the effectiveness of various macroeconomic policies, including fiscal, monetary, supply-side, exchange rate, and international trade policies, in achieving key macroeconomic objectives. It highlights potential conflicts between these objectives and explores limitations such as time lags, unexpected responses, and political influences that can lead to government macroeconomic failure.
Laffer curve — The Laffer curve shows that when tax rates are high, raising them further will be counterproductive, as it may reduce tax revenue by discouraging work and encouraging tax evasion.
This curve suggests there is an optimal tax rate that maximises government tax revenue. Beyond this point, increasing tax rates can lead to a decrease in the tax base, such as less work or more tax evasion, ultimately reducing the total revenue collected. It highlights the incentive effect of taxation on economic activity, much like a farmer finding the 'sweet spot' for milking a cow to yield the most milk.
Students often think that higher tax rates always mean higher tax revenue, but the Laffer curve suggests that beyond a certain point, higher rates can reduce revenue due to disincentives and evasion.
When drawing the Laffer curve, always indicate the 0% and 100% tax rates where revenue is zero, as well as the 'optimum' rate where revenue is maximised. Discuss its usefulness and validity, noting empirical evidence challenges.
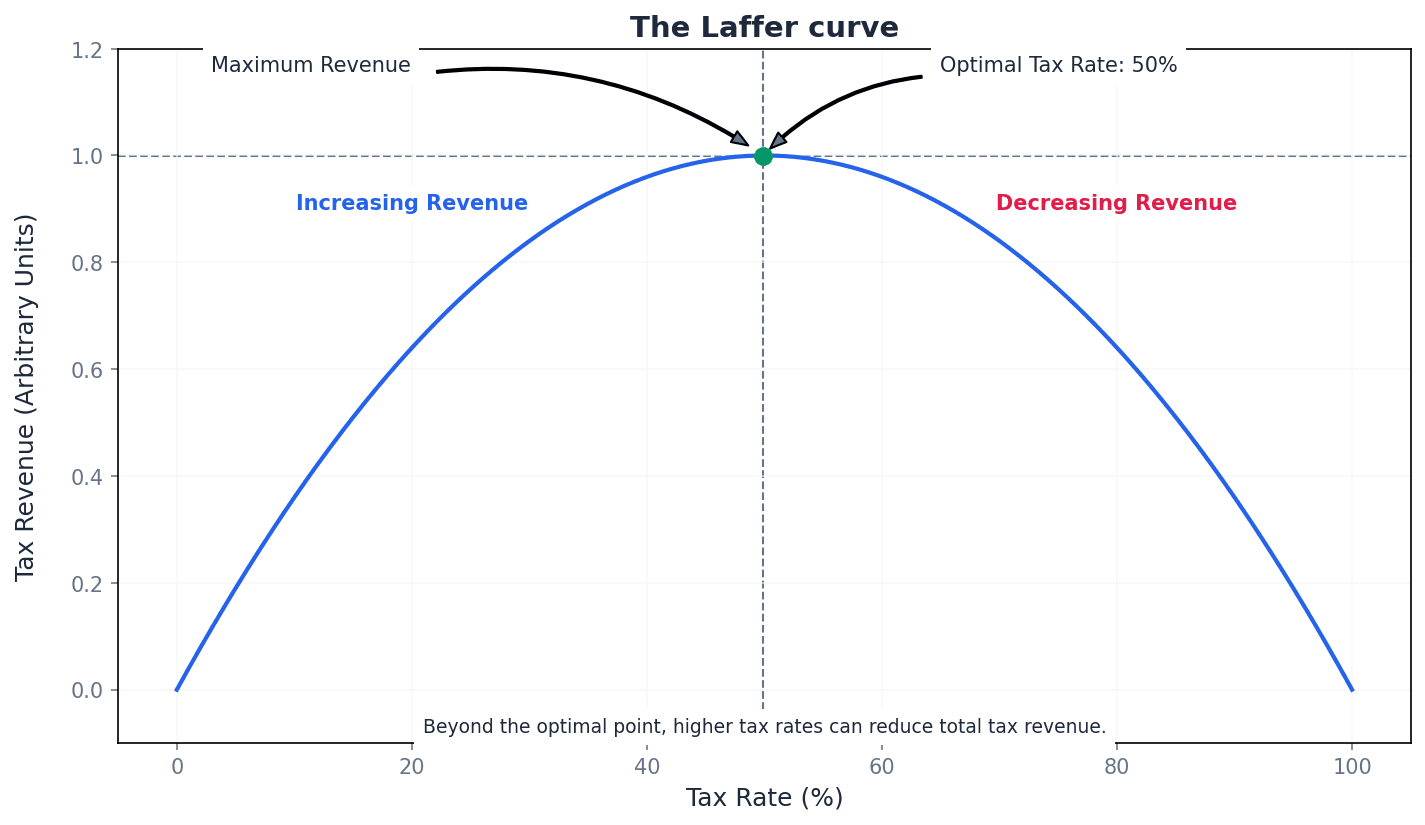
Crowding out — Crowding out occurs when higher government spending, financed by increased borrowing, reduces funds available to lend to the private sector and drives up the rate of interest, thereby reducing private sector consumption and investment.
New classical economists argue that increased public sector borrowing competes with private sector demand for loanable funds, leading to higher interest rates. These higher rates then deter private investment and consumption, offsetting the initial boost from government spending. It's like a large fishing boat (government) catching many fish, leaving fewer for smaller boats (private sector).
Students often think that any increase in government spending automatically boosts aggregate demand, but crowding out suggests that it can displace private sector spending, potentially limiting the net increase.
Crowding in — Crowding in is the view that higher government spending will raise GDP by a multiple amount, increasing saving which provides funds for lending, and encouraging a rise in consumption and investment.
Keynesians argue that in an economy with spare capacity, increased government spending boosts aggregate demand and income. This higher income leads to increased saving, which can then finance both public and private sector investment without necessarily raising interest rates or displacing private spending. It suggests that public spending can stimulate private activity, much like a small push can make a snowball grow larger.
Students often think that government spending always competes with private investment, but crowding in suggests that in certain economic conditions, government spending can stimulate and encourage private investment.
When evaluating fiscal policy, explain the mechanism of crowding out (borrowing -> interest rates -> private investment/consumption) and contrast it with the Keynesian view of crowding in. When discussing the impact of fiscal policy, present both crowding out and crowding in arguments, explaining the conditions under which each might occur (e.g., full employment vs. spare capacity).
Liquidity trap — A liquidity trap occurs when a reduction in the interest rate has little impact on economic activity because interest rates are already very low, and people prefer to hold cash rather than invest or lend.
In a liquidity trap, conventional monetary policy (lowering interest rates) becomes ineffective because consumers and investors are pessimistic about the future and hoard money. Even with abundant liquidity in the banking system, lending and investment do not increase, limiting the central bank's ability to stimulate the economy. It's like trying to push a car that's already at the bottom of a very steep hill; no matter how hard you push, it won't roll further.
Students often think that lowering interest rates always stimulates borrowing and spending, but in a liquidity trap, people may prefer to hold cash, making further rate cuts ineffective.
Explain that quantitative easing is often adopted when interest rates are already low and the economy is in a potential liquidity trap, as it aims to bypass the commercial banks' reluctance to lend.
Government macroeconomic failure — Government macroeconomic failure occurs when government macroeconomic policy measures actually cause a deterioration, rather than an improvement, in economic performance.
This can arise from various factors such as miscalculating the multiplier effect, significant time lags in policy implementation and effect, unexpected responses from households and firms, political motivations like winning elections, or the influence of pressure groups and corruption. It highlights the challenges in achieving desired macroeconomic outcomes through policy intervention, similar to a doctor prescribing medicine that unexpectedly worsens a patient's condition.
Students often think that government intervention always improves economic outcomes, but government failure highlights instances where policies can worsen economic performance.
When asked to discuss government failure, provide specific reasons such as time lags (recognition, implementation, behavioural), miscalculation of multipliers, political motivations, and external influences like pressure groups or corruption.
Fiscal policy, involving government spending and taxation, aims to influence aggregate demand. Its effectiveness in achieving objectives like economic growth and low unemployment can be limited by factors such as crowding out, where increased government borrowing raises interest rates and reduces private investment. Conversely, in an economy with spare capacity, crowding in suggests government spending can stimulate private activity. Unexpected responses from households and firms, along with significant time lags, can also hinder its success.
Monetary policy, primarily through interest rate adjustments, aims to control inflation, stimulate growth, and manage unemployment. Its effectiveness can be constrained by a liquidity trap, where very low interest rates fail to stimulate borrowing and spending due to low confidence. Time lags, how commercial banks respond, and the influence of changes in other countries also impact its success. Unexpected responses and demand/supply-side shocks can further complicate its application.
Supply-side policies, both market-based (e.g., deregulation) and interventionist (e.g., infrastructure spending), aim to increase the long-run aggregate supply of an economy. These policies focus on improving productivity, efficiency, and the flexibility of markets. While they can lead to sustainable economic growth and lower unemployment in the long run, they typically suffer from significant time lags before their effects are fully realised.
Exchange rate policy can be used to influence the balance of payments, economic growth, and price stability. For instance, a depreciation aims to make exports cheaper and imports more expensive, potentially improving the current account. However, its success depends crucially on the price elasticity of demand for imports and exports, as described by the Marshall-Lerner condition. Speculation, the objectives of other countries, and the availability of foreign currency can also affect its effectiveness.
International trade policy involves measures like tariffs, quotas, and subsidies to influence a country's trade flows. These policies can be used to protect domestic industries, improve the balance of payments, or promote economic growth. However, they can also lead to retaliation from other countries, reduce consumer choice, and hinder overall global economic efficiency. The effectiveness of such policies is often debated, as seen in the case of Colombia's changing international trade policy.
Macroeconomic policy objectives often conflict with each other. For example, expansionary demand-side policies designed to boost economic growth and lower unemployment can lead to higher inflation and a worsening balance of payments. Similarly, policies aimed at redistributing income might disincentivise work, conflicting with economic growth objectives. The number of available policy tools can also limit the ability to achieve multiple conflicting objectives simultaneously.
Government macroeconomic failure occurs when policy interventions worsen economic performance. This can stem from miscalculating the size of the multiplier effect, significant time lags between policy implementation and effect, or unexpected responses from economic agents. Political motivations, such as the desire to win elections, and the influence of pressure groups or corruption can also lead to suboptimal policy choices and outcomes.
Always use evaluation triggers like 'it depends on...'. For example, 'The effectiveness of fiscal policy depends on the initial state of the economy and the extent of crowding out.' For any policy, explicitly discuss the time lags involved. Contrast the long implementation and effect lags of supply-side policy with the shorter lags of monetary policy. Structure evaluation paragraphs around limitations and trade-offs. For each policy, consider its impact on all four major objectives: growth, unemployment, inflation, and the balance of payments. When discussing fiscal policy, always analyse both the potential for a positive multiplier effect and the negative risk of crowding out for a balanced argument. Distinguish between different types of policy. Instead of 'supply-side policy', specify 'market-based' (e.g., deregulation) or 'interventionist' (e.g., infrastructure spending) to show detailed knowledge. Link concepts together. For instance, connect expansionary fiscal policy to potential demand-pull inflation and a worsening current account deficit.
Advantages & Disadvantages
Fiscal Policy (Expansionary)
Monetary Policy (Lowering Interest Rates)
Evaluation Starters
Essay Structure Guide
Introduction
Begin by defining macroeconomic objectives and briefly outlining the range of policy options available. State your argument regarding the overall effectiveness, acknowledging that it is complex and depends on various factors.
Conclusion
Summarise your main arguments, reiterating that the effectiveness of macroeconomic policies is highly conditional. Emphasise the importance of considering the specific economic context, potential conflicts between objectives, and the inherent challenges that can lead to government failure. Offer a final, balanced judgment on the overall effectiveness of policies in meeting all macroeconomic objectives.
This chapter explores the components of the balance of payments, including the current, financial, and capital accounts, and how it always balances. It evaluates various government policies—fiscal, monetary, supply-side, protectionist, and exchange rate—designed to correct balance of payments disequilibrium, distinguishing between expenditure-switching and expenditure-reducing approaches.
Direct investment — Direct investment covers the building of a factory in another country and the takeover of an existing firm in another country (debit items), or the setting up of a new plant or the takeover of a firm in the country by a foreign firm (credit items).
This involves acquiring a lasting management interest in an enterprise operating in an economy other than that of the investor, representing a long-term commitment often involving significant capital flows and job creation. For example, a large car manufacturer from Japan building a new factory in the UK is direct investment.
Students often think direct investment is just buying shares, but actually it involves gaining legal control or establishing a new physical presence, unlike portfolio investment.
When evaluating policies to attract foreign investment, distinguish between direct investment (long-term, job-creating) and portfolio investment (more volatile, financial flows).
Portfolio investment — Portfolio investment includes the purchase and sale of government bonds and shares that do not involve legal control of a firm.
This type of investment is typically for financial gain and does not grant the investor significant influence over the management of the company or government entity. It is often more liquid and short-term than direct investment, such as buying a few shares of Apple stock or a government bond from another country without intending to run the company.
Be precise in distinguishing portfolio investment from direct investment, especially when discussing the impact of interest rate changes or confidence on capital flows.
Other investments — Other investments cover shorter-term movements of financial investment including bank deposits, bank loans and inter-government loans that move between countries.
This category captures a variety of financial transactions not classified as direct or portfolio investment, often characterized by their shorter maturity or specific nature. For instance, if a British bank lends money to a French company, or an individual deposits money in a Swiss bank account, these are examples of 'other investments'.
When analysing financial account movements, remember 'other investments' can be a significant component, particularly for short-term capital flows and bank lending.
Reserve assets — Reserve assets are made up of the government’s holdings of gold, foreign exchange reserves, Special Drawing Rights (a form of international money created by the International Monetary Fund (IMF)) and changes in the country’s reserve position in the IMF.
These assets are held by the central bank to settle international debts, influence the foreign exchange rate, and provide a buffer against external shocks. Think of a country's reserve assets as its emergency savings account in different currencies and gold, used to pay international bills or stabilize its own currency's value.
Students often think an increase in reserve assets is always a credit, but actually additions to reserves are debit items because the country is 'buying' foreign assets, while reductions are credit items as it's 'selling' them.
Understand the accounting treatment of reserve assets (additions are debits, reductions are credits) and their role in managing the exchange rate and international liquidity.
Capital flight — Capital flight occurs when the country’s residents move their money from domestic to foreign banks and the countries’ firms move some production abroad.
This phenomenon is typically driven by a lack of confidence in the domestic economy's prospects, political instability, or fear of currency depreciation. It can severely reduce tax revenue, employment, and economic growth, much like people pulling their money out of a local bank and putting it into a bank in another country due to fear of economic collapse.
When discussing the consequences of a lack of confidence in an economy, link it to capital flight and its negative impacts on tax revenue, employment, and economic growth.
The Balance of Payments is a record of all economic transactions between residents of one country and the rest of the world over a period. It always balances to zero, comprising the Current Account, Financial Account, Capital Account, and Net Errors & Omissions. The Current Account records trade in goods and services, primary income (e.g., profits, interest, dividends from investments), and secondary income (e.g., remittances).
The Financial Account records transactions in financial assets and liabilities. This includes direct investment, portfolio investment, and other investments like bank deposits and loans. Changes in a country's reserve assets, held by the central bank, are also recorded here. A financial account deficit or surplus indicates the net flow of financial capital into or out of the country.
Students often confuse items that go in the primary income part of the current account with those that go in the financial account; financial investment goes in the financial account, while the income it generates goes in the primary income part.
Students often think a financial account deficit is always a problem, but it can be short-term or lead to future inflows of profits, interest, and dividends.
Governments employ various policies to address disequilibrium in the balance of payments, particularly current account deficits. These policies can be broadly categorised into expenditure-switching and expenditure-reducing policies, each with distinct mechanisms and potential side-effects. Understanding this distinction is crucial for evaluating their effectiveness.
Expenditure-switching policy — An expenditure-switching policy is any action taken by a government that is designed to persuade purchasers of goods and services, both at home and abroad, to buy more of that country’s goods and services and less of the goods and services of other countries.
These policies aim to redirect existing spending towards domestically produced goods and services without necessarily reducing the total level of spending in the economy. Examples include supply-side policies, protectionism (like tariffs on imported cars), and exchange rate adjustments (like a 'Buy Local' campaign).
Students often think expenditure-switching policies reduce total spending, but actually they aim to change the *composition* of spending, not the overall level.
Expenditure-reducing policy — An expenditure-reducing policy is any action taken by a government that is designed to reduce the total level of spending in an economy.
These policies aim to decrease aggregate demand, which in turn reduces demand for imports and may encourage domestic producers to seek export markets. Fiscal policies (like raising taxes) and monetary policies (like increasing interest rates to cool down the economy) are common examples, making people and businesses spend less overall.
Students often think expenditure-reducing policies only affect imports, but actually they also reduce domestic demand, potentially encouraging exports.
Clearly distinguish expenditure-switching from expenditure-reducing policies by focusing on whether the policy aims to change the direction of spending or the total amount of spending.
Contractionary fiscal policy, such as increasing taxes or reducing government spending, is an expenditure-reducing policy. By lowering aggregate demand, it reduces the demand for imports, thereby improving the current account balance. However, it can also lead to lower economic growth and higher unemployment.
Contractionary monetary policy, like raising interest rates, is also an expenditure-reducing policy. Higher interest rates reduce consumer and investment spending, leading to lower aggregate demand and reduced import demand. Additionally, higher interest rates can attract capital inflows, improving the financial account, but may also appreciate the currency, making exports more expensive.
Supply-side policies are a long-term expenditure-switching strategy. By improving productivity, efficiency, and international competitiveness, they make domestic goods more attractive to both domestic and foreign consumers. This can increase exports and reduce imports, leading to a sustainable improvement in the current account, though their effects are not immediate.
Protectionist policies, such as tariffs or quotas, are expenditure-switching measures designed to reduce imports by making foreign goods more expensive or less available. While they can directly improve the current account, they risk retaliation from other countries, leading to trade wars and reduced global trade, and can also reduce consumer choice and increase domestic prices.
A depreciation or devaluation of the domestic currency is an expenditure-switching policy. It makes exports cheaper for foreign buyers and imports more expensive for domestic consumers, thereby encouraging exports and discouraging imports. This can improve the current account, but its effectiveness depends on the price elasticity of demand for exports and imports (the Marshall-Lerner condition) and can also lead to imported inflation.
When discussing policies, always start by defining whether they are expenditure-switching or expenditure-reducing to demonstrate clear understanding.
Use a clear chain of analysis. For example: 'Higher interest rates → reduce consumer spending → lower aggregate demand → reduced demand for imports → improves the current account balance.'
Always evaluate the side-effects of policies. For instance, protectionism can lead to retaliation, while expenditure-reducing policies can cause unemployment.
Advantages & Disadvantages
Contractionary Fiscal Policy (Expenditure-Reducing)
Contractionary Monetary Policy (Expenditure-Reducing)
Evaluation Starters
Essay Structure Guide
Introduction
Begin by defining the balance of payments and explaining what constitutes a disequilibrium (e.g., a persistent current account deficit). Briefly state the range of policies available to correct this, categorising them into expenditure-switching and expenditure-reducing.
Conclusion
Summarise the main arguments, reiterating that correcting balance of payments disequilibrium often involves trade-offs. Provide a final, justified judgment on the most appropriate policy approaches, emphasising the need for careful consideration of both internal and external economic conditions.
This chapter explores how exchange rates are measured and determined under various systems, including fixed, managed, and floating rates. It differentiates between revaluation and devaluation and analyses the causes and effects of exchange rate changes on the external economy, particularly using the Marshall–Lerner condition and J-curve analysis.
nominal foreign exchange rate — The nominal foreign exchange rate is the price of one currency in terms of another currency.
This is the direct quotation of how much one currency can buy of another, without adjusting for price level changes. It is the most straightforward measure of a currency's value in international markets, like seeing '1 US dollar = 160 Pakistani rupees' on a currency exchange board.
Students often think the nominal exchange rate fully reflects competitiveness, but actually it doesn't account for inflation, which can significantly impact a country's export prices.
real exchange rate — A real exchange rate takes price changes as well as exchange rate changes into account to assess changes in the competitiveness of a country’s products in global markets.
This measure provides a more accurate picture of international price competitiveness by adjusting the nominal exchange rate for relative inflation rates between countries. A higher real exchange rate means a country's products are relatively more expensive, comparing the actual purchasing power of money in different countries.
Real exchange rate
Used to assess changes in the competitiveness of a country’s products in global markets, taking into account price changes.
When calculating the real exchange rate, remember to use the formula provided and clearly state whether the currency is overvalued or undervalued based on the result. Explain the implications for international competitiveness.
Students often confuse nominal exchange rates with real exchange rates, failing to account for inflation when assessing competitiveness.
trade-weighted exchange rate — A trade-weighted exchange rate is a measure, in index form, of the price of a currency against a basket of currencies.
This index provides a general impression of a currency's overall change in value by considering its value against multiple trading partners' currencies, weighted by the importance of trade with each partner. It gives a more comprehensive view than a bilateral exchange rate, like an average grade across subjects weighted by importance.
When explaining trade-weighted exchange rates, ensure you mention both the 'basket of currencies' and the 'weighting according to relative importance of trade' to achieve full marks. Provide an example of how weighting works.
Exchange rates are determined under three main systems: fixed, managed, and floating. Each system has distinct mechanisms for how the value of a currency is set and maintained, influencing how changes in the exchange rate occur.
In a fixed exchange rate system, a government or central bank pegs its currency's value to another currency or a basket of currencies. To maintain this fixed rate, the central bank must intervene in the foreign exchange market by buying or selling foreign currency reserves. This system offers certainty but requires significant reserve holdings.
devaluation — A reduction in the value of a fixed exchange rate to a lower level is known as devaluation.
This is a deliberate policy decision by a government to lower the official fixed value of its currency. It is typically done to improve international competitiveness, reduce a current account deficit, or stimulate economic growth, like a government officially cutting the price of its currency.
revaluation — A revaluation occurs when the government raises the exchange rate to a new, higher fixed rate.
This is a deliberate policy decision by a government to increase the official fixed value of its currency. It might be undertaken to combat inflation by making imports cheaper or to reduce a persistent current account surplus, like a government officially increasing the price of its currency.
Students often confuse devaluation with depreciation, but actually devaluation refers specifically to a government-mandated reduction in a fixed exchange rate, while depreciation is a market-driven fall in a floating rate.
When discussing devaluation, clearly state that it applies to a fixed exchange rate system and explain the reasons for such a policy decision, such as improving competitiveness or addressing a current account deficit.
A managed float system combines elements of both fixed and floating exchange rates. The currency's value is generally allowed to fluctuate according to market forces, but the central bank may intervene periodically to smooth out excessive volatility or guide the rate towards a desired range. This offers some flexibility while retaining a degree of control.
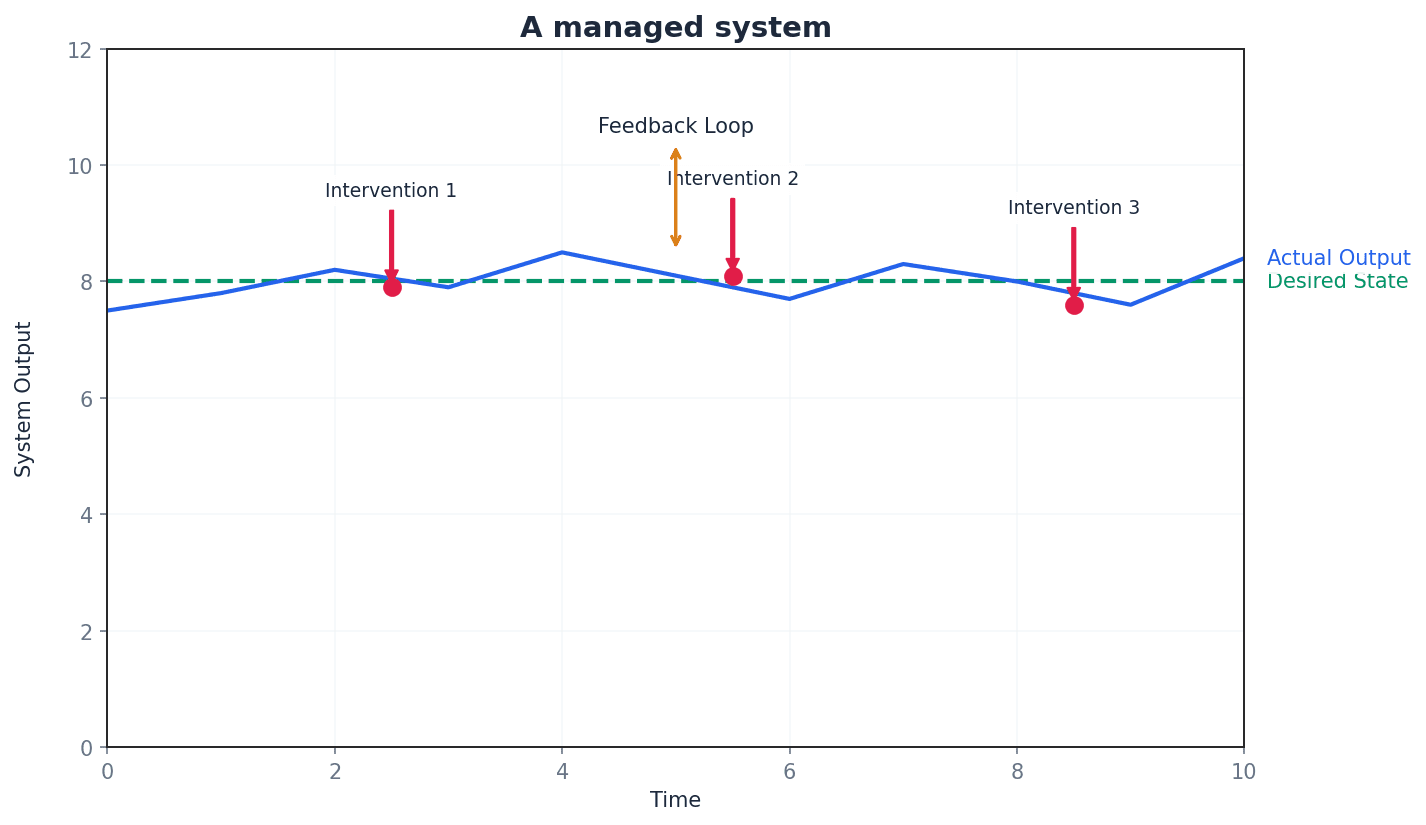
Changes in exchange rates significantly impact a country's external economy, affecting the price of exports and imports, and consequently the current account balance. The effectiveness of these changes depends on various factors, including the price elasticities of demand for exports and imports and the time lags involved.
Marshall–Lerner condition — The requirement for the combined elasticities to exceed 1 for the trade balance, and so the current account balance, to be improved by a change in the exchange rate is known as the Marshall–Lerner condition.
This condition states that for a devaluation (or depreciation) to improve a country's current account balance, the sum of the price elasticity of demand for exports and the price elasticity of demand for imports must be greater than one. If met, the positive effect on export revenue and negative effect on import expenditure will outweigh initial price changes, like needing a proportionally large increase in sales to offset a price cut.
Students often think any devaluation will improve the current account, but actually it only works if the Marshall-Lerner condition is met, meaning demand for exports and imports is sufficiently elastic.
J-curve effect — In some cases, a fall in the exchange rate will actually worsen the current account position before it starts to improve it.
This effect describes the typical time lag in the response of trade flows to an exchange rate change. In the short run, demand for imports and exports may be inelastic, leading to an initial deterioration of the current account before it improves as demand becomes more elastic over time, like a large ship initially continuing its old course after the wheel is turned.
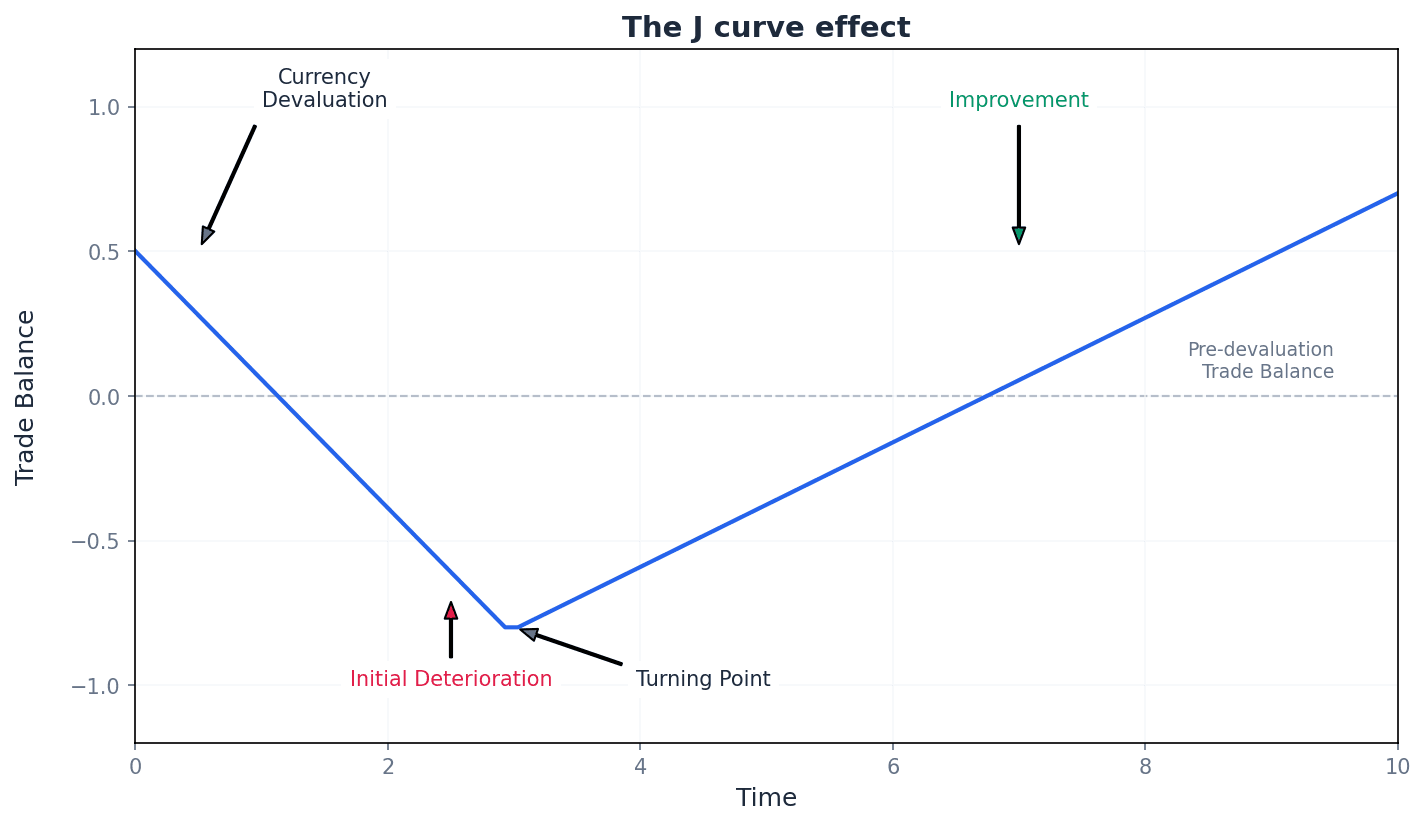
Students may not understand that the J-curve effect explains the short-run deterioration of the current account before long-run improvement after a devaluation.
When explaining the J-curve effect, it is crucial to draw the diagram and clearly label the axes and the curve's path. Emphasise the role of time and the changing elasticities of demand for exports and imports.
In any analysis, first identify the exchange rate system (fixed/floating) to use the correct terminology (devaluation/depreciation).
When evaluating the effect of an exchange rate change on the trade balance, always bring in the Marshall-Lerner condition and the J-curve effect to provide a balanced argument.
Advantages & Disadvantages
Fixed Exchange Rate System
Floating Exchange Rate System
Evaluation Starters
Essay Structure Guide
Introduction
Begin by defining exchange rates and briefly outlining the different systems (fixed, managed, floating). State the main arguments you will explore regarding the causes and effects of exchange rate changes, particularly on the external economy.
Conclusion
Summarise your main arguments, reiterating the complexities and interdependencies involved in exchange rate determination and their effects. Offer a final judgment on the overall effectiveness and implications of exchange rate changes for a country's external economy.
This chapter explores how economies are classified by development and national income, evaluating various indicators of living standards and economic development, including monetary, non-monetary, and composite measures. It also introduces the Kuznets curve, which describes the relationship between economic development and income inequality, and discusses the complexities of comparing economic growth rates and living standards over time and between countries.
Developed economies — Developed economies are usually taken to be those with a high income per head, a range of well-established economic institutions, advanced technological infrastructure and a strong tertiary sector.
These economies typically have diversified industries, high productivity, and high standards of living. They serve as a benchmark for economic progress and often provide aid or investment to developing nations, much like a fully grown, mature tree with deep roots and many branches, producing abundant fruit.
Students often think developed economies have no problems, but actually they still face challenges like income inequality, environmental issues, and economic stagnation.
Developing countries — Developing countries are thought to have lower income per head, reliance on fewer products, a larger primary sector and lower productivity.
These countries are often in the process of industrialisation and economic diversification, aiming to improve living standards and reduce poverty. They may face challenges such as limited infrastructure and institutional weaknesses, similar to young saplings still growing and establishing their roots, with potential for future growth but currently more vulnerable and less productive than mature trees.
Students often think all developing countries are the same, but actually there is significant diversity in their income levels, growth rates, and development challenges.
When comparing 'developed' and 'developing' economies, avoid generalisations and acknowledge the heterogeneity within the 'developing' category, perhaps by mentioning specific examples.
Economies are broadly classified based on their level of development and national income. Developed economies are characterised by high income per head, advanced infrastructure, and a strong tertiary sector, while developing countries typically have lower income per head, a larger primary sector, and lower productivity. This classification helps in understanding the different economic structures and challenges faced by nations.
Poverty cycles — Poverty cycles are patterns where low income leads to factors that perpetuate low income, such as low savings, low investment, low capital accumulation, low human capital, and low productivity.
These cycles illustrate how a lack of resources in one area can create a chain reaction that prevents economic improvement, making it difficult for individuals or countries to escape poverty without external intervention. It's like a car stuck in mud: the wheels spin (low income), but without traction (investment/human capital), it just digs itself deeper (perpetuating poverty) instead of moving forward.
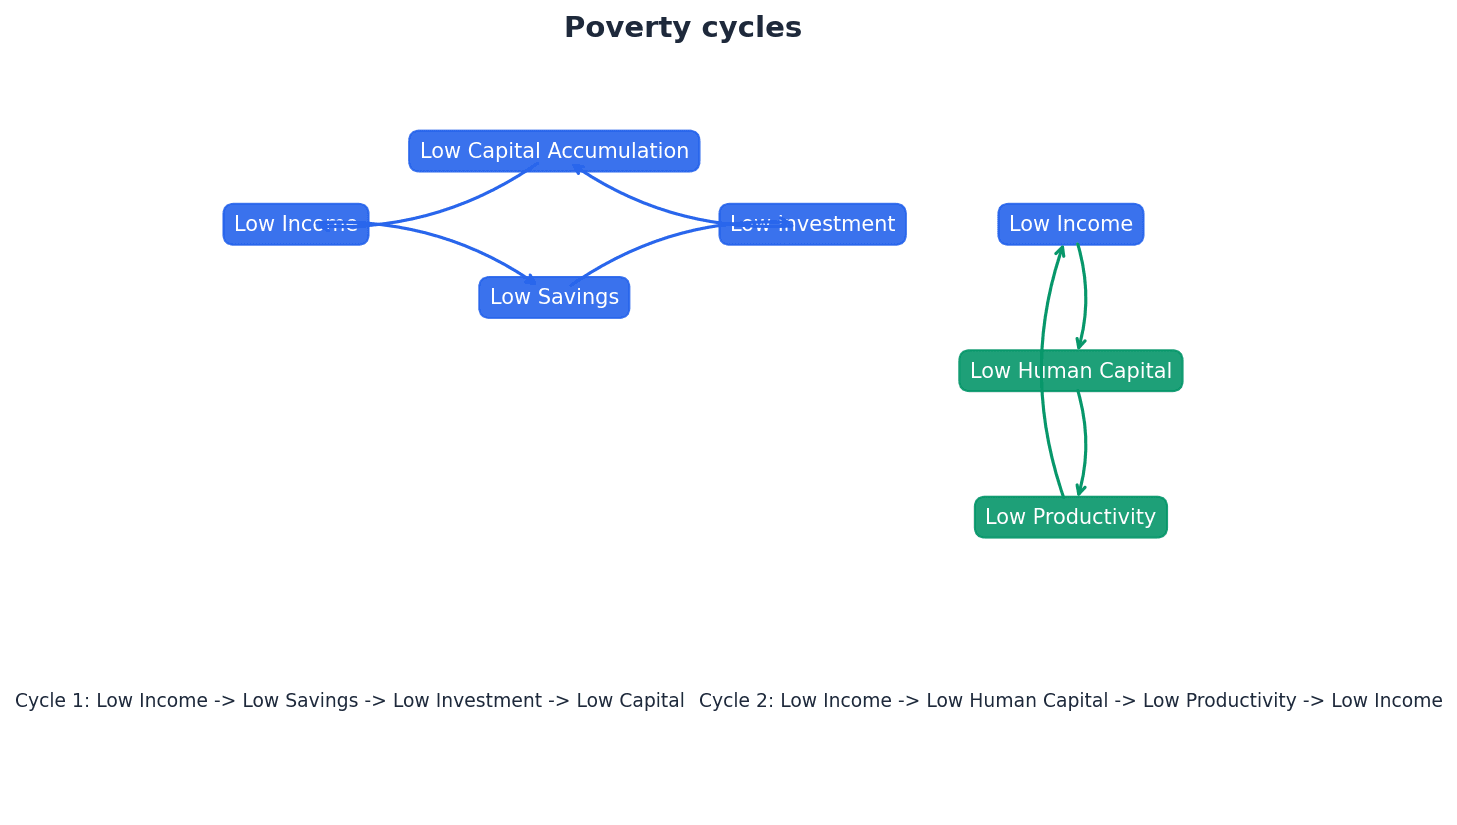
When explaining poverty cycles, use a clear cause-and-effect chain, linking specific factors like 'low savings' to 'low investment' and ultimately back to 'low income' to show the cyclical nature.
Evaluating living standards and economic development requires considering various indicators beyond just monetary measures like real per capita national income. Non-monetary indicators, such as literacy rates or access to clean water, provide additional insights. Composite indicators combine multiple factors to offer a more holistic view of welfare and development.
Human Development Index (HDI) — The Human Development Index (HDI) is a composite measure of economic development that takes into account GNI per head, education (expected and mean years of schooling) and health care (life expectancy).
It provides a broader view of welfare than income alone, recognising that people's well-being is influenced by their ability to lead a long and healthy life and acquire knowledge. Countries are ranked and categorised into development levels, much like measuring a student's overall academic performance, including attendance, participation, and health, giving a more complete picture of their potential.
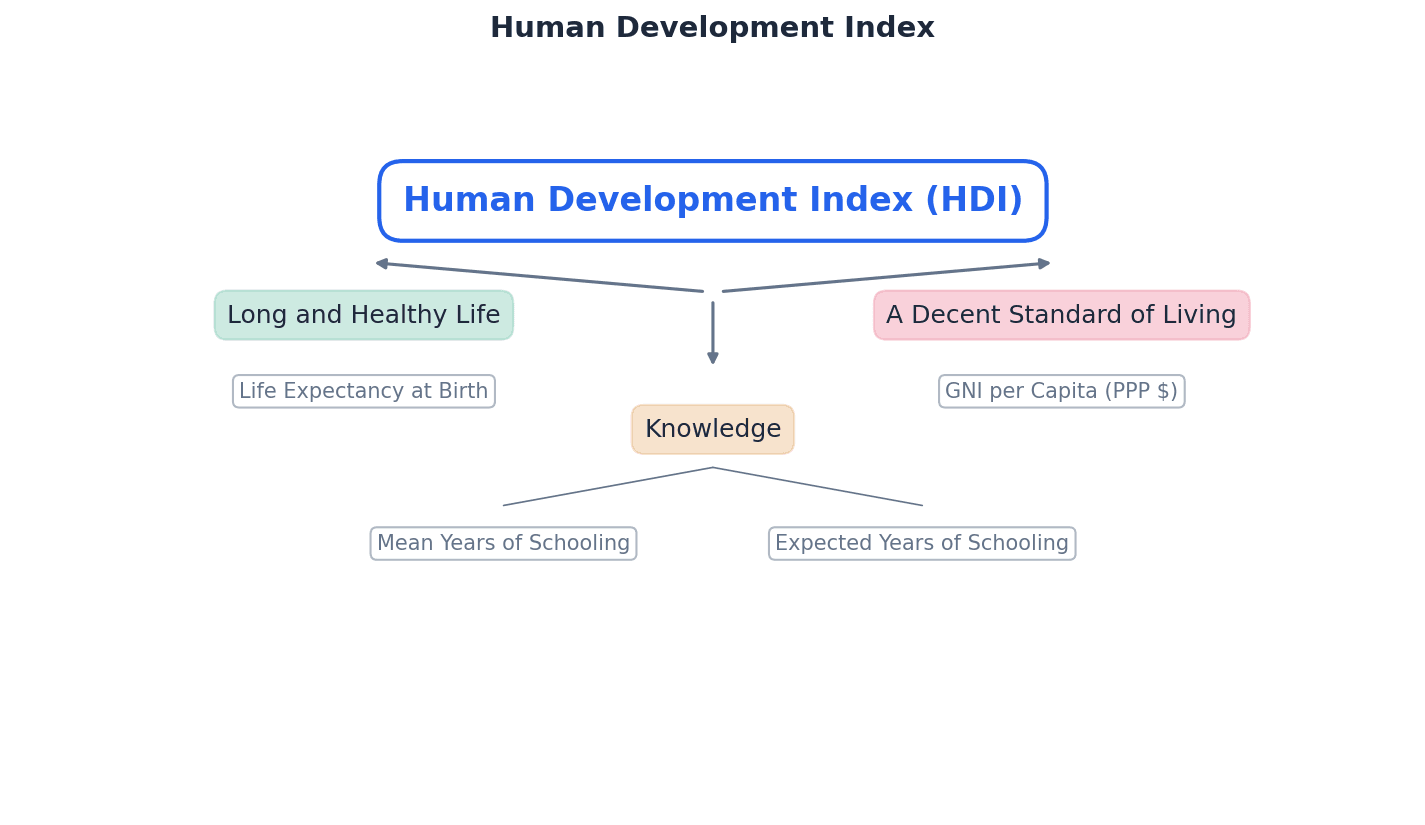
Students often think HDI directly measures healthcare quality, but actually it uses life expectancy as an indicator of health outcomes, which is influenced by healthcare among other factors.
When evaluating HDI, remember to mention its components explicitly and discuss how a country's HDI ranking might differ from its GNI per head ranking, providing examples if possible.
Measurable Economic Welfare (MEW) — Measurable Economic Welfare (MEW) is a composite measure that adjusts GDP figures to take into account factors that improve living standards (like increased leisure time) and factors that reduce living standards (like environmental damage).
Developed by Nordhaus and Tobin, MEW aims to provide a fuller picture of living standards by incorporating non-marketed goods and services and negative externalities, which GDP alone does not capture. It's like also considering how much free time people have, how clean their home is, and the value of unpaid chores, giving a more accurate sense of well-being, beyond just counting money spent.
Students often think MEW is easy to calculate, but actually measuring the value of non-marketed goods and services and environmental damage is difficult and expensive in practice.
When discussing MEW, highlight both its advantages (more comprehensive) and its limitations (measurement difficulties) to demonstrate a balanced understanding.
Multidimensional Poverty Index (MPI) — The Multidimensional Poverty Index (MPI) is a composite measure that assesses poverty based on indicators of living standards (cooking fuel, sanitation, drinking water, electricity, housing, assets), education (years of schooling, school attendance) and health (child mortality, nourishment).
It identifies poverty at the household level, considering a household multidimensionally poor if deprived in at least 33% of weighted indicators. This helps governments target specific areas of deprivation, similar to checking if a family lacks clean water, electricity, and school attendance, giving a detailed 'deprivation profile' beyond just low income.
When explaining MPI, clearly state the three main dimensions (health, education, living standards) and give examples of indicators within each, as well as the threshold for being considered multidimensionally poor.
Kuznets curve — The Kuznets curve is a U-shaped curve that suggests that as an economy develops, income becomes more unevenly distributed, and then after a certain income level is reached, income becomes more evenly distributed.
The initial rise in inequality is attributed to the movement of labour from low-paid agricultural jobs to higher-paid manufacturing jobs during early industrialisation. The subsequent fall in inequality is theorised to occur with further development and policy interventions, like a seesaw that initially goes up on one side as some people move to better jobs, but eventually levels out as more people gain skills and policies are implemented.
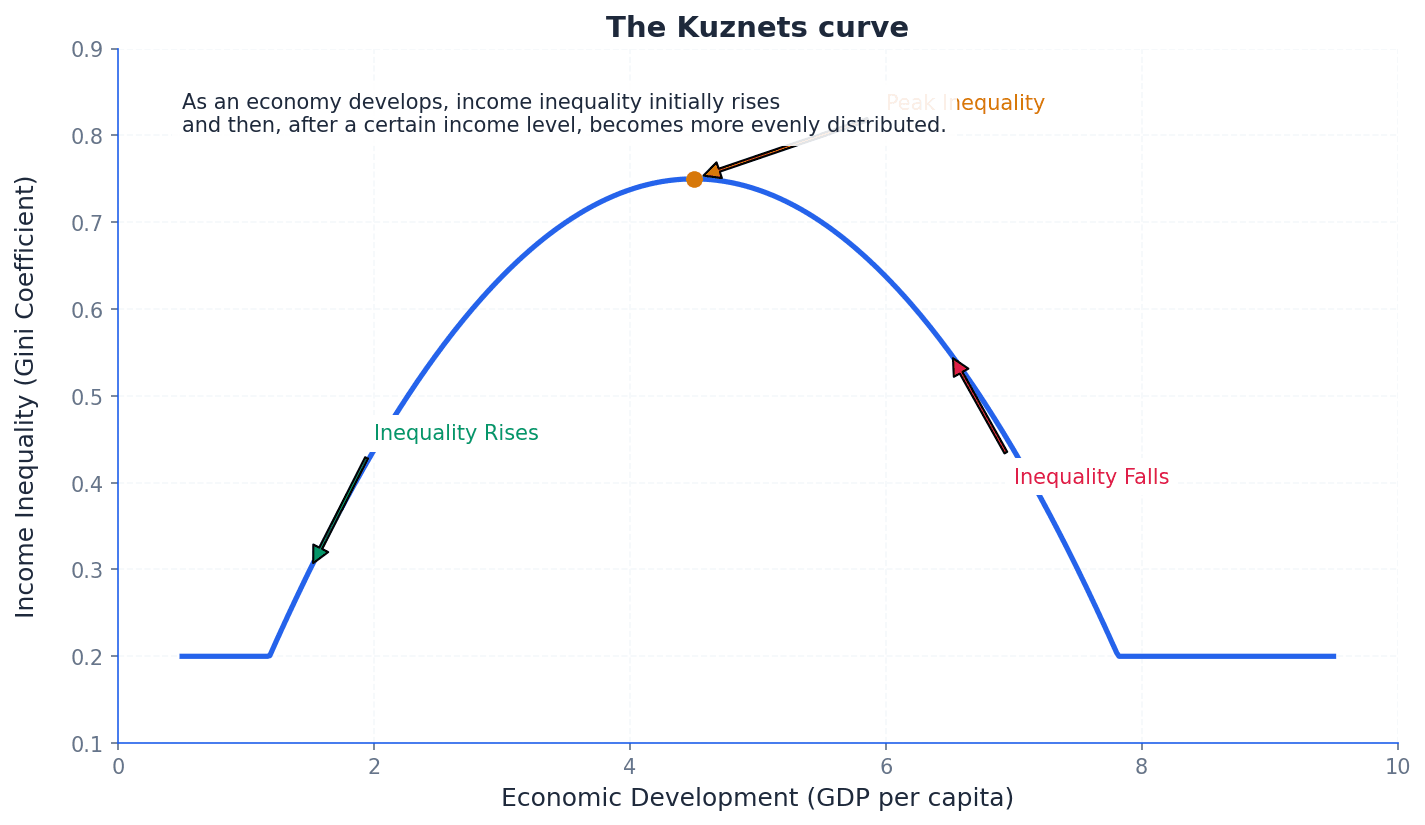
Students often think the Kuznets curve is a universal law, but actually it is a hypothesis that is not always followed, and some high-income economies still experience rising inequality.
When discussing the Kuznets curve, explain the reasons for both the initial rise and subsequent fall in inequality, and critically evaluate its applicability by mentioning exceptions or limitations.
Comparing economic growth rates and living standards over time and between countries presents several complexities. Issues such as the existence of a shadow economy, data inaccuracies, and differences in what is produced can distort official figures. Therefore, careful consideration and adjustment methods are necessary for accurate comparisons.
Shadow economy — The shadow economy refers to undeclared economic activity, also known as the hidden or underground economy, where income is not reported to authorities, often to evade tax or because the activity is illegal.
This activity is not included in official GDP, GNI, or NNI figures, leading to an understatement of true economic output and making accurate comparisons of economic growth rates difficult, especially internationally. It's like an iceberg: the official economy is the visible part above water, while the shadow economy is the much larger, hidden part beneath the surface that is not easily measured.
When analysing the impact of the shadow economy, explain how it distorts economic growth figures and international comparisons, and mention factors that influence its size, such as tax rates and social attitudes.
Purchasing power parities (PPPs) — Purchasing power parities (PPPs) are exchange rates adjusted to take into account the relative purchasing power of currencies, allowing for a more accurate comparison of living standards between countries.
They compare the price of a common basket of goods and services in different countries, providing a conversion factor that reflects how much goods and services a currency can buy, rather than just its market exchange rate. For example, comparing how many Big Macs you can buy with $10 in New York versus 1000 yen in Tokyo uses a simplified PPP to see what your money is actually 'worth' in terms of goods.
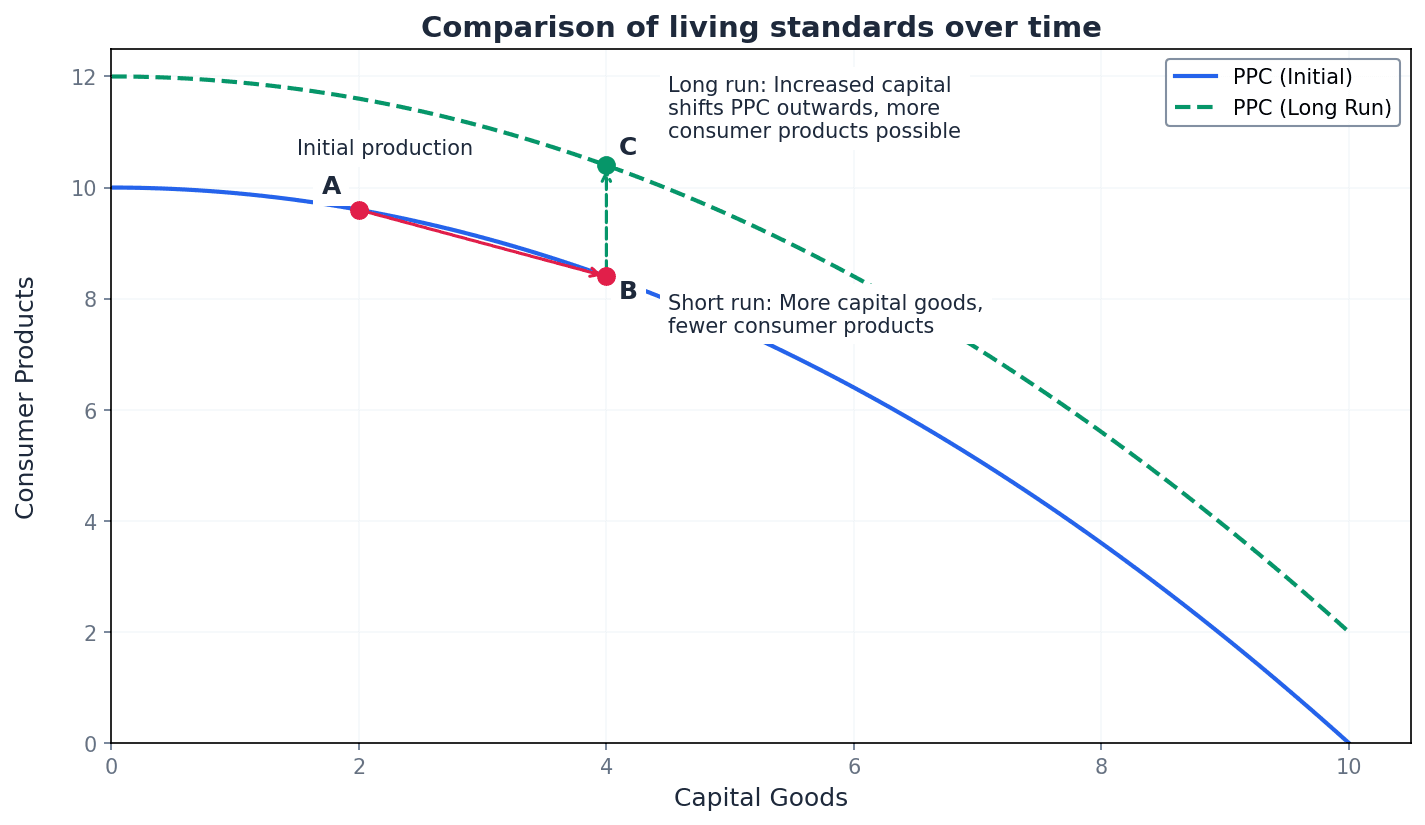
Students often think market exchange rates are sufficient for comparing living standards, but actually PPPs are necessary because market exchange rates don't account for differences in the cost of living.
When explaining PPPs, always include a numerical example to illustrate how using market exchange rates can exaggerate or understate real differences in purchasing power between countries.
Always distinguish between 'economic growth' (increase in real GDP) and 'economic development' (a broader measure of welfare including health and education).
Advantages & Disadvantages
Using GDP per capita as an indicator of living standards
Using the Human Development Index (HDI)
Evaluation Starters
Essay Structure Guide
Introduction
Begin by defining economic development and briefly outlining the range of indicators used to measure it. State your argument regarding the effectiveness of different indicators or the complexities of comparison.
Conclusion
Summarise your main arguments, reiterating the strengths and weaknesses of various development indicators and the challenges in making accurate comparisons. Conclude with a nuanced statement on the importance of using a range of measures to gain a comprehensive understanding of economic development and living standards.
This chapter explores the characteristics of countries at different levels of development, focusing on population dynamics, income distribution, and economic structure. It explains how key demographic indicators are measured and their causes of change, introduces the concept of optimum population, and details how income distribution is measured using the Gini coefficient and Lorenz curves. The chapter also examines how employment composition shifts across primary, secondary, and tertiary sectors as economies develop, impacting trade patterns.
birth rate — The birth rate is the number of live births per thousand of the population in one year.
It is calculated by dividing the number of live births by the population and then multiplying by 1000. This is sometimes called the crude birth rate as it provides basic information without details like the age of those giving birth. Imagine a town of 1000 people; if 15 babies are born in a year, the birth rate is 15. It's like counting how many new seedlings sprout in a garden per 1000 existing plants.
death rate — The death rate is the number of deaths per thousand of the population in one year.
This rate includes deaths of children under one year old, though infant mortality is also measured separately. If the birth rate exceeds the death rate, a country experiences a natural increase in population. In a town of 1000 people, if 10 people die in a year, the death rate is 10. It's like counting how many plants in a garden die per 1000 existing plants.
net migration — Net migration occurs when immigration into a country is greater than emigration out of the country, resulting in a positive change in population due to external movement.
It is the difference between the number of people entering a country (immigrants) and the number of people leaving a country (emigrants). Positive net migration adds to a country's population, while negative net migration reduces it. If a school has 50 new students join and 30 students leave in a year, the net migration is +20 students. It's the overall change in population from people moving in and out.
Birth Rate
Measures live births per thousand of the population in one year.
Students often confuse birth rate with fertility rate; birth rate is births per thousand population, while fertility rate is average children per woman.
When asked to 'explain' the birth rate, ensure you include both its definition (number of live births per thousand) and how it is calculated, as this demonstrates full understanding.
When analysing population changes, remember to consider both the death rate and the birth rate to determine the natural increase or decrease, rather than just one in isolation.
When discussing population changes, ensure you distinguish between natural increase (births minus deaths) and net migration, as both contribute to the overall population change and are often tested separately.
Population change is determined by the birth rate, death rate, and net migration. As countries develop, there are typically changes in these demographic indicators. For instance, improved healthcare and living standards often lead to falling death rates and infant mortality, while economic development and urbanisation can influence birth rates. The overall population growth and structure are crucial characteristics of a country's development level.
optimum population — The optimum population is said to exist when output per head is the greatest, given existing quantities of the other factors of production and the current state of technical knowledge.
Below this level, a country is underpopulated, experiencing increasing returns as population grows and makes better use of resources. Beyond this level, a country is overpopulated, experiencing decreasing returns as the population strains resources. Imagine a farm with a fixed amount of land and machinery. There's an ideal number of workers that maximises the output per worker. Too few, and resources are underutilised; too many, and workers get in each other's way.
underpopulated — A country is described as underpopulated when its population is below the optimum level, meaning increasing returns are enjoyed as the population grows.
In an underpopulated country, an increase in population would lead to a higher output per head because the existing land and capital can be utilised more efficiently. This suggests that resources are not being fully exploited. A large, fertile field with only one farmer is underpopulated; adding more farmers would significantly increase the yield per farmer until an optimal number is reached.
overpopulated — A country is said to be overpopulated when its population is beyond the optimum level and decreasing returns are being experienced.
In an overpopulated country, an increase in population would lead to a lower output per head because the existing land and capital are strained, and additional people contribute less to overall productivity. This can lead to resource scarcity and lower living standards. A small office with too many workers trying to share limited computers and desks would be overpopulated; adding more workers would decrease the productivity per worker.
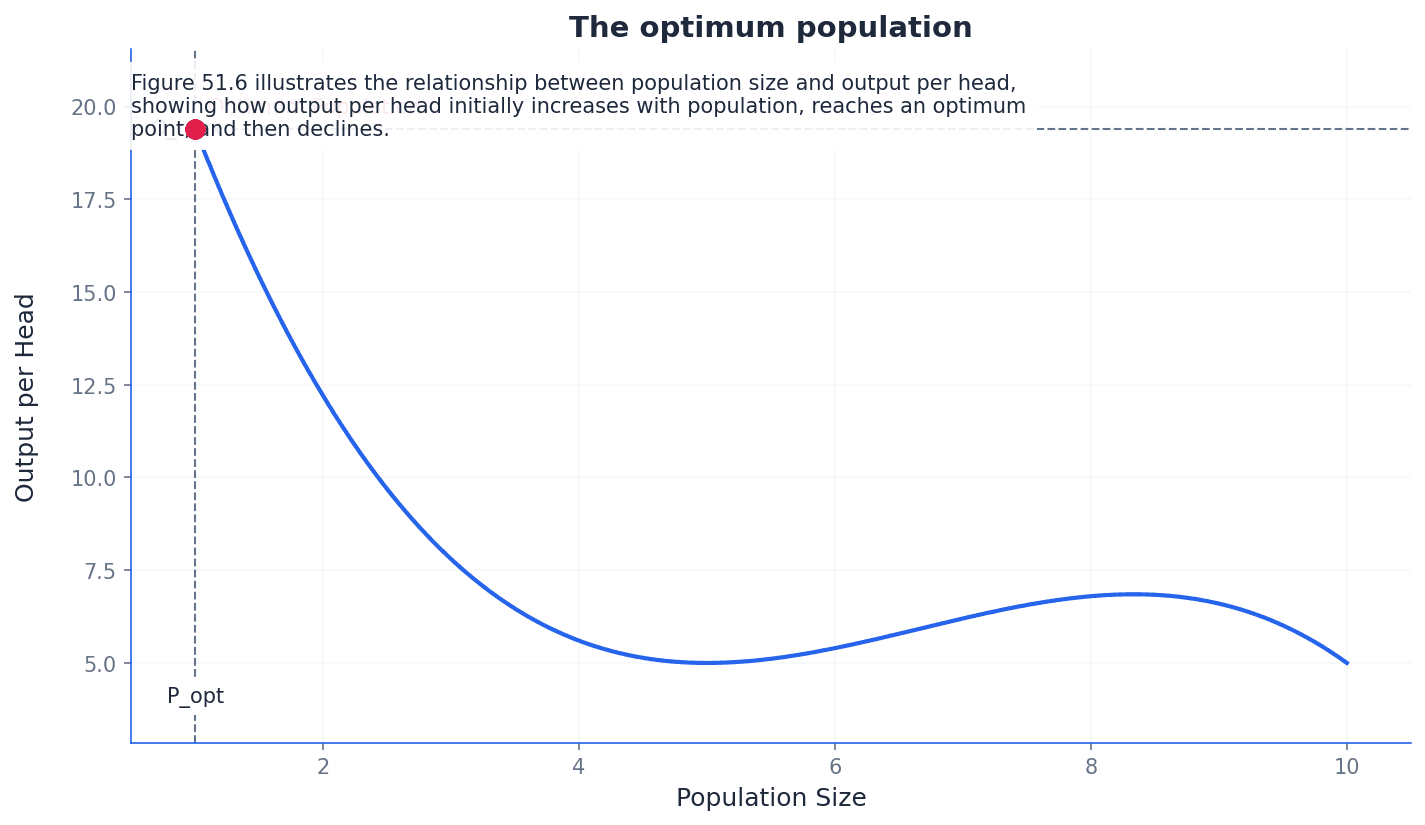
Students often think the optimum population is a fixed number, but it is dynamic and changes with improvements in technical knowledge and the quantity of other factors of production.
Students often confuse underpopulation/overpopulation with absolute population size; these terms relate to population size relative to resources and output per head.
When explaining optimum population, clearly state the conditions under which it is defined (existing factors of production, current technical knowledge) and differentiate it from underpopulation and overpopulation based on output per head.
As countries develop, the level of urbanisation typically changes. Economic development often leads to a shift of population from rural areas to urban centres in search of better employment opportunities in the secondary and tertiary sectors. This process can impact infrastructure, resource demand, and social structures within a country.
Lorenz curve — The Lorenz curve is a graphical representation of income inequality, plotting the cumulative percentage of income or wealth on the vertical axis against the cumulative percentage of the population on the horizontal axis.
A 45° diagonal line represents perfect income equality. The actual distribution is plotted as a curve, and the further this curve is from the 45° line, the more unequal the distribution of income or wealth. Think of a perfectly straight ramp (line of equality) where every step up gives you an equal share of height. The Lorenz curve is like a sagging rope hanging below the ramp, showing how much less height (income) the lower steps (poorer population) get.
Gini coefficient — The Gini coefficient is a numerical measure of the extent of income inequality, calculated by dividing the area A (between the line of equality and the Lorenz curve) by the combined areas A and B (the total area under the line of equality).
A Gini coefficient of 0 indicates perfect income equality, while a coefficient of 1 indicates complete inequality. The higher the figure, the more unequal the distribution of income. It is often expressed as a Gini Index by multiplying by 100. Imagine a perfectly flat road (equality) and a bumpy road (actual income distribution). The Gini coefficient measures how 'bumpy' the actual road is compared to the flat one, with a higher number meaning more bumps (inequality).
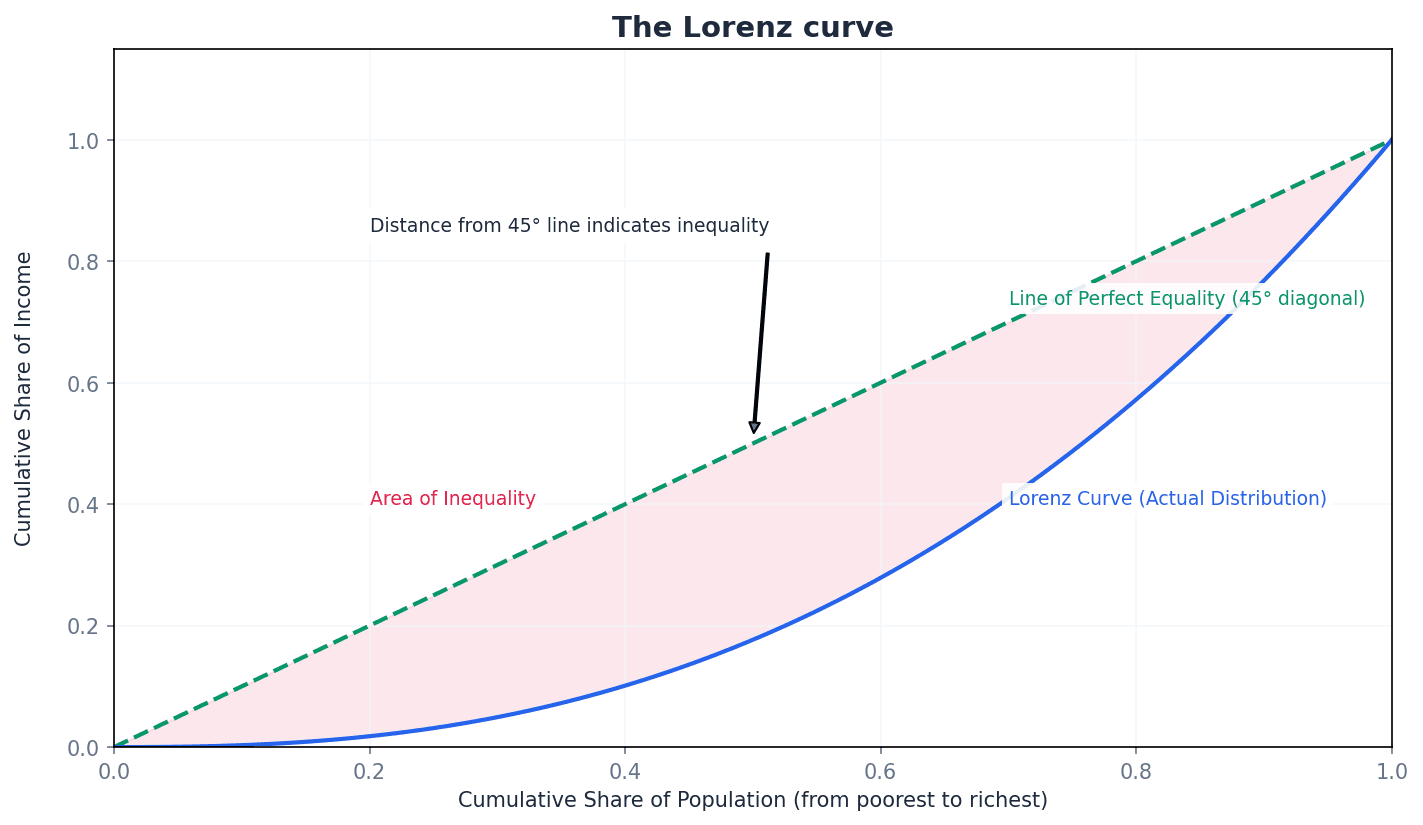
Gini Coefficient
Measures income inequality; 0 for perfect equality, 1 for complete inequality.
Students often think a Gini coefficient of 0 means no one has any income, but actually it means everyone has exactly the same income.
When drawing a Lorenz curve, ensure you label both axes correctly (cumulative percentage of population and cumulative percentage of income/wealth) and clearly draw the 45° line of equality as a benchmark for comparison.
When calculating or interpreting the Gini coefficient, remember that it ranges from 0 to 1, and a higher value signifies greater inequality. Be prepared to explain what values at the extremes (0 and 1) represent.
Income distribution is a key characteristic of a country's development level. Less developed countries often exhibit higher levels of income inequality, which can be measured and analysed using tools like the Lorenz curve and the Gini coefficient. As economies develop, there can be shifts in income distribution, though the pattern is not always linear towards greater equality.
Primary sector — The primary sector covers agriculture and the extractive industries such as oil extraction, gold mining and coal mining.
Economies with lower income per head typically have a high dependence on this sector for employment and output. A high reliance on primary products makes these economies vulnerable to natural forces and price fluctuations. This is like the 'raw materials' stage of an economy – farming, fishing, mining. It's the first step in getting resources from the earth.
Secondary sector — The secondary sector includes all manufacturing industries and the construction industry.
As an economy develops, the secondary sector often becomes a major source of employment and contribution to GDP, representing the processing of raw materials into finished goods. This stage typically follows a decline in the primary sector's dominance. This is the 'making things' stage – factories turning raw cotton into clothes, or timber into furniture, or building houses.
tertiary sector — The tertiary sector covers all service industries such as banking, education, healthcare and tourism.
Countries with high income per head and high development tend to have most of their labour force employed in this sector. As economies develop further, the tertiary sector usually makes the largest contribution to employment and GDP. This is the 'doing things for people' stage – doctors treating patients, teachers educating students, banks managing money, or tour guides showing sights.
Students often think the primary sector only includes farming, but actually it also includes all extractive industries like mining and forestry.
Students often think the secondary sector only involves large-scale factory production, but actually it also includes the construction industry.
The composition of employment shifts significantly as countries develop. Less developed economies typically have a large proportion of their workforce in the primary sector. As development progresses, there is a shift towards the secondary sector, with manufacturing becoming more prominent. Highly developed economies are characterised by a dominant tertiary (service) sector. This evolution in economic structure directly influences a country's pattern of trade, moving from exporting raw materials to manufactured goods and then to services.
In your analysis, link characteristics of development together. For example, connect high primary sector employment to low average incomes and high birth rates.
Use precise definitions. For 'optimum population', you must state it is where 'output per head is the greatest'.
Advantages & Disadvantages
High Birth Rates in Developing Countries
Dominance of the Primary Sector
Evaluation Starters
Essay Structure Guide
Introduction
Begin by defining 'economic development' and briefly outlining the key characteristics that differentiate countries at various stages of development (e.g., population dynamics, income distribution, economic structure). State the main argument or approach your essay will take.
Conclusion
Summarise the main characteristics discussed, reinforcing how they collectively define different levels of development. Conclude with a final evaluative statement on the complexity and multi-faceted nature of economic development, perhaps highlighting that these characteristics are interconnected and influence each other.
This chapter examines the complex economic relationships between countries at different stages of development, focusing on international aid, trade, and investment. It explores the various forms and impacts of aid, the role of multinational companies and foreign direct investment, and the challenges of external debt. Finally, it outlines the crucial functions of the International Monetary Fund and the World Bank in fostering global economic stability and development.
Tied aid — Aid that comes with conditions, such as requiring the recipient country to spend on products from the donor country.
This form of aid can benefit the donor country's industries by increasing demand for their exports, even if cheaper or better-quality alternatives are available elsewhere. It can also be used to influence the economic policies of the recipient government, much like a parent giving their child money for a new toy, but only if the child buys it from a specific store that the parent owns.
Untied aid — Aid given without conditions.
This allows the recipient country greater flexibility in how they use the funds, potentially enabling them to purchase goods and services from the most competitive sources globally. While it doesn't directly promote donor country exports, it can foster goodwill and long-term trade relationships, similar to receiving a gift card that can be used at any store, giving you the freedom to choose what you truly need or want.
Students often think tied aid is always beneficial for the recipient, but actually it can limit their choices and potentially force them to buy less efficient or more expensive goods from the donor country.
When evaluating tied aid, discuss both the potential benefits (e.g., ensuring funds are used for specific projects) and drawbacks (e.g., distorting markets, reducing recipient autonomy) using terms like 'opportunity cost' and 'efficiency'.
Bilateral aid — Aid given by one country to another country.
This direct form of aid often reflects specific political or economic interests between the two nations, such as promoting the donor's industries or gaining political influence. It can be tied or untied, much like a direct loan or gift from one friend to another, often with specific reasons or expectations attached to that personal relationship.
Multilateral aid — Aid given by countries to international organisations such as the World Bank or United Nations (UN) agency, which then distributes it to other countries.
This form of aid is often seen as more neutral and less politically motivated than bilateral aid, as it is administered by international bodies with broader development goals. It can fund large-scale projects and humanitarian efforts, similar to several people pooling their money into a community fund managed by a trusted committee.
Students often think bilateral aid is purely altruistic, but actually it often has underlying political or economic motives for the donor country, such as securing trade deals or diplomatic support.
When comparing tied and untied aid, use terms like 'economic efficiency' and 'recipient sovereignty' to explain why untied aid is often preferred by recipient countries, while acknowledging donor motivations for tied aid.
International aid plays a significant role in supporting development, but its effects are complex. While aid can provide crucial resources for infrastructure, health, and education, heavy reliance on it can lead to increased indebtedness for recipient countries. Furthermore, imposed policy conditions by donors may not always be suitable for local economic conditions, potentially hindering long-term sustainable growth.
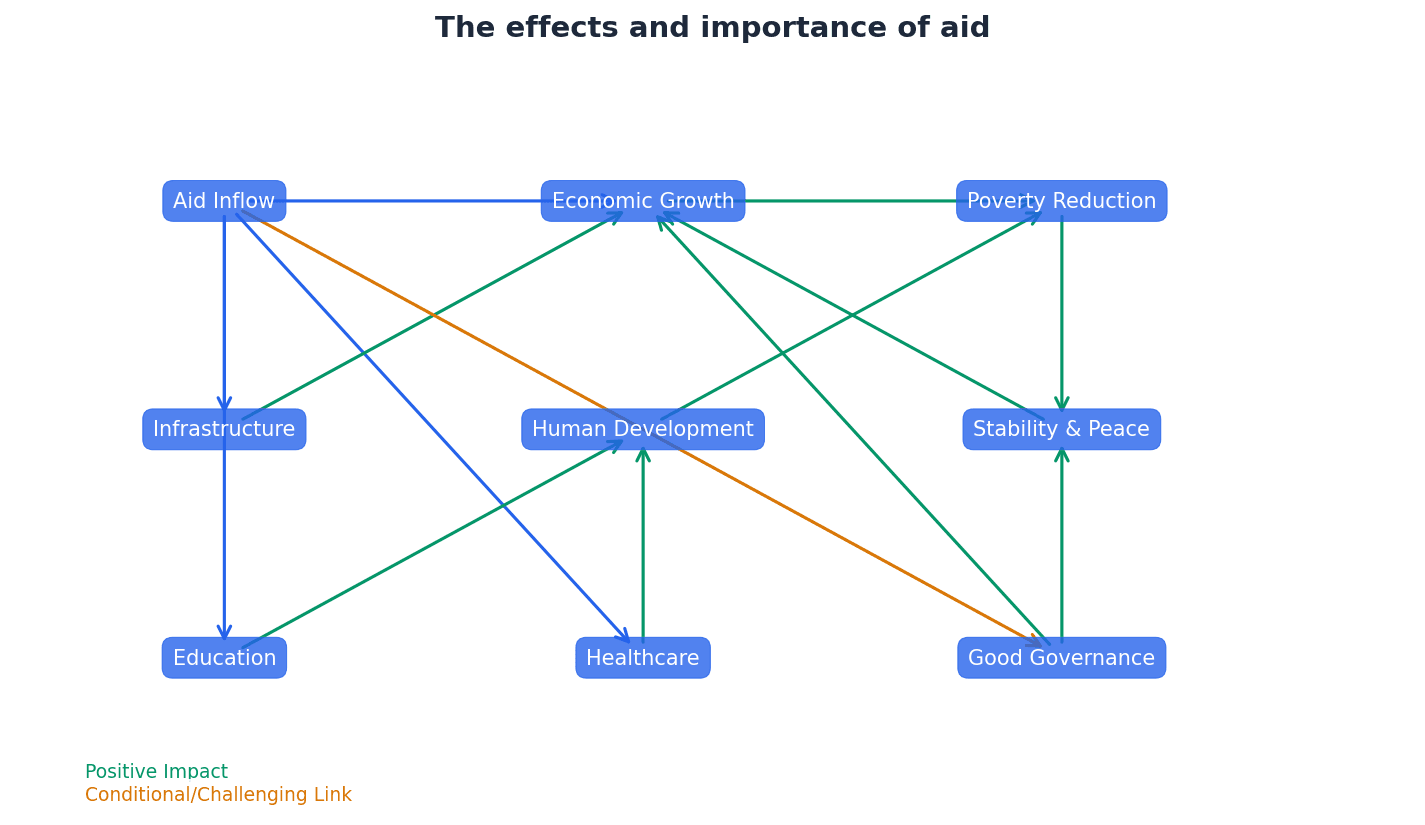
Students often think most aid goes to the poorest countries, but actually aid distribution can be influenced by donor country interests, leading to aid going to countries that are not necessarily the poorest.
Students often think aid is always beneficial for recipient countries, but actually heavy reliance on aid can lead to increased indebtedness, and imposed policy conditions may not always be suitable for local economic conditions.
International trade and investment are vital for economic development, facilitating the exchange of goods, services, and capital between countries. Trade allows countries to specialise and benefit from comparative advantage, while investment, particularly foreign direct investment, provides crucial capital and technology for growth. However, the benefits of trade are not always equally distributed, and investment can have both positive and negative consequences.
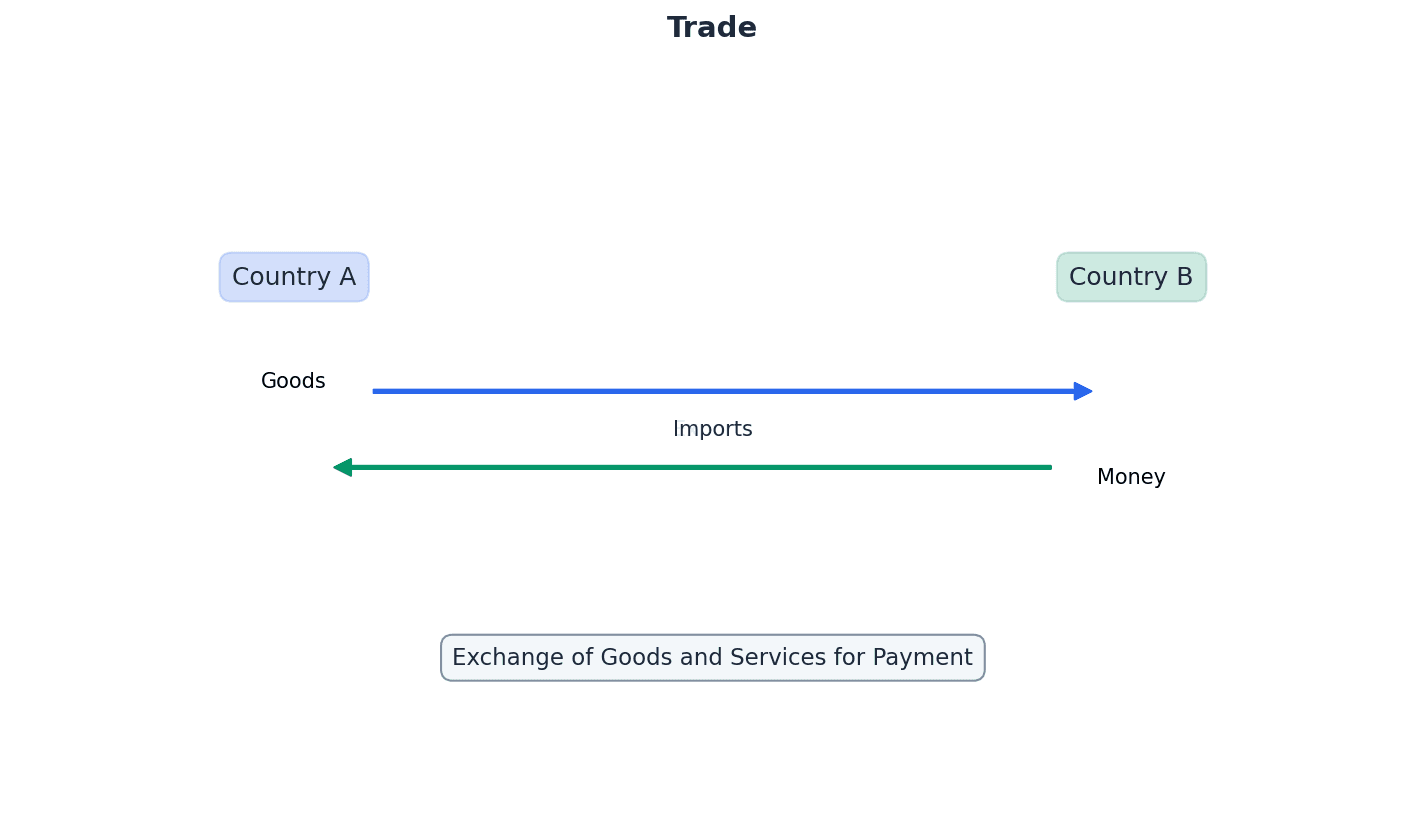
Students often think international trade automatically benefits all countries equally, but actually the terms of trade can favour high-income countries, and low-income countries specialising in primary products may face declining relative prices.
Multinational company (MNC) — A firm that operates in more than one country, with a parent company based in one country and production or service operations in at least one other country.
MNCs are significant drivers of foreign direct investment and can bring new technology, ideas, and employment to host countries. However, they can also deplete resources, create pollution, and repatriate profits, leading to complex economic impacts, much like a global fast-food chain with headquarters in one country but restaurants operating worldwide.
Foreign direct investment (FDI) — Investment that is necessary to produce a good or service in a foreign country, involving capital flows between countries.
FDI is crucial for low- and middle-income countries that lack domestic savings to finance investment, as it provides capital equipment and helps develop infrastructure. Countries attract FDI through measures like low corporation tax and good education systems, similar to a foreign company building a new factory or setting up an office in your country.
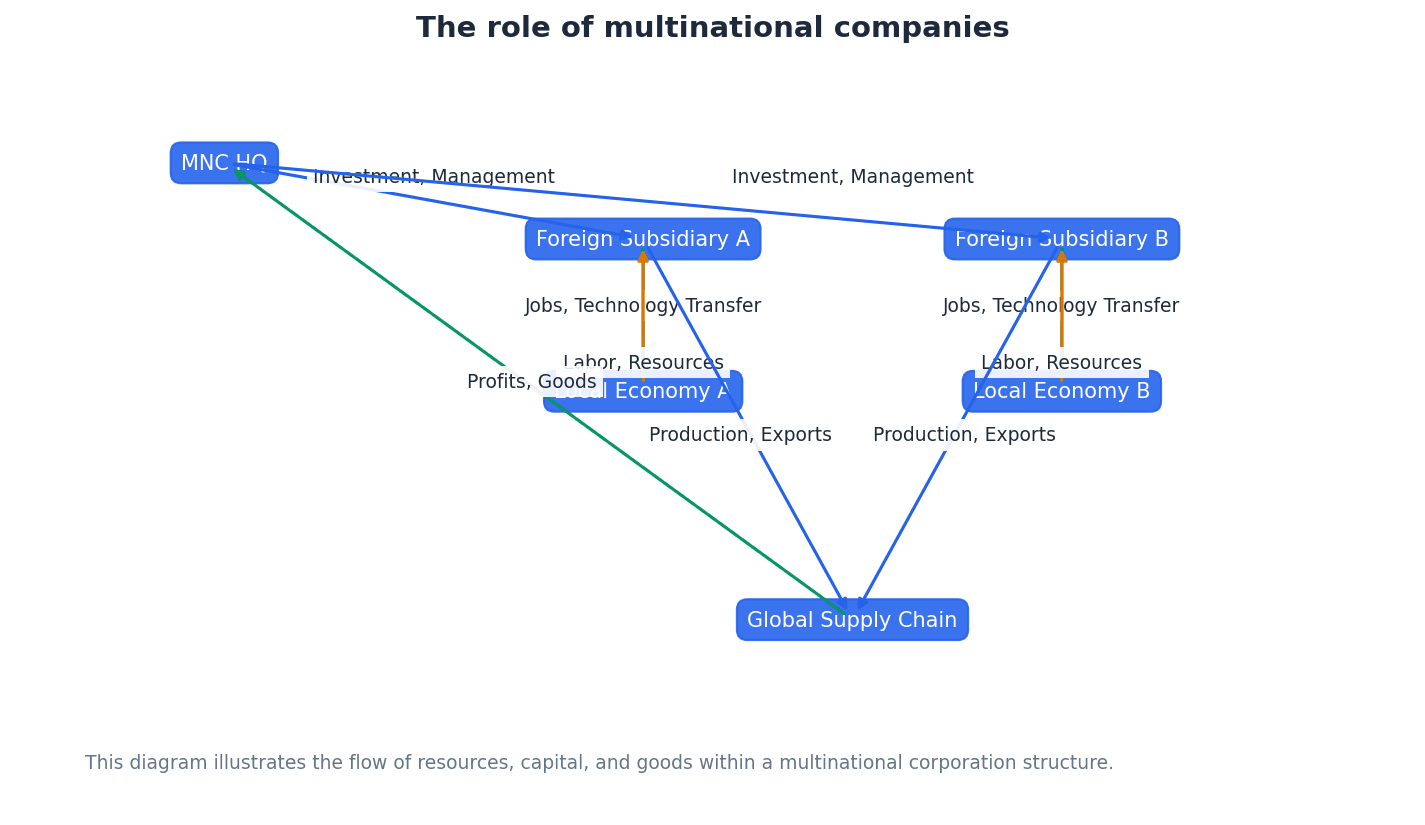
Students often think MNCs always create higher employment and incomes in host countries, but actually they may replace domestic firms or employ foreign labour in top-paid jobs, limiting local benefits.
Students often think MNCs always bring unmitigated benefits to host countries, but actually they can deplete non-renewable resources, create pollution, repatriate profits, and exert pressure on governments for favourable policies.
When evaluating MNC activities, use a balanced approach, discussing both the benefits (e.g., FDI, technology transfer, employment) and drawbacks (e.g., profit repatriation, environmental impact, pressure on governments) on host economies.
When discussing FDI, explain how it addresses the 'savings gap' in developing countries and link it to potential increases in GDP, employment, and technology transfer, while also considering potential negative consequences like resource depletion.
Students often think FDI automatically leads to economic development, but actually its impact depends on factors like the type of investment, the extent of local linkages, and whether profits are reinvested or repatriated.
External debt arises when a country borrows from foreign lenders. While borrowing can finance development, excessive debt can become a significant burden. Causes include poor financial management, but also unexpected external events like exchange rate depreciation, global recessions, or natural disasters. Consequences can include reduced government spending on essential services, higher taxes, and a diversion of resources to debt servicing rather than investment.
Students often think external debt is solely due to poor financial management by recipient countries, but actually unexpected events like exchange rate depreciation, global recessions, or natural disasters can significantly increase debt burdens.
International Monetary Fund (IMF) — An international organisation set up in 1944 to help promote the health of the world economy, with primary aims including promoting international monetary cooperation and exchange rate stability.
The IMF provides financial assistance to member countries experiencing balance of payments difficulties, often with conditions attached to encourage sound economic policies. Its functions include surveillance, technical assistance, and lending, acting like a global financial doctor and emergency lender for countries.
World Bank — An international organisation established in 1944, initially to help rebuild European countries, now focused on ending extreme poverty and promoting shared prosperity in low- and middle-income countries.
The World Bank provides financial and technical assistance, primarily through loans and grants, for internal investment projects such as infrastructure, health, education, and environmental protection. It comprises five institutions, including IBRD and IDA, functioning like a global development bank that invests in long-term projects to build up countries.
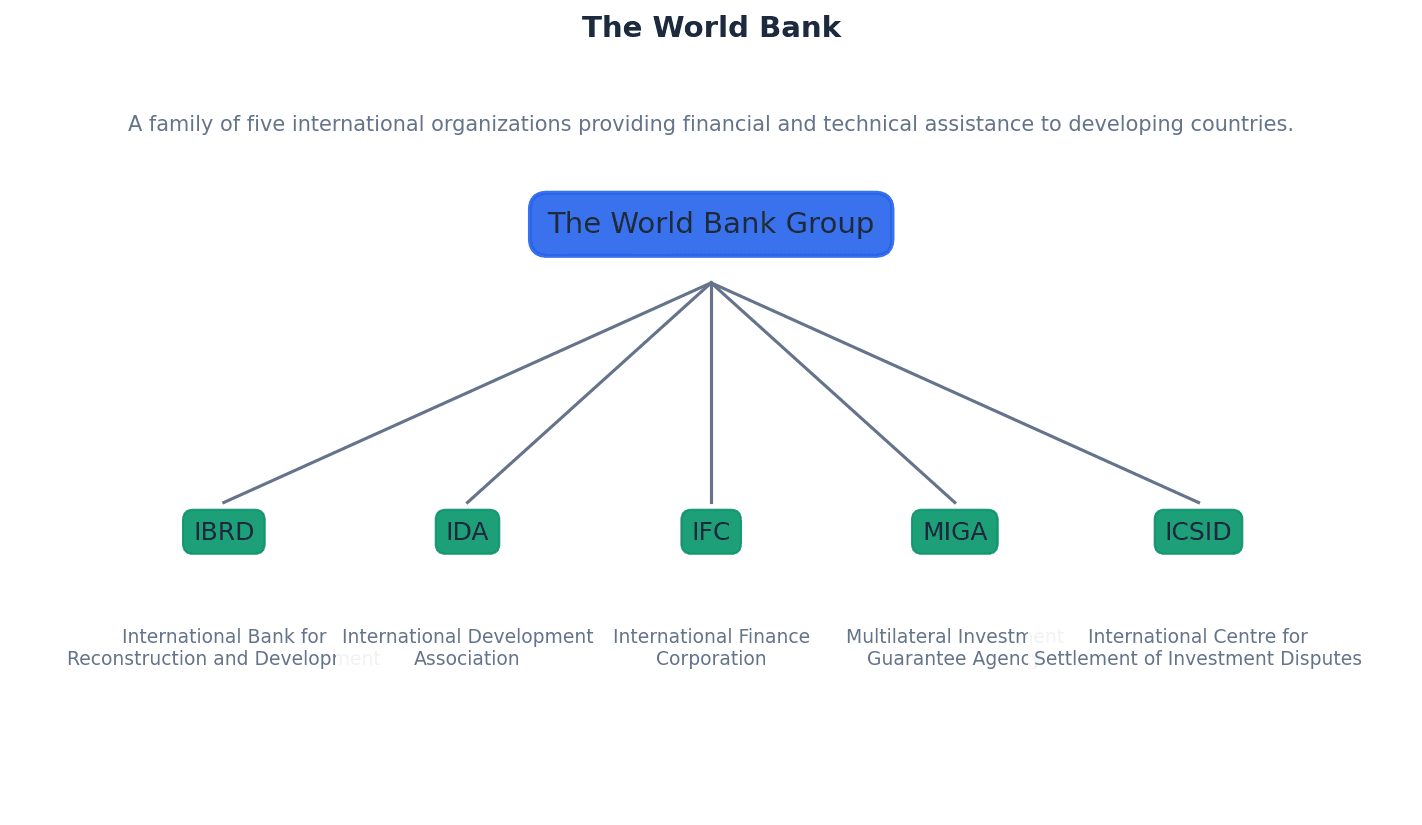
Students often think the IMF's loans are always beneficial, but actually the conditions attached to its loans (e.g., austerity measures) have been criticised for potentially harming development and increasing income inequality in recipient countries.
Students often think the World Bank only gives grants, but actually it primarily provides loans, often linked to conditions that involve wider-reaching changes to the economic policies of recipient economies.
Students often think the IMF and World Bank are purely benevolent organisations, but actually their policy prescriptions (e.g., the 'Washington Consensus') have been criticised for potentially increasing income inequality and not always addressing market failures effectively.
When explaining the IMF's role, focus on its aims related to global financial stability and balance of payments support, but also critically evaluate the 'Washington Consensus' policies it often promotes and their potential consequences.
When describing the World Bank's role, highlight its focus on long-term development projects and poverty reduction, distinguishing its lending activities (IBRD, IDA) and the types of sectors it supports, while also noting criticisms of its policy conditions.
When discussing aid, MNCs, or trade, always provide a balanced argument. Evaluate both the potential benefits and the significant drawbacks.
Advantages & Disadvantages
International Aid
Multinational Companies (MNCs) and Foreign Direct Investment (FDI)
Evaluation Starters
Essay Structure Guide
Introduction
Begin by defining the key terms relevant to the question (e.g., international aid, FDI, MNCs, external debt) and briefly outlining the scope of your discussion, acknowledging the multifaceted nature of relationships between countries at different development levels.
Conclusion
Summarise your main arguments, reiterating the complex and often contradictory nature of relationships between countries at different development levels. Conclude with a final evaluative statement on the overall impact of these relationships on global development, perhaps suggesting that a balanced approach is necessary for sustainable progress.
This chapter explores globalisation, defining it as the world becoming a single market due to reduced barriers to the movement of goods, services, investment, and workers. It analyses the causes and consequences of this integration, alongside differentiating various trade blocs and explaining the concepts of trade creation and trade diversion.
Globalisation — Globalisation involves the world becoming one market as a result of a reduction in the barriers to the movement of goods and services, direct and portfolio investment and workers.
This process integrates economies by reducing restrictions on international trade, capital flows, and labor mobility. It allows households to buy products globally, firms to spread production, and stock exchanges to sell shares worldwide, much like the world becoming a single large shopping mall.
Students often think globalisation only means more trade, but actually it also encompasses the free movement of capital (direct and portfolio investment) and workers across borders.
Trade bloc — A trade bloc is a regional grouping of countries that have preferential trade agreements between member countries.
These blocs aim to reduce or eliminate trade barriers among members, fostering deeper economic integration. Different types of trade blocs represent varying degrees of integration, from free trade areas to full economic unions, acting like a 'club' of countries with special benefits for members.
Students often think all trade blocs are the same, but actually they differ significantly in their level of integration, from simple free trade areas to complex monetary unions.
Free trade area — In a free trade area, the governments of the member countries agree to remove trade restrictions between each other.
Members retain the autonomy to determine their own external trade policies towards non-members, meaning they do not share a common external tariff. This is the least integrated type of trade bloc, like a group of friends sharing toys among themselves but setting their own rules for outsiders.
Students often think a free trade area means completely free trade with the entire world, but actually it only removes restrictions among member countries, with each member setting its own external tariffs.
When defining a free trade area, explicitly mention that members determine their own external trade policies and do not share a common external tariff, using an example like USMCA.
Customs union — As well as removing trade restrictions between members, members of a customs union agree to impose a common external tariff on trade with non-members.
This represents a deeper stage of economic integration than a free trade area, as members not only trade freely among themselves but also present a unified trade policy to the rest of the world. They often share tariff revenues and coordinate some trading policies, similar to neighbours agreeing on a single 'fee' for outsiders to borrow their tools.
Students often confuse a customs union with a free trade area, but actually the key difference is the common external tariff applied to non-members in a customs union.
When explaining a customs union, highlight the 'common external tariff' as the distinguishing feature from a free trade area, and provide an example like SACU.
Monetary union — The key feature of a monetary union is that the member countries all use the same currency and follow the same monetary and exchange rate policies.
This involves even more economic integration, typically removing restrictions on the movement of goods, services, capital, and labour to create a single market. A central bank often operates a single interest rate across the union, like siblings using the same pocket money currency and having parents manage a shared bank account.
Students often think a monetary union is just about having the same currency, but actually it also involves common monetary and exchange rate policies, often managed by a single central bank.
When discussing a monetary union, emphasise the single currency and common monetary/exchange rate policies, and note that it often includes a single market for goods, services, capital, and labour, using the EU as an example.
Full economic union — A full economic union involves the members having the same currency and following the same monetary, fiscal and exchange rate policies.
This is the final stage of integration, where the different economies effectively become one economy. It implies a high degree of policy harmonisation and coordination across all economic fronts, much like independent states merging completely into one country with a single government setting all tax and spending policies.
Students often confuse a full economic union with a monetary union, but actually a full economic union goes further by also harmonising fiscal policy, making the economies essentially one.
When describing a full economic union, stress that it includes common monetary, fiscal, and exchange rate policies, effectively making the member economies function as a single economy, citing the formation of the USA as an example.
Globalisation has been driven by several key factors. Advances in technology, particularly in communication and information, have significantly reduced the costs and time associated with international transactions. Improvements in transport infrastructure and logistics have made it easier and cheaper to move goods and services across borders. Furthermore, the reduction of international trade restrictions, such as tariffs and quotas, has facilitated greater cross-border movement of goods, services, investment, and workers.
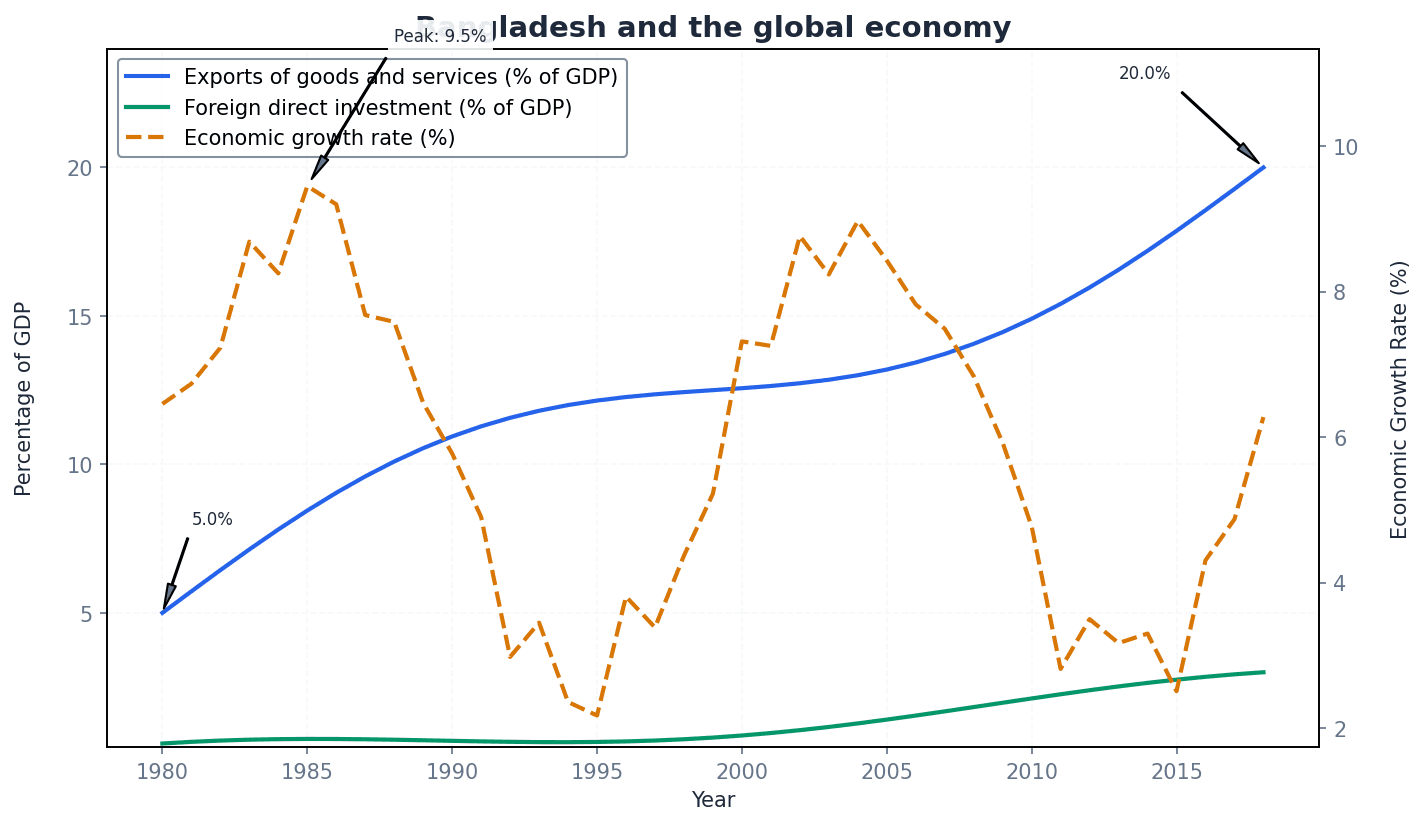
Globalisation brings about both positive and negative consequences. It can lead to economic growth through increased specialisation and efficiency, and lower prices for consumers due to greater competition and economies of scale. However, it also carries risks such as structural unemployment in industries unable to compete with imports, increased vulnerability to external economic shocks, and constraints on a government's ability to implement independent economic policies.
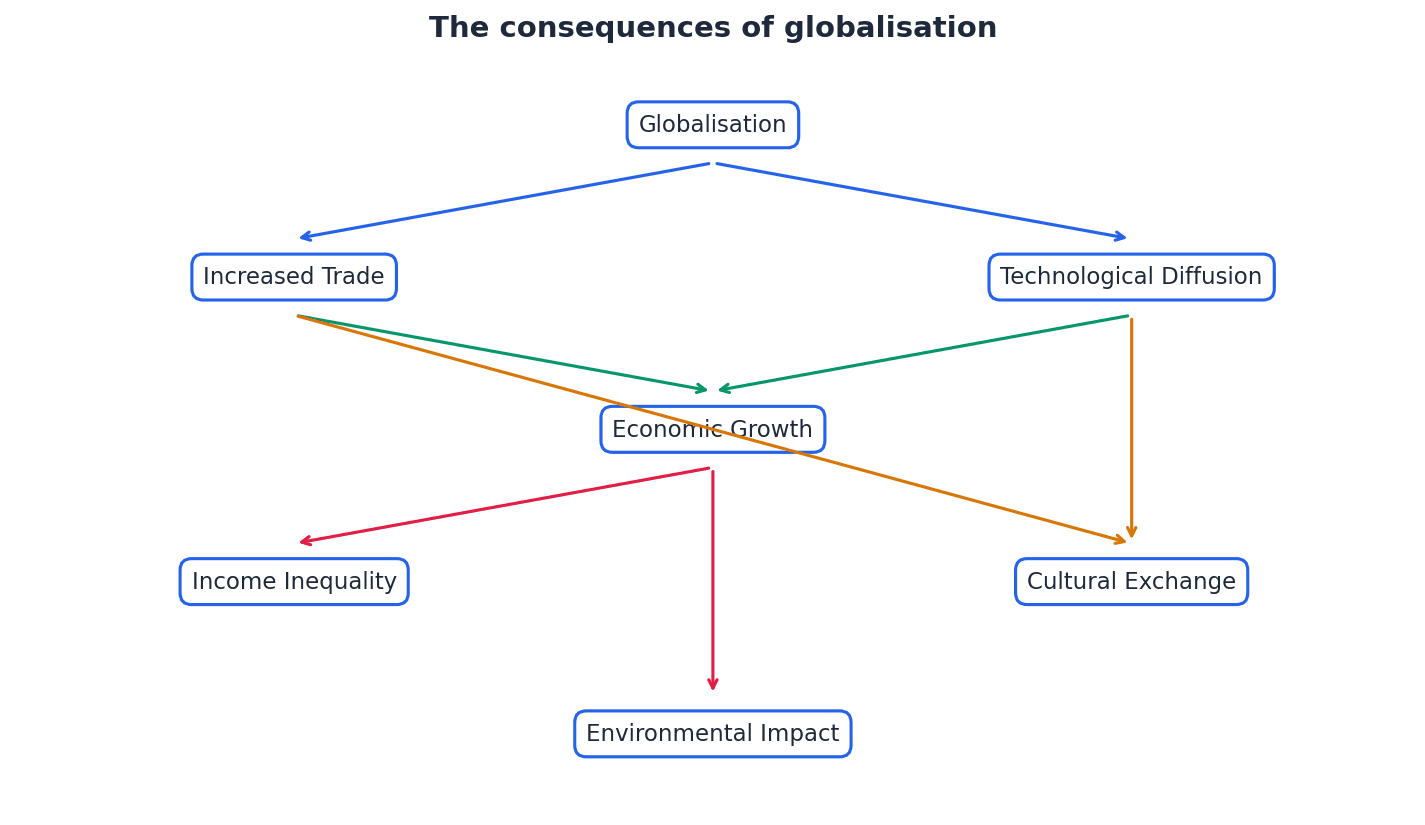
When asked to 'analyse the causes and consequences of globalisation', ensure you discuss both economic (e.g., specialisation, competition) and social/environmental (e.g., structural unemployment, pollution) impacts, providing specific examples.
Trade creation — Trade creation occurs when the removal of tariffs allows members to specialise in those products in which they have a comparative advantage.
This leads to more expensive domestic products being replaced by cheaper imports from a more efficient member country, increasing consumer surplus and overall welfare. Efficient firms within the bloc can also benefit from economies of scale due to a larger market, similar to buying cheaper, better apples from a specialist neighbour after joining a bloc.
Students often think trade creation only benefits consumers, but actually it also allows efficient firms within the bloc to expand and exploit economies of scale, potentially lowering prices further.
When explaining trade creation, use a supply and demand diagram to illustrate the fall in price, increase in quantity consumed, and the welfare gain (areas b and d), clearly labelling the changes in consumer and producer surplus and tariff revenue.
Trade diversion — Trade diversion occurs when membership of a trade bloc results in a country buying imports from a less efficient country within the trade bloc rather than from a more efficient country outside the trade bloc.
This happens because the common external tariff makes imports from more efficient non-members more expensive than those from less efficient members, leading to a less efficient allocation of resources globally and a potential reduction in welfare for the importing country. It's like buying less good, but tariff-free, bananas from a bloc member instead of cheaper, better bananas from outside the bloc.
Students often think trade diversion is always bad, but actually it's a trade-off; while it leads to less efficient resource allocation, the country might still gain some benefits from bloc membership, though welfare may be reduced if the efficiency loss (area e) outweighs the consumer gains (b and d).
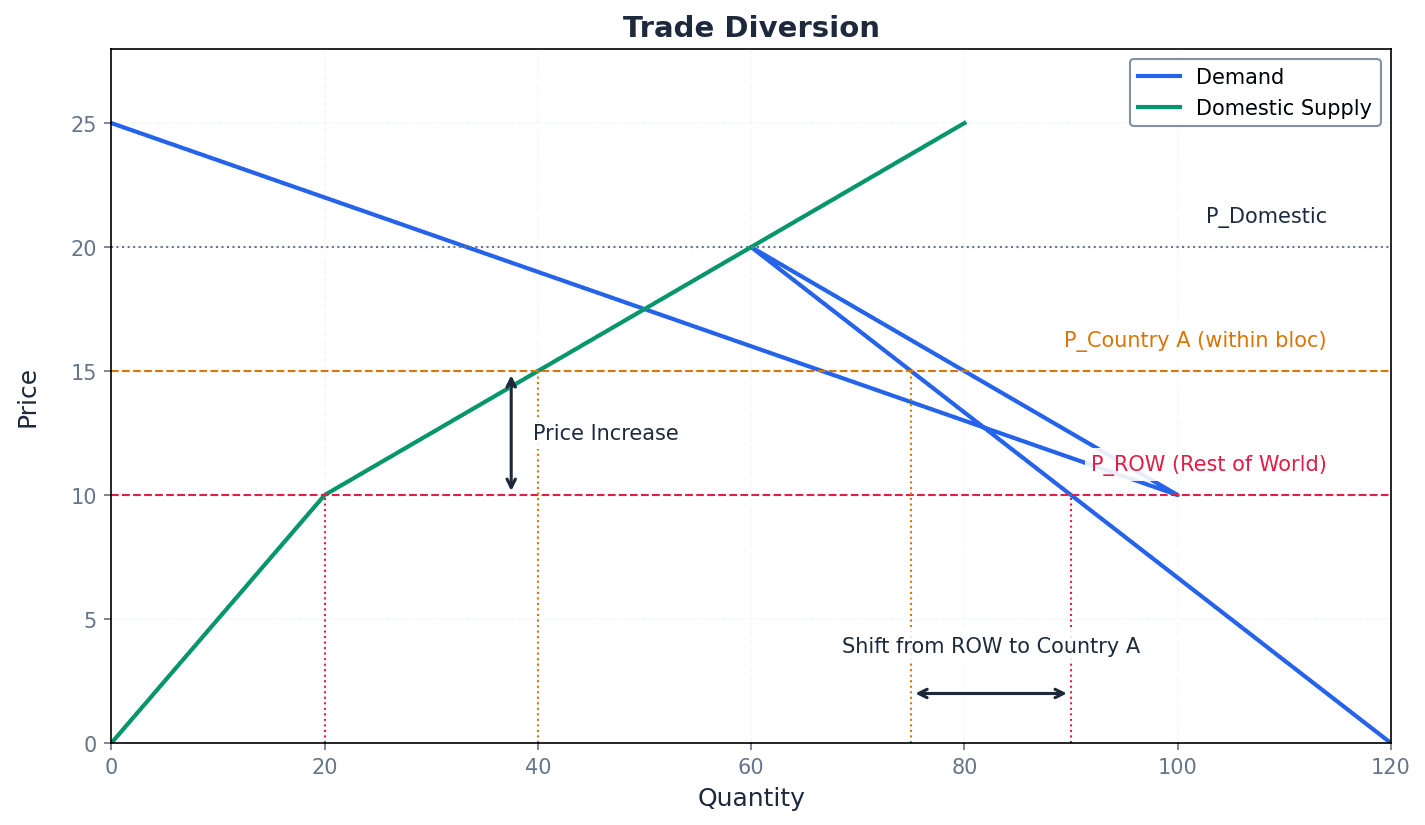
When explaining trade diversion, use a supply and demand diagram to show the shift in import source and the potential welfare loss (if area e > b+d), clearly indicating the fall in tariff revenue and the less efficient allocation of resources.
For 'discuss' or 'evaluate' questions on globalisation, always present a balanced argument. Analyse both the benefits (e.g., efficiency, choice) and the drawbacks (e.g., inequality, policy constraints).
Analyse the impact of globalisation on different economic agents: consumers, domestic firms, multinational corporations (MNCs), and the government.
Advantages & Disadvantages
Globalisation
Trade Blocs (General)
Evaluation Starters
Essay Structure Guide
Introduction
Start by defining globalisation and briefly outlining its key causes. State your overall argument or the main areas you will explore (e.g., both benefits and drawbacks, or the varying degrees of trade bloc integration).
Conclusion
Summarise your main arguments, reiterating the complex and multifaceted nature of globalisation and trade blocs. Offer a final, balanced judgment on their overall impact, perhaps suggesting that the net effect depends on specific circumstances and policy responses.
This chapter provides essential guidance for Cambridge AS and A Level Economics assessments, focusing on understanding assessment objectives, structuring essays, and effective revision. It clarifies common economic term confusions and outlines the qualification structures, equipping students with strategies for success.
Knowledge and understanding (AO1) — The assessment objective that requires candidates to demonstrate recall of essential economic facts, concepts, and theories, and to apply this knowledge to specific situations or issues.
This objective is foundational, accounting for 35% of total marks. It involves acquiring key terms and progressively applying them. Think of AO1 as knowing the ingredients and basic cooking steps for a recipe; you understand what each ingredient is and its purpose, but haven't necessarily cooked a full meal yet.
Students often think Knowledge and Understanding (AO1) is just memorising definitions, but it also involves understanding how to apply that knowledge to a particular situation or issue.
For questions with command words like 'calculate', 'define', 'describe', 'identify', 'outline', or 'state', keep your answers short and directly to the point, focusing solely on knowledge and understanding.
Analysis (AO2) — The assessment objective that involves separating an economic issue or problem into its basic elements and establishing the relationships between them.
Central to economics, this objective accounts for 40% of total marks. It requires using economic concepts, theories, and real-world experience to break down and explain situations. If AO1 is knowing the ingredients, AO2 is understanding how those ingredients interact when you cook them – how heat affects an egg, or how salt changes flavour; it's about cause and effect.
Students often think analysis is just describing a situation, but it actually requires explaining the 'how' and 'why' by linking economic concepts and theories to show relationships.
When 'analyse' or 'explain' are the command words, ensure your answer clearly establishes cause-and-effect relationships between economic elements. Use short sentences to make each point clear and refer to diagrams if included.
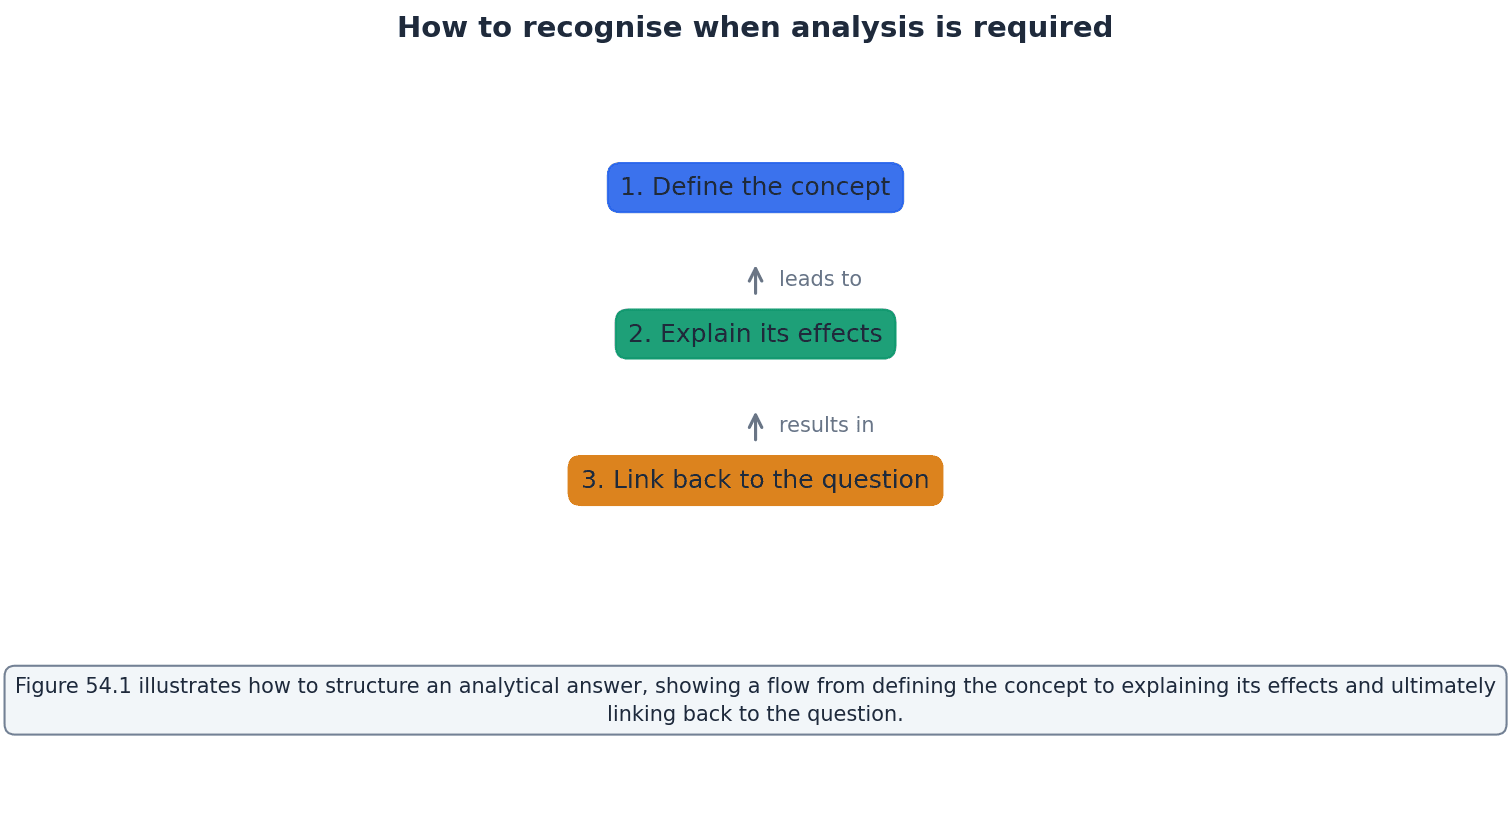
Evaluation (AO3) — The assessment objective that requires candidates to make reasoned judgements, often by considering different interpretations or policy suggestions and weighing the evidence for each side.
This objective accounts for 25% of total marks and involves presenting a balanced view, considering arguments for and against, and then making a concluding judgement based on the evidence. If AO1 is knowing the ingredients and AO2 is understanding how they interact, AO3 is like being a food critic: you taste the dish, consider different opinions, weigh pros and cons, and make a final judgement.
Students often think evaluation is just listing pros and cons, but it actually requires a clear, evidence-based judgement or conclusion that weighs the arguments presented.
For questions with command words like 'consider', 'discuss', 'assess', or 'evaluate', always provide a balanced view and conclude with a clear judgement based on the evidence presented in your answer, revisiting the original question wording.
Definition of fiscal policy — Fiscal policy refers to the use of government spending and taxation to influence the economy.
This definition is the starting point for any analytical answer on fiscal policy, establishing the core concept before exploring its mechanisms. Defining fiscal policy is like stating the name of a tool before explaining how to use it; you need to know what 'hammer' means before you can explain how to hit a nail.
Students often think fiscal policy only involves government spending, but it also includes taxation as a key component.
Always start an analytical answer by defining key terms relevant to the question, as this demonstrates foundational knowledge (AO1) and sets the stage for deeper analysis (AO2).
Increasing government spending or reducing taxes — These are the primary tools of expansionary fiscal policy used to stimulate economic activity.
These actions directly inject money into the economy or leave more disposable income with consumers and businesses, forming the 'how' aspect of fiscal policy implementation. This is like explaining the specific actions you take with the hammer – 'you lift it up' or 'you swing it down'; it's the practical application of the defined tool.
Students often think these actions immediately solve economic problems, but their effectiveness depends on various factors like the size of the multiplier and current economic conditions.
When explaining policy mechanisms, clearly state the specific actions involved, linking them directly to the policy definition. This demonstrates a clear understanding of the policy's operational aspects.
Increase in the level of aggregate demand — An increase in the total demand for goods and services in an economy at a given price level.
Increased government spending or reduced taxes lead to higher consumption and investment, which in turn boosts aggregate demand. This is a crucial link in the chain of analysis, showing the macroeconomic impact. If you hit the nail (increased spending/reduced taxes), the nail goes into the wood (increased consumption/investment), and the wood is now more firmly attached (increased aggregate demand).
Students often think increased aggregate demand automatically leads to higher employment, but it can also lead to inflation if the economy is already near full capacity.
Clearly articulate the chain of reasoning from policy action to its impact on aggregate demand, using precise economic terminology to show the relationship between components.
Increasing the level of employment — A rise in the number of people who are working in an economy.
When aggregate demand increases, firms respond by increasing production, which requires hiring more workers, thus leading to higher employment. This is the ultimate desired outcome of expansionary fiscal policy in this context. This is the final outcome of the hammer and nail analogy: the picture is now hanging on the wall, representing the successful completion of the intended action.
Students often think any increase in employment is good, but it's important to consider the type of employment (e.g., full-time vs. part-time) and whether it's sustainable.
Ensure your analytical chain of reasoning culminates in a clear and direct answer to the question asked, demonstrating how the policy achieves its stated objective.
aggregate demand (AD)
Also expressed as C + I + G + (X – M), this formula represents the total demand for goods and services in an economy.
average rate of taxation (art)
This formula calculates the proportion of income paid in tax.
cross elasticity of demand (XED)
Measures the responsiveness of demand for one good to a change in the price of another good.
equilibrium income in an open economy
Achieved when I + G + X = S + T + M, representing the condition for macroeconomic equilibrium in an open economy.
income elasticity of demand (YED)
Measures the responsiveness of demand for a good or service to a change in consumers' income.
marginal rate of taxation (mrt)
Calculates the proportion of any additional income that is paid in tax.
price elasticity of demand (PED)
Measures the responsiveness of the quantity demanded of a good or service to a change in its price.
price elasticity of supply (PES)
Measures the responsiveness of the quantity supplied of a good or service to a change in its price.
real GDP
Adjusts nominal GDP for inflation to reflect the actual volume of goods and services produced.
terms of trade index
Indicates the relative price of a country's exports in terms of its imports.
total revenue (TR)
Calculates the total income a firm receives from selling a given quantity of goods or services at a specific price.
unemployment rate
Measures the percentage of the labour force that is unemployed.
average fixed cost (AFC)
Calculates the fixed cost per unit of output.
average product
Measures the output per worker.
average revenue (AR)
Calculates the revenue per unit sold.
average propensity to consume (apc)
Measures the proportion of total income that is spent on consumption.
average propensity to save (aps)
Measures the proportion of total income that is saved.
average total cost (ATC)
Calculates the total cost per unit of output.
average variable cost (AVC)
Calculates the variable cost per unit of output.
bank credit multiplier (after loans have been made)
This formula determines the total increase in the money supply resulting from an initial injection of liquid assets into the banking system.
Bank credit multiplier (in advance)
This formula calculates the potential increase in the money supply based on the banking system's liquidity ratio.
concentration ratio (4 firm)
Measures the combined market share of the four largest firms in an industry, indicating market concentration.
consumption function
Expressed as C = a + bY, this function describes the relationship between consumption and income.
equi-marginal principle
States that consumers maximise utility when the ratio of marginal utility to price is equal for all goods consumed.
Fisher equation
Expressed as MV = PT, this equation relates the money supply, its velocity, the price level, and the volume of transactions.
Gini coefficient
A measure of income inequality within a country, derived from the Lorenz curve.
marginal cost (MC)
Calculates the additional cost incurred from producing one more unit of output.
marginal propensity to consume (mpc)
Measures the proportion of any additional income that is spent on consumption. Can also be found by 1 – mps.
marginal propensity to import (mpm)
Measures the proportion of any additional income that is spent on imports.
marginal propensity to save (mps)
Measures the proportion of any additional income that is saved.
marginal revenue (MR)
Calculates the additional revenue gained from selling one more unit of output.
multiplier
This formula shows how an initial change in injection (e.g., investment, government spending) leads to a larger final change in national income. Also, multiplier = 1 / marginal propensity to withdraw (mpw = mps + mrt + mpm).
profit
Calculates the economic profit, which is total revenue minus all costs, including the opportunity cost of capital (normal profit).
real exchange rate
Adjusts the nominal exchange rate for differences in price levels between countries, reflecting the purchasing power of currencies.
savings function
Expressed as S = –a + sY, this function describes the relationship between saving and income.
social benefits (SB)
Represents the total benefits to society from an economic activity, including both private gains and positive externalities.
social costs (SC)
Represents the total costs to society from an economic activity, including both private costs and negative externalities.
supernormal profit
Calculates profit above and beyond the normal profit, which is the minimum profit required to keep a firm in business.
total cost (TC)
Represents the sum of all costs incurred in producing a given level of output.
Effective essay structuring is crucial for demonstrating your economic understanding. A well-structured essay typically begins with a clear introduction that defines key terms and outlines the scope of the answer. This is followed by analytical paragraphs, often supported by diagrams, which establish cause-and-effect relationships. The essay then moves to an evaluative discussion, considering different perspectives and weighing evidence, before concluding with a reasoned judgement that directly addresses the question.
Continuous and active revision is more effective than last-minute cramming. This involves not just re-reading notes but actively applying knowledge through practice questions, especially past papers under timed conditions. Understanding the assessment objectives and how they are tested helps to focus revision efforts on developing the necessary skills for each objective.
Underestimating the importance of continuous revision from the start of the course, rather than just before assessments, is a common pitfall.
Economics contains many terms that sound similar but have distinct meanings, leading to common confusions. For instance, 'Budget deficit' is often confused with 'Current account deficit', and 'Deflation' with 'Disinflation'. It is vital to precisely understand the definition and application of each term to avoid losing marks in assessments.
Students often confuse economic terms like 'Budget deficit' with 'Current account deficit' or 'Deflation' with 'Disinflation'. Always ensure you know the precise definition of each term.
Practice actively: Don't just re-read notes. Apply your knowledge by completing past paper questions under timed conditions.
Advantages & Disadvantages
Expansionary Fiscal Policy (Increasing Government Spending or Reducing Taxes)
Assessment Objective 3 (Evaluation)
Evaluation Starters
Essay Structure Guide
Introduction
Begin with a clear introduction that defines key economic terms relevant to the question (AO1) and briefly outlines the main arguments or perspectives you will explore. State your overall line of argument or the direction your evaluation will take.
Conclusion
Conclude with a clear, reasoned judgement that directly answers the original question. This judgement should be based on the evidence and arguments presented throughout your essay. Avoid introducing new information and ensure your conclusion revisits the specific wording of the question.
Generated by Nexelia Academy · nexeliaacademy.com