A simple infographic showing a cycle: 'Observation' -> 'Data Collection' -> 'Analysis' -> 'Interpretation' -> 'Conclusion' -> 'Further Questions'. Icons represent each stage, e.g., a magnifying glass for observation, a chart for analysis.
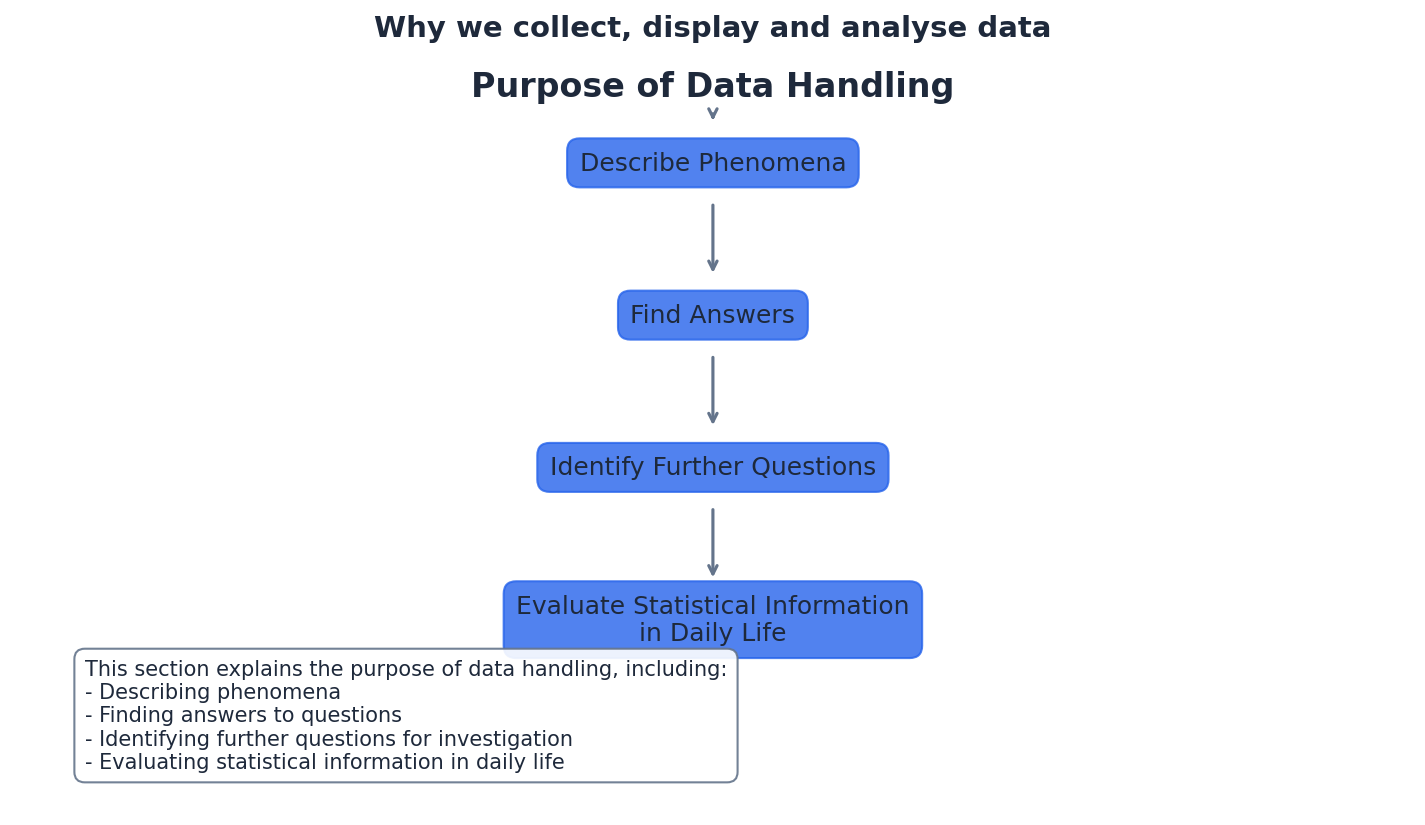
To describe phenomena and identify patterns.
To find answers to specific research questions.
To evaluate the reliability and significance of findings.
To identify areas for further investigation.
Examiner Tip
While not directly examined, understanding the 'why' behind data handling provides context and reinforces the importance of accurate representation and interpretation.
The 'big data' revolution in science, from genomics to astrophysics, relies heavily on sophisticated data collection and analysis techniques to uncover insights from massive datasets that would be impossible to process manually.
A simple infographic showing a cycle: 'Observation' -> 'Data Collection' -> 'Analysis' -> 'Interpretation' -> 'Conclusion' -> 'Further Questions'. Icons represent each stage, e.g., a magnifying glass for observation, a chart for analysis.
To describe phenomena and identify patterns.
To find answers to specific research questions.
To evaluate the reliability and significance of findings.
To identify areas for further investigation.
Examiner Tip
While not directly examined, understanding the 'why' behind data handling provides context and reinforces the importance of accurate representation and interpretation.
The 'big data' revolution in science, from genomics to astrophysics, relies heavily on sophisticated data collection and analysis techniques to uncover insights from massive datasets that would be impossible to process manually.
Representation of data · Probability & Statistics 1
Upgrade to Pro to upload images of your work.