Psychology · Research methods
This chapter explores fundamental research methods in psychology, including experiments, self-reports, case studies, observations, and correlations. It details the research process from hypothesis development and variable definition to sampling and data analysis, while also covering crucial methodological and ethical considerations.
experiment — an investigation looking for a causal relationship in which an independent variable is manipulated and is expected to be responsible for changes in the dependent variable.
Experiments are the only research method that can establish cause-and-effect relationships by systematically controlling variables. The researcher actively changes one variable, known as the independent variable (IV), to see its direct impact on another, the dependent variable (DV). This is like a chef changing only one ingredient (IV) in a recipe to see how it affects the final taste (DV) of the dish.
independent variable — the factor under investigation in an experiment which is manipulated to create two or more conditions (levels) and is expected to be responsible for changes in the dependent variable.
The IV is the variable that the experimenter changes or controls. It creates different conditions that participants experience, and these conditions are hypothesised to cause a change in the dependent variable. For example, in a study on plant growth, the amount of water given to plants is the independent variable because the researcher controls it.
dependent variable — the factor in an experiment which is measured and is expected to change under the influence of the independent variable.
The DV is the outcome variable that the researcher measures. Any observed changes in the DV are presumed to be caused by the manipulation of the independent variable. Continuing the plant growth study, the height of the plants is the dependent variable because it's what you measure to see the effect of the water.
extraneous variable — a variable which either acts randomly, affecting the DV in all levels of the IV or systematically, i.e. on one level of the IV (called a confounding variable) so can obscure the effect of the IV, making the results difficult to interpret.
These are variables other than the IV that could potentially influence the DV. They need to be controlled to ensure that any observed effect is truly due to the IV and not other factors. For instance, if you're testing a new fertiliser (IV) on plant growth (DV), sunlight, temperature, and soil quality are extraneous variables that need to be kept constant.
Students often confuse independent and dependent variables. Remember that the Independent Variable (IV) is manipulated by the researcher, while the Dependent Variable (DV) is measured.
When asked to 'describe an experiment', ensure you clearly identify the manipulated IV and the measured DV, and mention controls for extraneous variables.
experimental condition — one or more of the situations in an experiment which represent different levels of the IV and are compared (or compared to a control condition).
These are the specific settings or treatments created by manipulating the independent variable. Participants are exposed to one or more of these conditions to observe their effect on the dependent variable. In a taste test, 'sweetened' and 'unsweetened' versions of a drink would be two experimental conditions.
control condition — a level of the IV in an experiment from which the IV is absent. It is compared to one or more experimental conditions.
This condition serves as a baseline for comparison, where the independent variable is either absent or at a 'normal' level. It helps determine if the experimental manipulation truly causes a change. In a drug trial, the group receiving a placebo (no active drug) is the control condition, compared to the group receiving the actual drug.
laboratory experiment — a research method in which there is an IV, a DV and strict controls. It looks for a causal relationship and is conducted in a setting that is not in the usual environment for the participants with regard to the behaviour they are performing.
Conducted in an artificial, controlled environment, laboratory experiments allow for high control over extraneous variables and precise measurement. This increases internal validity and reliability but may reduce ecological validity. An example is testing how different light colours affect reaction time in a specially designed, windowless room at a university.
field experiment — an investigation looking for a causal relationship in which an independent variable is manipulated and is expected to be responsible for changes in the dependent variable. It is conducted in the normal environment for the participants for the behaviour being investigated.
Field experiments are conducted in a natural setting, allowing for greater ecological validity than lab experiments. The IV is still manipulated, but in a real-world context, which can make control of extraneous variables more challenging. For example, testing the effect of different background music (IV) on customer spending (DV) in an actual shop.
natural experiment — an investigation looking for a causal relationship in which the independent variable cannot be directly manipulated by the experimenter. Instead they study the effect of an existing difference or change. Since the researcher cannot manipulate the levels of the IV it is not a true experiment.
In a natural experiment, the independent variable occurs naturally, without researcher intervention (e.g., a natural disaster, a policy change). The researcher observes the effect of this pre-existing IV on a DV. An example is studying the psychological impact of a natural disaster (IV) on residents' stress levels (DV), where the disaster itself is not manipulated by the researcher.
When evaluating lab experiments, discuss the trade-off between high control/internal validity and potential low ecological validity/demand characteristics.
experimental design — the way in which participants are allocated to levels of the IV.
This refers to how participants are distributed across the different conditions of an experiment. The choice of design impacts how individual differences are handled and the potential for order effects. It's like deciding whether to have different groups of students for each teaching method (independent measures) or have the same students try all methods (repeated measures).
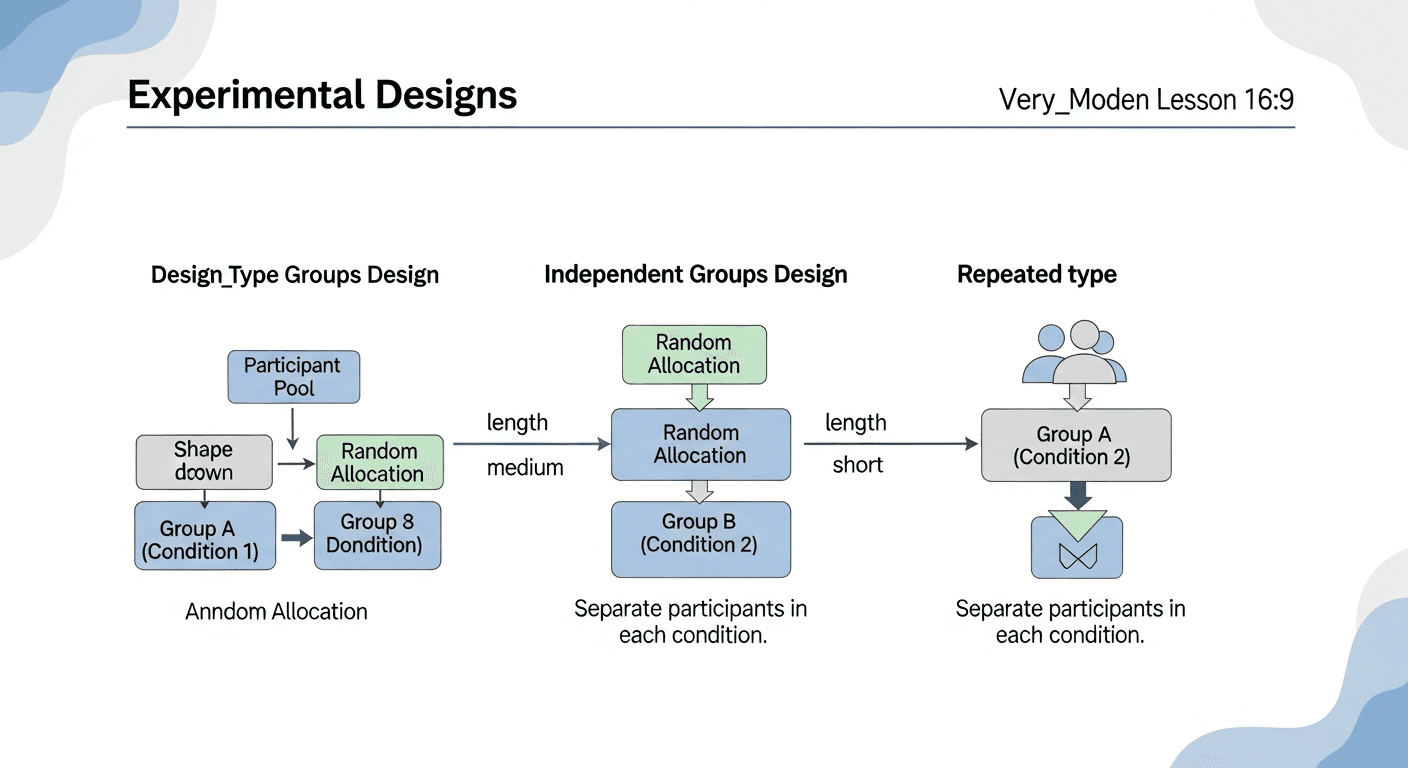
independent measures design — an experimental design in which a different group of participants is used for each level of the IV (condition).
Each participant experiences only one condition of the independent variable. This avoids order effects but can be susceptible to participant variables if random allocation is not effective. For example, having one group of students learn with mind maps and a completely different group learn with revision apps.
demand characteristics — features of the experimental situation which give away the aims. They can cause participants to try to change their behaviour, e.g. to match their beliefs about what is supposed to happen, which reduces the validity of the study.
These are cues in the research setting that might inform participants about the study's purpose, leading them to alter their natural behaviour. This can bias results and lower validity. If a participant guesses a study is about memory, they might try harder to remember things, not reflecting their usual memory ability.
random allocation — a way to reduce the effect of confounding variables such as individual differences. Participants are put in each level of the IV such that each person has an equal chance of being in any condition.
This technique ensures that individual differences are spread evenly across all experimental conditions, making it less likely that participant variables will confound the results. It's like flipping a coin to decide which group each new participant goes into, ensuring no bias in group formation.
Students often confuse random sampling with random allocation. Random sampling is about selecting participants from a population, while random allocation is about assigning participants to experimental conditions.
repeated measures design — an experimental design in which each participant performs in every level of the IV.
The same group of participants experiences all conditions of the independent variable. This controls for participant variables but introduces the risk of order effects. An example is having the same group of students try both the mind map method and the revision app method for learning.
participant variables — individual differences between participants (such as age, personality and intelligence) that could affect their behaviour in a study. They could hide or exaggerate differences between levels of the IV.
These are characteristics unique to each participant that might influence their performance on the dependent variable, independent of the IV. They are a particular concern in independent measures designs. In a study on reaction time, some participants might naturally have faster reflexes than others, regardless of the experimental condition.
order effects — practice and fatigue effects are the consequences of participating in a study more than once, e.g. in a repeated measures design. They cause changes in performance between conditions that are not due to the IV, so can obscure the effect on the DV.
These occur when the order in which participants experience conditions affects their performance. Practice effects lead to improvement, while fatigue effects lead to decline. If you take two tests, you might do better on the second because you're warmed up (practice effect) or worse because you're tired (fatigue effect).
Students often overlook order effects in repeated measures design. Remember to consider both practice and fatigue effects and how to control them (e.g., counterbalancing).
practice effect — a situation where participants’ performance improves because they experience the experimental task more than once, e.g. due to familiarity or learning the task.
This is a type of order effect where repeated exposure to a task leads to better performance, not because of the IV, but because participants become more skilled or familiar with the task. An example is getting better at a video game after playing it a few times, even if the game itself hasn't changed.
fatigue effect — a situation where participants’ performance declines because they have experienced an experimental task more than once, e.g. due to boredom or tiredness.
This is a type of order effect where repeated exposure to a task leads to worse performance, not because of the IV, but because participants become bored, tired, or less motivated. This is like making more mistakes on a long exam towards the end because you're mentally exhausted.
randomisation — a way to reduce order effects in a repeated measures design by presenting the conditions in a random order for each participant.
This method helps to balance out order effects by ensuring that each condition has an equal chance of appearing first or second. While it reduces the overall impact, it doesn't eliminate order effects for individual participants. It's like shuffling a deck of cards before each game to ensure no fixed order of cards.
counterbalancing — counterbalancing is used to overcome order effects in a repeated measures design. Each possible order of levels of the IV is performed by a different sub-group of participants. This can be described as an ABBA design, as half the participants do condition A then B, and half do B then A.
This systematic method ensures that each condition is presented first and second an equal number of times across the entire sample. This balances out practice and fatigue effects, making them less likely to bias the overall results. For example, if you have two tasks (A and B), half the participants do A then B, and the other half do B then A, so any advantage or disadvantage of doing one first is cancelled out.
When using repeated measures, always discuss counterbalancing or randomisation as essential controls for order effects.
matched pairs design — an experimental design in which participants are arranged into pairs. Each pair is similar in ways that are important to the study and one member of each pair performs in a different level of the IV.
This design uses different participants in each condition, but they are carefully matched on key characteristics relevant to the study. This minimises participant variables while avoiding order effects. If studying the effect of a new teaching method, you might pair students with similar prior grades, then assign one from each pair to the new method and the other to the old method.
standardisation — keeping the procedure for each participant in an experiment (or interview) exactly the same to ensure that any differences between participants or conditions are due to the variables under investigation rather than differences in the way they were treated.
Standardisation ensures consistency in how the study is conducted, from instructions given to the environment. This reduces extraneous variables and increases the reliability of the findings. It's like following a recipe exactly every time you bake a cake to ensure consistent results.
reliability — the extent to which a procedure, task or measure is consistent, for example that it would produce the same results with the same people on each occasion.
Reliability refers to the consistency and repeatability of a study's findings. A reliable measure will produce similar results under consistent conditions. A reliable bathroom scale gives you the same weight every time you step on it, assuming your actual weight hasn't changed.
validity — the extent to which the researcher is testing what they claim to be testing.
Validity refers to the accuracy of a study's findings – whether it truly measures what it intends to measure and whether the results can be generalised. It's about the truthfulness of the research. A valid intelligence test actually measures intelligence, not just how good you are at taking tests.
Students often confuse validity with reliability. A study can be reliable (consistent) but not valid (not measuring what it claims).
generalise — apply the findings of a study more widely, e.g. to other settings and populations.
Generalisability refers to the extent to which the results of a study conducted on a specific sample in a specific setting can be applied to a larger population or different situations. For example, if a new teaching method works well in one school, can we generalise that it will work well in all schools?
ecological validity — the extent to which the findings of research in one situation would generalise to other situations. This is influenced by whether the situation (e.g. a laboratory) represents the real world effectively and whether the task is relevant to real life (has mundane realism).
This type of validity concerns how well the experimental setting and tasks reflect real-world situations. High ecological validity means the findings are more likely to apply to everyday life. A study on memory conducted in a classroom using typical learning materials would have higher ecological validity than one conducted in a sterile lab using abstract word lists.
uncontrolled variable — a confounding variable that may not have been identified and eliminated in an experiment, which can confuse the results. It may be a feature of the participants or the situation.
These are extraneous variables that were not controlled for, and which systematically affected the dependent variable, making it difficult to determine if the IV was truly responsible for the observed changes. If you're testing a new teaching method, and one class happens to have a highly experienced teacher while the other has a novice, the teacher's experience becomes an uncontrolled variable.
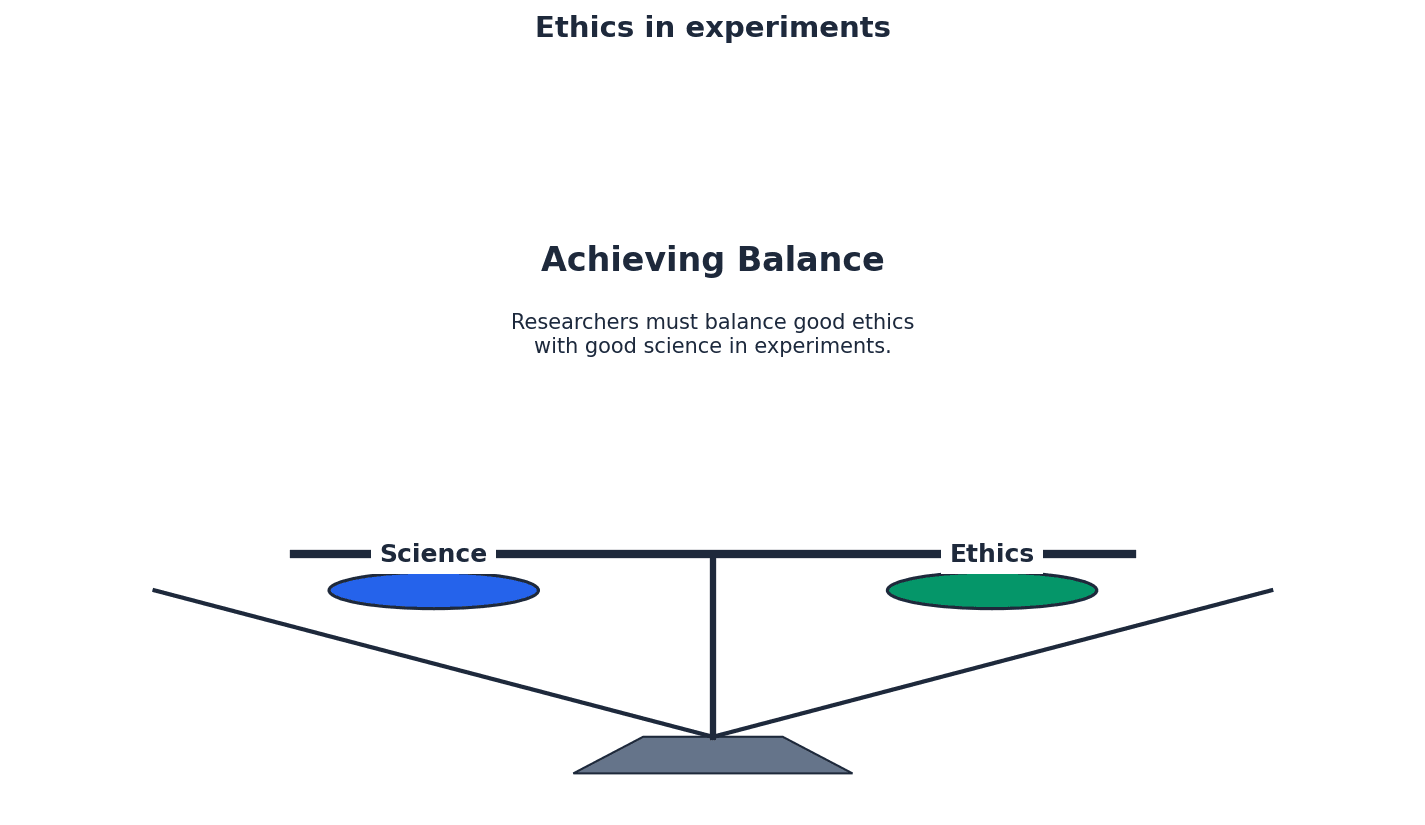
Ethical issues are paramount in psychological research to protect participants' well-being and rights. Key ethical guidelines include informed consent, the right to withdraw, and ensuring privacy and confidentiality. Researchers must carefully consider these aspects when designing and conducting any study.
informed consent — knowing enough about a study to decide whether you want to agree to participate.
Participants must be given sufficient information about the study's purpose, procedures, risks, and their rights before agreeing to take part. This ensures their participation is voluntary and ethical. It's like signing a contract after reading and understanding all the terms and conditions.
right to withdraw — a participant should know that they can remove themselves, and their data, from the study at any time.
Participants must be explicitly informed that they are free to leave the study at any point, without penalty, and can also request their data be removed. This protects their autonomy. This is similar to being able to leave a movie theatre if you don't like the film, without having to explain yourself.
privacy — participants’ emotions and physical space should not be invaded, for example they should not be observed in situations or places where they would not expect to be seen.
Researchers must respect participants' personal space and emotional boundaries, ensuring that observations or questions do not intrude on their private lives without explicit consent. This is like not reading someone's diary or listening to their private conversations without their permission.
confidentiality — participants’ results and personal information should be kept safely and not released to anyone outside the study.
Confidentiality ensures that any data collected from participants, especially personal information, is protected and not disclosed to unauthorised individuals. This builds trust and encourages honest participation.
Explain how deception can sometimes be used to manage demand characteristics, but it must be followed by debriefing to ensure ethical practice regarding informed consent.
self-report — a research method, such as a questionnaire or interview, which obtains data by asking participants to provide information about themselves.
Self-reports are direct methods of gathering subjective data from participants about their thoughts, feelings, or behaviours. They rely on individuals' own accounts and can take various forms, such as written questionnaires or verbal interviews.
questionnaire — a research method that uses written questions.
Questionnaires are a common type of self-report where participants respond to a series of written questions. They can be administered in various ways and are useful for collecting data from a large number of people efficiently.
closed questions — questionnaire, interview or test items that produce quantitative data. They have only a few, stated alternative responses and no opportunity to expand on answers.
Closed questions provide a limited set of pre-defined answers, making data collection and analysis straightforward and quantitative. Examples include multiple-choice or rating scale questions.
open questions — questionnaire, interview or test items that produce qualitative data. Participants give full and detailed answers in their own words, i.e. no categories or choices are given.
Open questions allow participants to provide detailed, descriptive answers in their own words, yielding rich qualitative data. This provides deeper insights but can be more challenging to analyse.
inter-rater reliability — the extent to which two researchers interpreting qualitative responses in a questionnaire (or interview) will produce the same records from the same raw data.
This refers to the consistency of interpretation between different observers or researchers when analysing qualitative data. High inter-rater reliability indicates that subjective biases are minimised, and interpretations are consistent.
social desirability bias — trying to present oneself in the best light by determining what a test is asking.
This bias occurs when participants alter their responses to self-report measures to appear more socially acceptable or favourable, rather than giving truthful answers. This can reduce the validity of the data collected.
filler questions — items put into a questionnaire, interview or test to disguise the aim of the study by hiding the important questions among irrelevant ones so that participants are less likely to alter their behaviour by working out the aims.
Filler questions are used to distract participants from the true purpose of a study, reducing the likelihood of demand characteristics. By including irrelevant questions, researchers can mask the specific focus of their investigation.
interview — a research method using verbal questions asked directly, e.g. face-to-face or on the telephone.
Interviews are a form of self-report where researchers verbally ask participants questions. They can range from highly structured to very flexible, allowing for different depths of information gathering.
structured interview — an interview with questions in a fixed order which may be scripted. Consistency might also be required for the interviewer’s posture, voice, etc. so they are standardised.
Structured interviews follow a rigid format with pre-determined questions asked in a specific order, ensuring high consistency and replicability. This standardisation helps to reduce interviewer bias.
unstructured interview — an interview in which most questions (after the first one) depend on the respondent’s answers. A list of topics may be given to the interviewer.
Unstructured interviews are flexible, allowing the interviewer to adapt questions based on the participant's responses, leading to rich, in-depth qualitative data. While providing depth, this approach can be less consistent across participants.
semi-structured interview — an interview with a fixed list of open and closed questions. The interviewer can add more questions if necessary.
Semi-structured interviews combine elements of both structured and unstructured approaches, offering a balance between consistency and flexibility. They typically have a core set of questions but allow for exploration of interesting responses.
subjectivity — a personal viewpoint, which may be biased by one’s feelings, beliefs or experiences, so may differ between individual researchers. It is not independent of the situation.
Subjectivity refers to interpretations or observations that are influenced by personal feelings, beliefs, or experiences. This can lead to bias and a lack of consistency between different researchers.
objectivity — an unbiased external viewpoint that is not affected by an individual’s feelings, beliefs or experiences, so should be consistent between different researchers.
Objectivity refers to an unbiased, factual viewpoint that is not influenced by personal feelings or experiences. Objective observations and interpretations are consistent across different researchers, enhancing reliability.
naturalistic observation — a study conducted by watching the participants’ behaviour in their normal environment without interference from the researchers in either the social or physical environment.
Naturalistic observations involve observing behaviour in its natural setting without any manipulation by the researcher. This method offers high ecological validity as behaviour is observed in a real-world context.
controlled observation — a study conducted by watching the participants’ behaviour in a situation in which the social or physical environment has been manipulated by the researchers. It can be conducted in either the participants’ normal environment or in an artificial situation.
Controlled observations involve some manipulation of the environment by the researcher, allowing for more control over extraneous variables. This can occur in either a natural or artificial setting, balancing ecological validity with control.
unstructured observation — a study in which the observer records the whole range of possible behaviours, which is usually confined to a pilot stage at the beginning of a study to refine the behavioural categories to be observed.
In unstructured observations, the observer records all behaviours they deem relevant, often used in initial stages to identify key behaviours. This approach provides rich, detailed qualitative data but can be challenging to analyse systematically.
structured observation — a study in which the observer records only a limited range of behaviours.
Structured observations involve recording specific, pre-defined behaviours using a systematic approach, often with behavioural categories. This method yields quantitative data and enhances inter-observer reliability.
behavioural categories — the activities recorded in an observation. They should be operationalised (clearly defined) and should break a continuous stream of activity into discrete recordable events. They must be observable actions rather than inferred states.
Behavioural categories are specific, observable actions that researchers define and record during an observation. They must be clearly operationalised to ensure consistency and inter-observer reliability, allowing for systematic data collection.
inter-observer reliability — the consistency between two researchers watching the same event, i.e. whether they will produce the same records.
Inter-observer reliability assesses the agreement between two or more observers recording the same behaviour. High agreement indicates that the behavioural categories are well-defined and consistently applied, increasing the reliability of the observation.
participant observer — a researcher who watches from the perspective of being part of the social setting.
A participant observer actively engages in the group or situation being studied, gaining an insider's perspective. This can provide rich, qualitative data but risks observer bias and ethical challenges regarding informed consent.
non-participant observer — a researcher who does not become involved in the situation being studied, e.g. by watching through one-way glass or by keeping apart from the social group of the participants.
A non-participant observer remains separate from the observed group, maintaining objectivity and reducing the risk of influencing participants' behaviour. This approach often yields more objective data but may lack the depth of insight gained from participation.
overt observer — the role of the observer is obvious to the participants.
In overt observation, participants are aware that they are being observed. While this is ethically sound, it can lead to demand characteristics as participants may alter their behaviour due to being watched.
covert observer — the role of the observer is not obvious, e.g. because they are hidden or disguised.
In covert observation, participants are unaware they are being observed, which reduces demand characteristics and increases the naturalness of behaviour. However, this raises significant ethical concerns regarding informed consent and privacy.
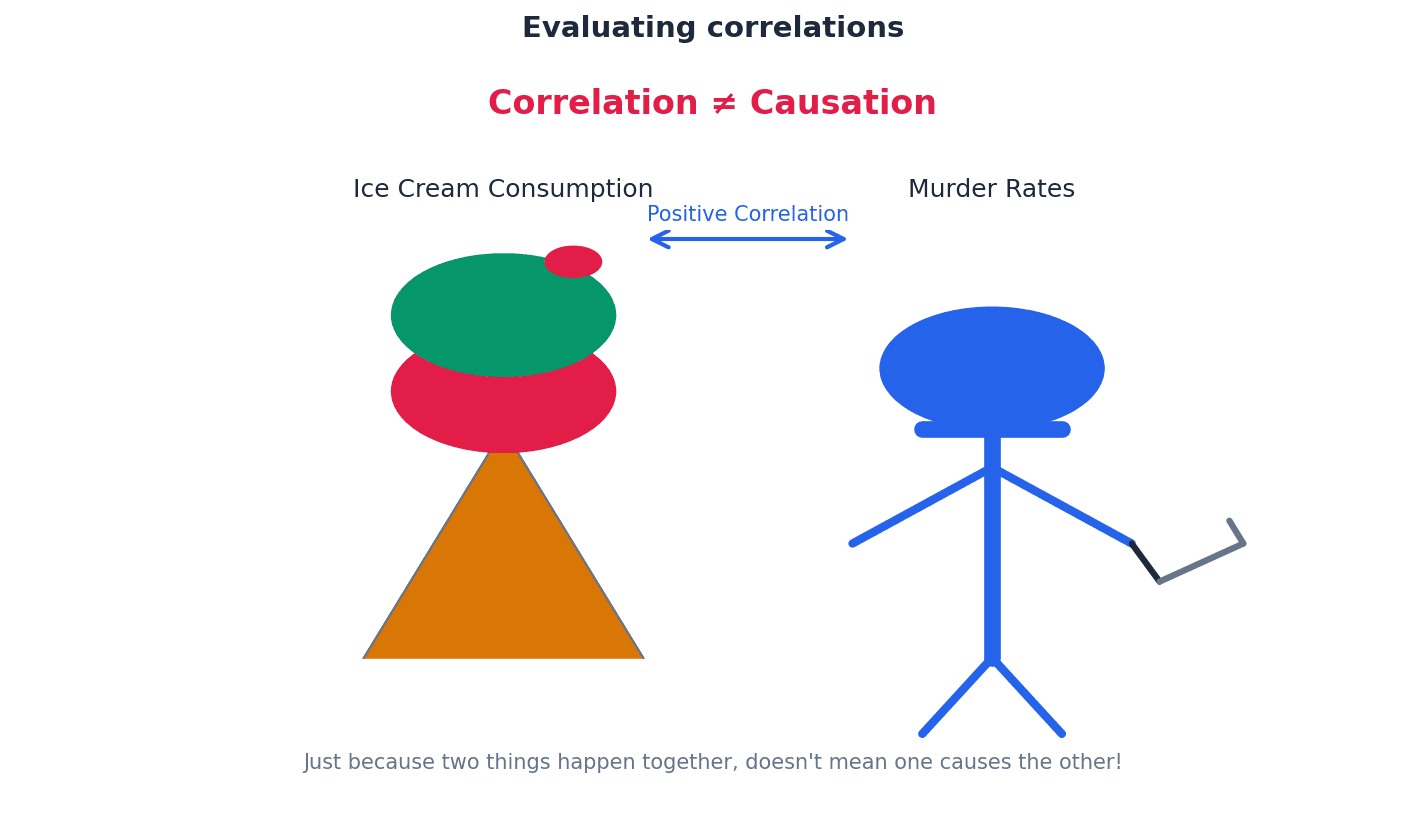
correlation — a research method which looks for a causal relationship between two measured variables. A change in one variable is related to a change in the other (although these changes cannot be assumed to be causal).
Correlations investigate the relationship between two measured variables, determining if changes in one are associated with changes in the other. However, it is crucial to remember that correlation does not imply causation; a third variable could be responsible for the observed relationship.
Students often confuse correlation with causation. Remember that if two variables are correlated, one does not necessarily cause the other; a third variable could be responsible.
positive correlation — a relationship between two variables in which an increase in one accompanies an increase in the other, i.e. the two variables increase together.
A positive correlation indicates that as one variable increases, the other variable also tends to increase. For example, a positive correlation might exist between hours of study and exam scores.
negative correlation — a relationship between two variables in which an increase in one accompanies a decrease in the other, i.e. higher scores on one variable correspond with lower scores on the other.
A negative correlation indicates that as one variable increases, the other variable tends to decrease. For instance, a negative correlation might be found between the number of hours spent watching TV and academic performance.
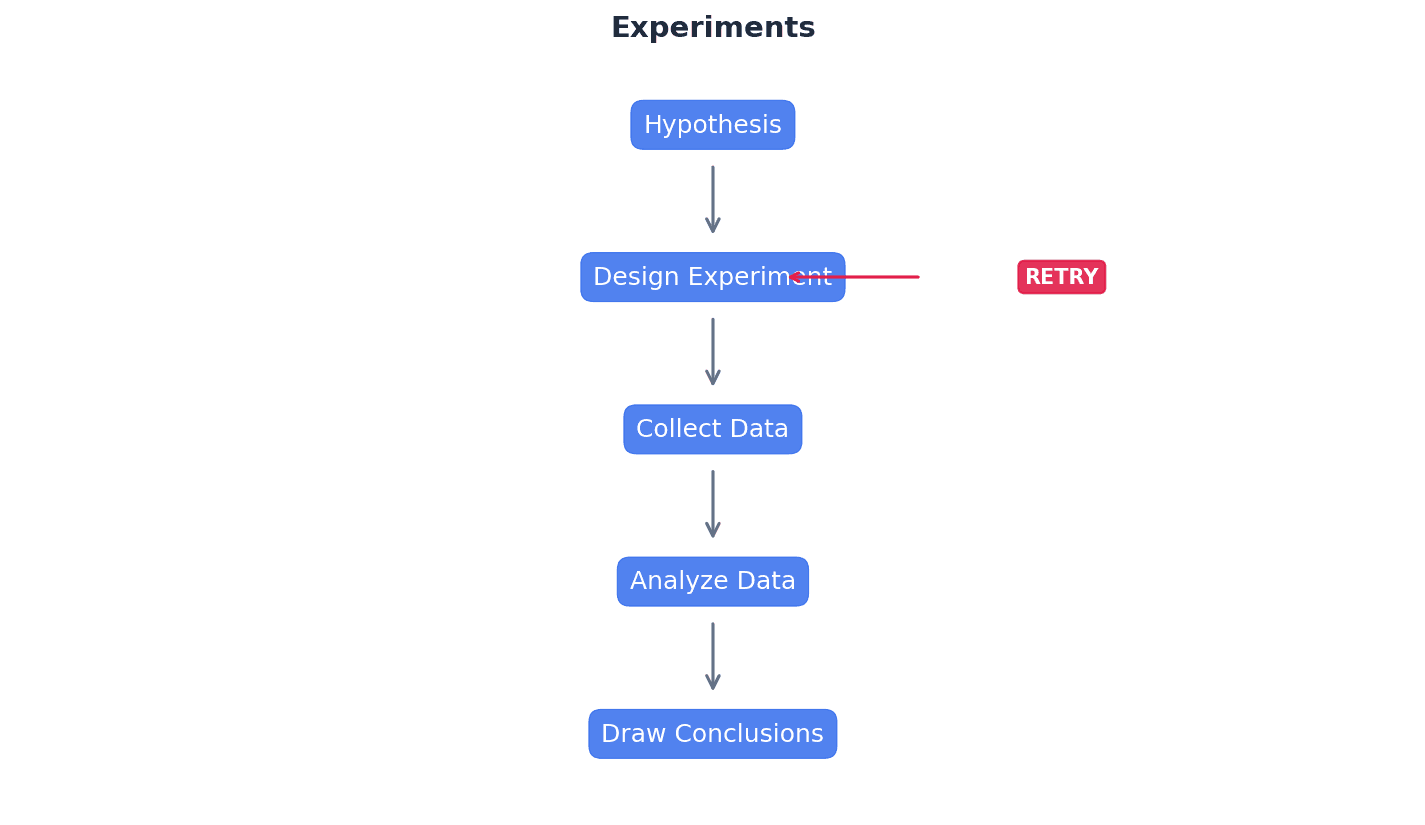
Psychological research begins with clearly defined aims and hypotheses. An aim states the general purpose of the study, while a hypothesis is a testable statement predicting the outcome. Hypotheses can be directional (predicting a specific outcome), non-directional (predicting a difference or relationship without specifying direction), or null (predicting no difference or relationship).
hypothesis — a testable statement predicting a difference between levels of the independent variable (in an experiment) or a relationship between variables (in a correlation).
A hypothesis is a precise, testable prediction about the outcome of a study. It guides the research and specifies what the researcher expects to find regarding the relationship between variables or differences between conditions.
alternative hypothesis — the testable statement which predicts a difference or relationship between variables in a particular investigation.
The alternative hypothesis is the primary prediction of the researcher, stating that there will be a significant difference or relationship between the variables being studied. It is the opposite of the null hypothesis.
non-directional (two-tailed) hypothesis — a statement predicting only that one variable will be related to another, e.g. that there will be a difference in the DV between levels of the IV in an experiment or that there will be a relationship between the measured variables in a correlation.
A non-directional hypothesis predicts that there will be a difference or relationship between variables, but it does not specify the direction of that difference or relationship. For example, 'There will be a difference in memory recall between participants who listen to music and those who do not'.
directional (one-tailed) hypothesis — a statement predicting the direction of a relationship between variables, e.g. in an experiment whether the levels of the IV will produce an increase or a decrease in the DV or in a correlation whether an increase in one variable will be linked to an increase or a decrease in another variable.
A directional hypothesis predicts the specific direction of the difference or relationship between variables. For example, 'Participants who listen to music will have lower memory recall scores than those who do not listen to music'.
null hypothesis — a testable statement saying that any difference or correlation in the results is due to chance, i.e. that no pattern in the results has arisen because of the variables being studied.
The null hypothesis states that there will be no significant difference or relationship between the variables, and any observed patterns are due to chance. Researchers aim to disprove the null hypothesis to support their alternative hypothesis.
operationalisation — the definition of variables so that they can be accurately manipulated, measured or quantified and replicated. This includes the IV and DV in experiments and the two measured variables in correlations.
Operationalisation involves precisely defining how variables will be manipulated or measured in a study. This ensures clarity, replicability, and allows for objective data collection. For example, 'attention' might be operationalised as 'number of correct responses on a computerised task'.
Students often provide vague operationalisation of variables. Remember to specify exactly how variables will be manipulated or measured (e.g., 'happiness' defined as 'score on a 1-10 happiness scale').
Clearly define and operationalise IVs and DVs in your hypotheses to show a clear understanding of experimental design.
situational variable — a confounding variable caused by an aspect of the environment, e.g. the amount of light or noise.
Situational variables are environmental factors that could influence the dependent variable, potentially confounding the results if not controlled. Examples include temperature, lighting, or noise levels in the experimental setting.
control — a way to keep a potential extraneous variable constant, e.g. between levels of the IV, to ensure measured differences in the DV are likely to be due to the IV, raising validity.
Controls are measures taken to minimise the influence of extraneous variables, ensuring that any observed changes in the dependent variable are genuinely due to the independent variable. This enhances the internal validity of the study.
The process of selecting participants for a study from a larger population is known as sampling. The chosen sampling technique significantly impacts the generalisability of the findings. Different methods, such as opportunity, volunteer, and random sampling, each have their own strengths and weaknesses regarding representativeness.
population — the group, sharing one or more characteristics, from which a sample is drawn.
The population refers to the entire group of individuals that a researcher is interested in studying and to whom the findings are intended to apply. It is the broader group from which a sample is selected.
sample — the group of people selected to represent the population in a study.
A sample is a smaller, manageable group of individuals chosen from the population to participate in a research study. The goal is for the sample to be representative of the population so that findings can be generalised.
sampling technique — the method used to obtain the participants for a study from the population.
Sampling techniques are the specific procedures used to select participants from a population. The choice of technique influences how representative the sample is and, consequently, the generalisability of the study's results.
opportunity sample — participants are chosen because they are available, e.g. university students are selected because they are present at the university where the research is taking place.
Opportunity sampling involves selecting participants who are readily available and convenient to the researcher. While easy to implement, this method often leads to unrepresentative samples, limiting generalisability.
volunteer (self-selected) sample — participants are invited to participate, e.g. through advertisements via email or notices. Those who reply become the sample.
Volunteer sampling involves participants choosing to take part in a study, often in response to an advertisement. This can lead to a biased sample as volunteers may share certain characteristics, affecting generalisability.
random sample — all members of the population (i.e. possible participants) are allocated numbers and a fixed amount of these are selected in a unbiased way, e.g. by taking numbers from a hat.
Random sampling ensures that every member of the target population has an equal chance of being selected for the sample. This method aims to create a highly representative sample, thereby increasing the generalisability of the findings.
After collecting data, psychologists analyse it to draw conclusions. Data can be quantitative (numerical) or qualitative (descriptive). Analysis involves using measures of central tendency (mean, median, mode) to find typical scores and measures of spread (range, standard deviation) to understand data variation.
quantitative data — numerical results about the quantity of a psychological measure such as pulse rate or a score on an intelligence test.
Quantitative data consists of numerical information that can be measured and expressed in numbers. This type of data is objective and can be statistically analysed, allowing for precise comparisons and conclusions.
qualitative data — descriptive, in-depth results indicating the quality of a psychological characteristic, such as responses to open questions in self-reports or case studies and detailed observations.
Qualitative data is descriptive and non-numerical, providing rich, in-depth insights into psychological phenomena. It often comes from open-ended questions, interviews, or detailed observations, offering a deeper understanding of experiences.
measure of central tendency — a mathematical way to find the typical or average score from a data set, using the mode, median or mean.
Measures of central tendency provide a single value that represents the centre or typical value of a data set. The mode, median, and mean are commonly used to summarise data and give an idea of the 'average' score.
mode — the measure of central tendency that identifies the most frequent score(s) in a data set.
The mode is the value that appears most frequently in a data set. It is useful for categorical data and can sometimes have multiple values if several scores share the highest frequency.
median — the measure of central tendency that identifies the middle score of a data set which is in rank order (smallest to largest). If there are two numbers in the middle they are added together and divided by two.
The median is the middle value in a data set when the scores are arranged in ascending or descending order. It is less affected by extreme outliers than the mean, making it a robust measure for skewed data.
mean — the measure of central tendency calculated by adding up all the scores and dividing by the number of scores in the data set.
The mean is the arithmetic average of all scores in a data set. It is the most commonly used measure of central tendency but can be influenced by extreme values (outliers).
measure of spread — a mathematical way to describe the variation or dispersion within a data set.
Measures of spread, also known as measures of dispersion, indicate how much the scores in a data set vary from each other or from the central tendency. The range and standard deviation are common examples.
range — the difference between the biggest and smallest values in the data set plus one (a measure of spread).
The range is the simplest measure of spread, calculated by subtracting the lowest score from the highest score and adding one (for continuous data). It provides a quick indication of the total spread of data.
Students often forget to add 'plus one' in range calculation. In psychology, the range is calculated as (highest score - lowest score) + 1 to account for continuous scales.
standard deviation — a calculation of the average difference between each score in the data set and the mean. Bigger values indicate greater variation (a measure of spread).
Standard deviation is a sophisticated measure of spread that quantifies the average amount of variation or dispersion of individual data points around the mean. A smaller standard deviation indicates that data points are clustered closely around the mean, while a larger one suggests greater variability.
Standard Deviation
Used to calculate the average difference between each score and the mean. A larger value indicates greater variation in the data set. The deviation 'd' can sometimes be used in place of (x - \bar{x}).
When evaluating research methods, always provide both strengths and weaknesses, linking them to validity, reliability, and generalisability.
For 'apply' questions, use specific details from the novel research situation to illustrate your points about methods, ethics, or variables.
Use appropriate terminology (e.g., 'extraneous variable', 'demand characteristics', 'counterbalancing') accurately to demonstrate expert knowledge.
Advantages
Disadvantages
Advantages
Disadvantages
Advantages
Disadvantages
Advantages
Disadvantages
Advantages
Disadvantages
For 12+ mark questions, always evaluate both sides before reaching a judgement.
Adapt these for any 12+ mark question on this topic
Examiner tips
Introduction
Start by briefly introducing the research method in question and its primary purpose (e.g., experiments aim to establish cause-and-effect). State your main argument or the key areas you will evaluate.
Main Body
Evaluation
Integrate evaluative points throughout your main body paragraphs rather than saving them for a separate section. For example, after stating a strength, immediately follow with a 'however' statement that qualifies or limits that strength (e.g., 'However, this high control often leads to low ecological validity'). Ensure your evaluation is balanced and critical.
Conclusion
Summarise your main arguments regarding the strengths and weaknesses of the research method. Offer a final, balanced judgment on its overall utility or appropriateness for different research questions. You might suggest when this method is most suitable or how its limitations can be mitigated.